. 2019 Jun;81(6):3720-3733.
doi: 10.1002/mrm.27693. Epub 2019 Feb 12.

Radiofrequency phase encoded half-pulses in simultaneous multislice ultrashort echo time imaging

Affiliations

Radiofrequency phase encoded half-pulses in simultaneous multislice ultrashort echo time imaging

Christoph Rettenmeier et al. Magn Reson Med. 2019 Jun.

Abstract

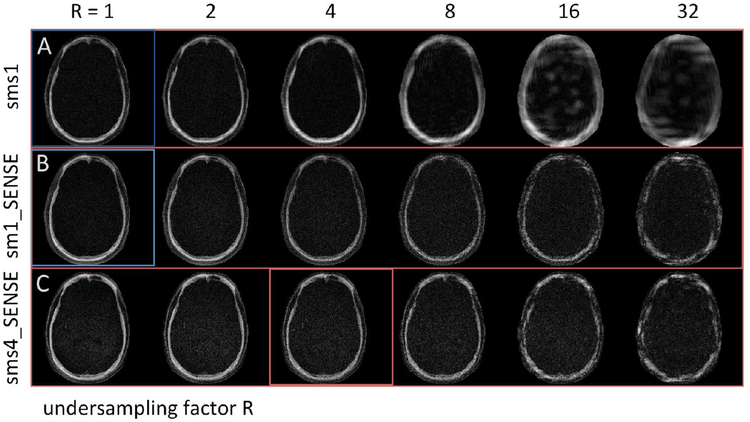
Purpose: To describe a simultaneous multislice (SMS) ultrashort echo time (UTE) imaging method using radiofrequency phase encoded half-pulses in combination with power independent of number of slices (PINS) inversion recovery (IR) pulses to generate multiple-slice images with short T2 * contrasts in less than 3 min with close to an eightfold acceleration compared with a standard 2D approach.

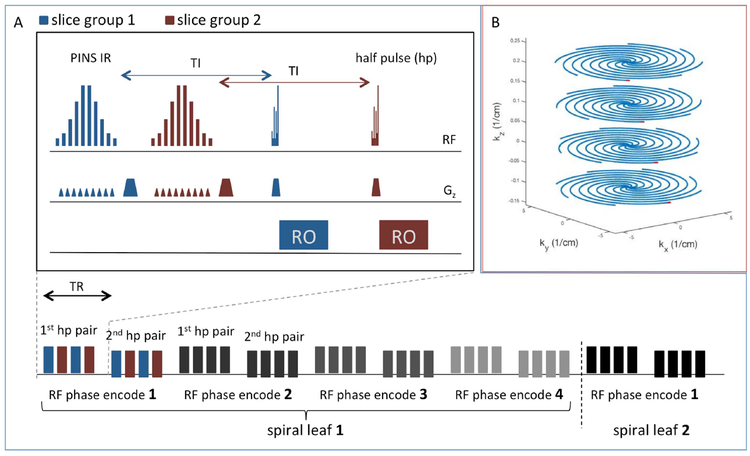
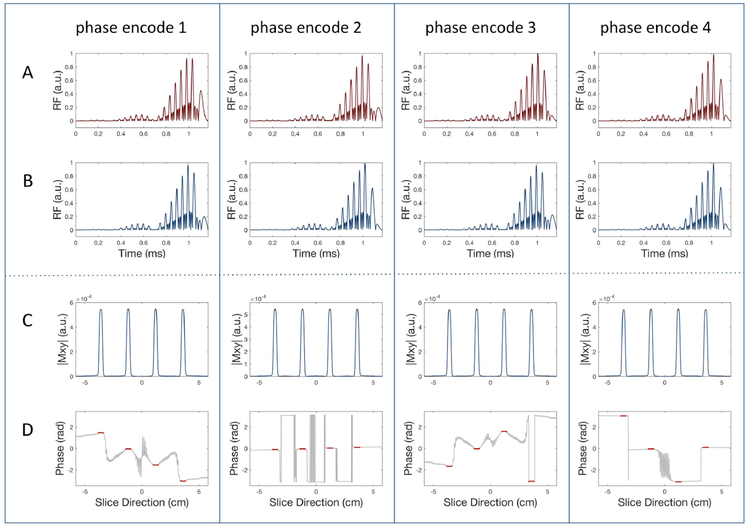
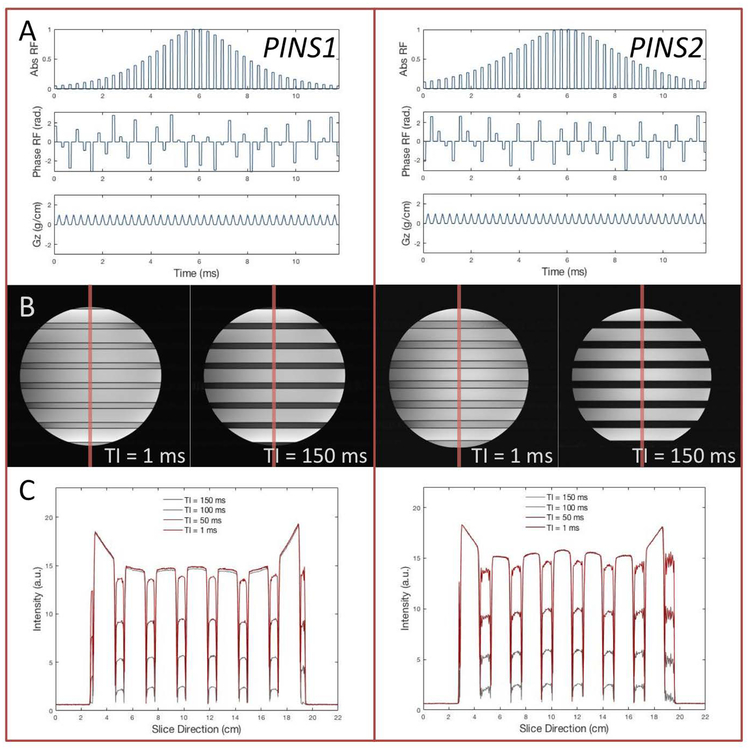
Theory and methods: Radiofrequency phase encoding is applied in an SMS (NSMS = 4) excitation scheme using "sinc" half-pulses. With the use of coil sensitivity encoding (SENSE) and controlled aliasing in parallel imaging (CAIPI) in combination with a gradient echo 2D spiral readout trajectory and IR PINS pulses for contrast enhancement a fast UTE sequence is developed. Images are obtained using a model-based reconstruction method. Sequence details and performance tests on phantoms as well as the heads of healthy volunteers at 3T are presented.

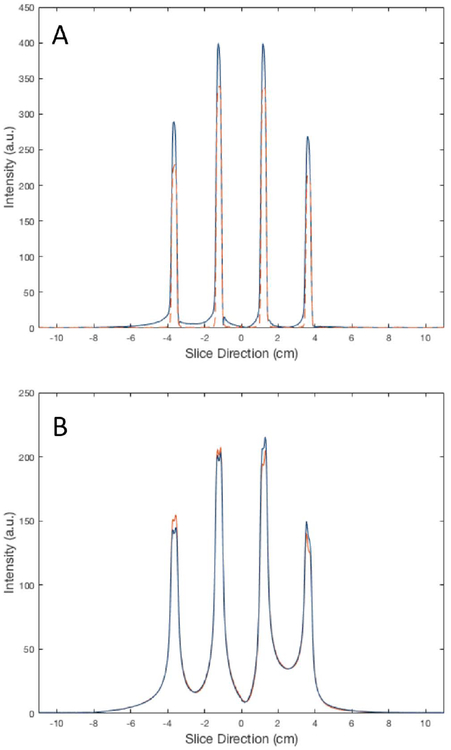
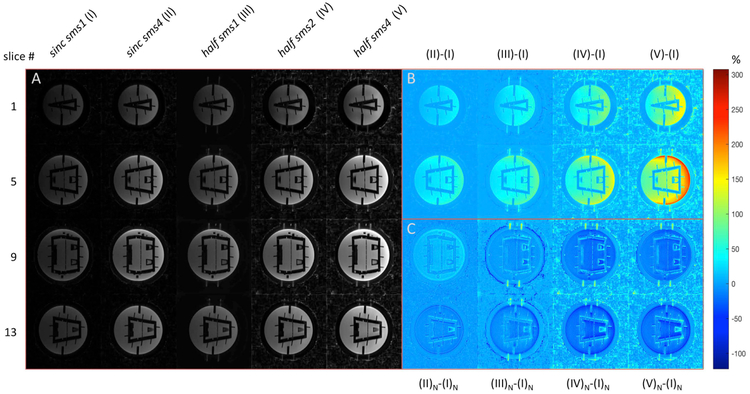
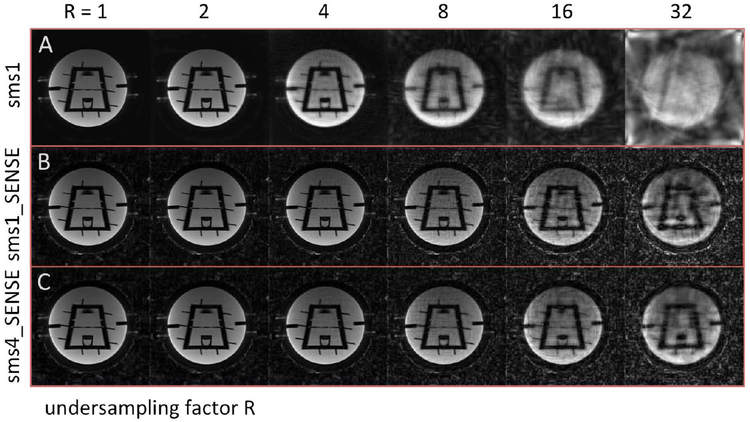
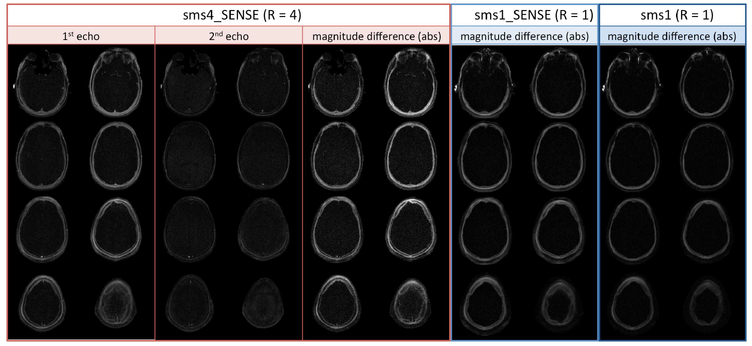
Results: An SMS UTE sequence with an undersampling factor of 4 is developed using radiofrequency phase encoded half-pulses and PINS IR pulses which enables the acquisition of 8 slices at 0.862 mm2 resolution in less than 3-min scan time. UTE images of the head are obtained showing highlighted signal of cortical bone. Image quality and T2 contrast are comparable to the one obtained by corresponding single slice acquisitions with only minor deviations.

Conclusions: The method combining radiofrequency phase encoded SMS half-pulses and PINS IR pulses presents a suitable approach to SMS UTE imaging. The usage of coil sensitivity information and increased sampling density by means of interleaved slice group acquisitions allows to reduce the total scan time by a factor close to 8.

Keywords: CAIPI; PINS; SMS; UTE; half-pulse; simultaneous multislice excitation; ultrashort echo time imaging.


Figures

Figure 1:
Figure 1:
(A) Sequence timing diagram of SMS half-pulse sequence: slice groups (blue and red) are acquired in an interleaved fashion; the acquisition of the half-pulse pairs, RF phase encodings and spiral leafs occur consecutively in this order from the lowest to highest structuring level. (B) Schematic presentation of the 3D CAIPI type undersampling strategy. Red dots mark the outer most part of selected spiral leaves to indicate the staggered orientation of consecutive k-space planes.
Figure 2:
Figure 2:
Magnitude of a set of half-pulse pairs (A, B) with NSMS = 4 (half sms4’) as well as the corresponding sum of the simulated magnitude (C) and phase (D) of the half-pulse excitation profiles in the slice direction. The second half-pulse is played out with a negative z-gradient (see Supporting Information Figure S1) in order to traverse k-space from the opposed end to the center. The slice phase encoding pattern for each excitation is highlighted in D (red). Wong phase cycling scheme was not applied to the pulse shape shown in this figure in order to make the RF phase encoding scheme apparent. Further information including Wong phase half-pulse and z-gradient shapes as well as simulated individual half-pulse excitation profiles are given in Supporting Information Figure S1.
Figure 3:
Figure 3:
Comparison of the experimentally determined slice profile (projections of spherical water phantom) between the sinc pulse (sinc sms4 in red) and half-pulse excitation (half sms4 in blue) is given in (A). The half-pulse profile depicted in (A) represents the sum of the individual half-pulse excitation profiles shown in (B). The half-pulse profile suffers from considerable out-of-slice excitation while the sinc pulse excitation has a well-defined profile. The variation in intensity between slices largely derives from the different curvature at each slice location of spherical shaped phantom. Profiles (sum of half-pulse excitations) in (C) and (D) are measured using a UTE phantom with T2 = 660 μs and 2.6 ms, respectively. Slice profile broadening is observed going to short T2 component for which the relaxation time is well below the duration of the half-pulse (T2<TRF). Additional information regarding the slice profile characterization are given in the Supporting Information Figures S2–S5.
Figure 4:
Figure 4:
Comparison of structural phantom images obtained with sinc full and half-pulses using RF phase encoded SMS imaging. Four slices (# 1, 5, 9, 13) out of a total of 16 slices acquired with a gap of 100% are shown for the half sms1, half sms2 and half sms4 pulse as well as the sinc sms1 and sinc sms4 pulses (Figure 3 A). Both sinc pulse images were scaled by a factor of 2 for windowing purposes. Images were otherwise windowed identically. Absolute differences for slices 1 and 5 are shown in B and differences after normalization (division by mean value) for slices 9 and 13 in C. Intensities were scaled relative to the maximum value of sinc sms1 images with an additional scaling factor of x5 for the normalized difference images in C. No masking was applied.
Figure 5:
Figure 5:
Comparison of undersampled half-pulse images for NSMS = 1 and 4. For NSMS = 1 the images were reconstructed with coil sensitivity information (sms1_SENSE, row B) and without (sms1, row A). The images for NSMS = 4 were obtained using 3D CAIPI type undersampling pattern (see Figure 1, B) in combination with SENSE reconstruction (sms4_SENSE, row C). Images are shown for an undersampling factor R = 1, 2, 4, 8, 16, 32. Images were normalized (divided by mean value).
Figure 6:
Figure 6:
Pulse profile and excitation characteristics of two inversion-recovery PINS pulses used in this study. PINS1 (left column): pulse length = 11.8 ms, μ = 5, 40 rectangular pulses, slice width = 0.5 and slice separation = 2.4 cm; PINS2 (right column): pulse length = 11.8 ms, μ = 8, 40 rectangular pulses, slice width = 0.6 and slice separation = 2.4 cm. The magnitude, phase and z-gradients of both pulse designs are shown on top (A). Single slice FLASH images with the PINS pulse gradient blips played out in x-direction with TI = 1 ms and 150 ms are shown below (B), as well as the corresponding intensity profiles through the center of the phantom at TI = 1, 50, 100 and 150 ms (C).
Figure 7:
Figure 7:
The profile images of both IR pulses, PINS1 and PINS2 (Figure 6), on water/fat phantom TI = 1 ms are overlaid (upper half) with the excitation profile of the half sms4 profile in A. The red arrow indicates the area in the fat phantom where the excited slice location is not completely covered by the inversion band of the PINS1 pulse due to the spatial dislocation of the latter caused by the frequency offset of the lipid protons. On the bottom (B) selected slices of aqueous MnCl2 solution UTE phantom images are shown with T2 values of a few seconds (water) down to about 40 μs with TE = 100 μs and TI = 100 ms.
Figure 8:
Figure 8:
UTE head images: Two sets (eight slices) of echo images and magnitude differences obtained by the IR UTE SMS sequence using PINS2 with NSMS = 4, R = 4, TR = 300 ms, TE = 20/TE2 = 2.3 ms, TI = 100 ms, a 40° flip angle, 256 spiral leafs in less than 3 min scan time (sms4_SENSE). Fully sampled reference images reconstructed with and without SENSE using a corresponding single-slice IR UTE sequence (20:30 min scan time) are also presented (sms1_SENSE and sms1; nonselective IR pulse played out at a frequency offset of -270 Hz). Images were windowed and masked equally.
Figure 9:
Figure 9:
Comparison of undersampled half-pulse images for NSMS = 1 and 4. As above the images were reconstructed with coil sensitivity information (sms1_SENSE, row B) and without (sms1, row A) for NSMS = 1 and obtained using 3D CAIPI type undersampling pattern (see Figure 1, B) with SENSE reconstruction for NSMS = 4 (sms4_SENSE, row C). Images are shown for an undersampling factor R = 1, 2, 4, 8, 16, 32. All images were normalized (divided by mean value) and are masked equally. The boxes mark the images shown in Figure 8.

Similar articles

References

    1. Martyn P MRI of tissues with short T2s and T2*s. G. M. Bydder, G. D. Fullerton and I. R. Young. NMR in biomedicine 2013;26(10):1336–1337.
    1. Gatehouse PD, Bydder GM. Magnetic Resonance Imaging of Short T2 Components in Tissue. Clinical radiology 2003;58(1):1–19. - PubMed
    1. C EY, Jiang D, C BC. UTE imaging in the musculoskeletal system. Journal of Magnetic Resonance Imaging 2015;41(4):870–883. - PMC - PubMed
    1. MD P, LI J. Ultra-fast imaging using low flip angles and fids. Magnetic Resonance in Medicine 1995;34(4):525–529. - PubMed
    1. GD M, JP M, Bjoern H Ultrashort echo time imaging using pointwise encoding time reduction with radial acquisition (PETRA). Magnetic Resonance in Medicine 2012;67(2):510–518. - PubMed

Publication types