. 2019 Mar;7(1):22-40.
doi: 10.1002/iid3.241. Epub 2019 Feb 12.

Immune characteristics correlating with HSV-1 immune control and effect of squaric acid dibutyl ester on immune characteristics of subjects with frequent herpes labialis episodes

Affiliations

Immune characteristics correlating with HSV-1 immune control and effect of squaric acid dibutyl ester on immune characteristics of subjects with frequent herpes labialis episodes

Hugh McTavish et al. Immun Inflamm Dis. 2019 Mar.

Abstract

Introduction: Differences in immune characteristics, including immune gene expression by peripheral blood mononuclear cells (PBMCs), correlating with herpes labialis and good or poor immune control of herpes simplex virus type 1 (HSV-1), and how these characteristics change after dosing with squaric acid dibutyl ester (SADBE), were investigated.

Methods: PBMCs were collected from persons positive for IgG against HSV-1 and having frequent, infrequent, or no herpes labialis outbreaks. The PBMCs were tested for proliferation against HSV-1 and a fungal antigen (Candida) and immune gene expression in the presence of HSV-1 and Candida. On day 1 after blood collection the subjects with frequent outbreaks were dosed topically on the arm once with SADBE, and their PBMCs were collected and tested 8 weeks later.

Results: Those with good immune control of their HSV-1 infection (fewer outbreaks) differ from those with poorer immune control in these ways: (1) Greater PBMC proliferation in vitro to HSV-1, HSV-1-infected cell extracts, and Candida considered together (P < 0.01). (2) Higher expression of IFNG and five other immune-related genes (P < 0.05 for each) and lower expression of IL5 and two other immune-related genes (P < 0.05 for each) in PBMCs in vitro stimulated with HSV-1 virus. The subjects with frequent outbreaks were treated once with SADBE, and 56 days later the PBMCs of these subjects differed from PBMCs from the same subjects taken on day 1 before treatment in exactly the same ways listed above as differences between those with good and poor immune control of HSV-1, and at the same levels of significance.

Conclusions: Higher IFNG and lower IL5 expression by PBMCs in the presence of HSV-1 correlate with fewer herpes labialis outbreaks, and a single topical dose of SADBE to the arm of subjects with frequent herpes labialis episodes improves immune response to HSV-1.

Keywords: herpes labialis; herpes simplex; herpesvirus 1; interferon gamma; interleukin-5; squaric acid; squaric acid dibutyl ester.


Figures

Figure 1
Figure 1
PBMC relative proliferation (CPM in medium with the test stimulus/CPM in negative control (medium alone). P values are for the indicated group/day versus A1 in the same stimulus. (n = 12.)
Figure 2
Figure 2
PBMC normalized proliferation in the three test stimuli taken together (HSV‐1‐infected cell extracts, heat‐inactivated HSV‐1, and Candida extract). Normalized proliferation values are the individual relative proliferation value in a given test stimulus as a percent of the C1 relative proliferation group average in that stimulus. P values are for the indicated group/day versus A1
Figure 3
Figure 3
Anti‐HSV‐1 IgG levels in serum by group and day ±SEM. P values are for the indicated group/day versus A1
Figure 4
Figure 4
Average fold‐regulation of immune‐related genes from PBMCs of group B and C subjects pooled. The 10 most highly up‐regulated genes for each stimulus are in orange highlight and the genes down regulated at 0.70 or below are in yellow highlight. Fold‐regulation is absolute gene expression in the stimulus divided by absolute gene expression in the negative control
Figure 5
Figure 5
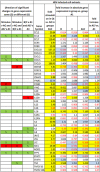
Comparison of changes or differences in gene expression of PBMCs in vitro stimulated with HSV‐1‐infected cell extracts in groups B+C in stimulus versus negative control (NC) (first column to right of genes); between groups B, C, or B+C versus A day 1 (2nd‐4th columns to right of genes), and in group A day 57 versus day 1 (far right column). Significant differences (P < 0.05) are highlighted in yellow; 0.20>P>0.05 in blue. Decreased expression (ratio less than 1.0) in any gene expression ratio is shown in red type. The left three columns show, for cases where there is a significant difference in gene expression (1) in the stimulus versus negative control; (2) in group C or B+C versus A1; and (3) in group A day 57 versus group A day 1, whether pairs of those significant differences are in the same direction (i.e., both increases or both decreases in gene expression) (S highlighted in green) or different directions (D highlighted in red)
Figure 6
Figure 6
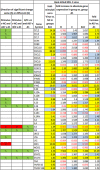
Comparison of changes or differences in gene expression of PBMCs in vitro stimulated with heat‐inactivated HSV‐1 virus in groups B+C in stimulus versus negative control (NC) (first column to right of genes); between groups B, C, or B+C versus A day 1 (2nd‐4th columns to right of genes), and in group A day 57 versus day 1 (far right column). Significant differences (P < 0.05) are highlighted in yellow; 0.20>P>0.05 in blue. Decreased expression (ratio less than 1.0) in any gene expression ratio is shown in red type. The left three columns show, for cases where there is a significant difference in gene expression (1) in the stimulus versus negative control; (2) in group C; or B+C versus A1; and (3) in group A day 57 versus group A day 1, whether pairs of those significant differences are in the same direction (i.e., both increases or both decreases in gene expression) (S highlighted in green) or different directions (D highlighted in red)
Figure 7
Figure 7
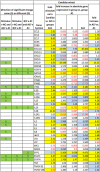
Comparison of changes or differences in gene expression of PBMCs in vitro stimulated with Candida extract in groups B+C in stimulus vs. negative control (NC) (first column to right of genes); between groups B, C, or B+C versus A day 1 (2nd‐4th columns to right of genes), and in group A day 57 versus day 1 (far right column). Significant differences (P < 0.05) are highlighted in yellow; 0.20>P>0.05 in blue. Decreased expression (ratio less than 1.0) in any gene expression ratio is shown in red type. The left three columns show, for cases where there is a significant difference in gene expression (1) in the stimulus versus negative control; (2) in group C or B+C versus A1; and (3) in group A day 57 versus group A day 1, whether pairs of those significant differences are in the same direction (i.e., both increases or both decreases in gene expression) (S highlighted in green) or different directions (D highlighted in red)
Figure 8
Figure 8
Comparison of differences in gene expression of PBMCs in vitro in negative control medium (NC) between groups B, C, or B+C versus A day 1 (2nd‐4th columns to right of genes), and in group A day 57 versus day 1 (far right column). Significant differences (P < 0.05) are highlighted in yellow; 0.20>P>0.05 in blue. Decreased expression (ratio less than 1.0) in any gene expression ratio is shown in red type. The left three columns show, for cases where there is a significant difference in gene expression (1) in the stimulus versus negative control; (2) in group C or B+C versus A1; and (3) in group A day 57 versus group A day 1, whether pairs of those significant differences are in the same direction (i.e., both increases or both decreases in gene expression) (S highlighted in green) or different directions (D highlighted in red)
Figure 9
Figure 9
Ratios of PBMC absolute gene expression in group A on days 15 and 57 compared to day 1. Significant differences (P < 0.05) are highlighted in yellow; 0.20>P>0.05 in blue
Figure 10
Figure 10
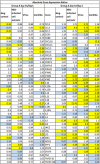
List of every gene where both groups B+C vs. A1 and A57 vs. A1 had significant differences of absolute gene expression in a given condition, and the direction of the difference relative to A1. In every case, the direction of the difference was the same for B+C vs. A1 and A57 vs. A1—both higher than A1 (+) or both lower than A1 (−)

Similar articles

Cited by

References

    1. Woo S. B., Challacombe S. J. Management of recurrent oral herpes simplex infections. Oral Surg Oral Med Oral Pathol Oral Radiol Endod. 2007; 103:e11–e18. - PubMed
    1. Sarnoff D. S. Treatment of recurrent herpes labialis. J Drugs Dermatol. 2014; 13:1016–1018. - PubMed
    1. Opstelten W., Neven A. K., Eekhof J. Treatment and prevention of herpes labialis. Can Fam Physician. 2008; 54:1683–1687. - PMC - PubMed
    1. Parks C. G., Andrew M. E., Blanciforti L. A., Luster M. I. Variation in the WBC differential count and other factors associated with reporting of herpes labialis: a population‐based study of adults. FEMS Immunol Med Microbiol. 2007; 51:336–343. - PubMed
    1. Lorette G., Crochard A., Mimaud V., Wolkenstein P., Stalder J. F., El Hasnaoui A. A survey on the prevalence of orofacial herpes in France: the INSTANT study. J Am Acad Dermatol. 2006; 55:225–232. - PubMed