

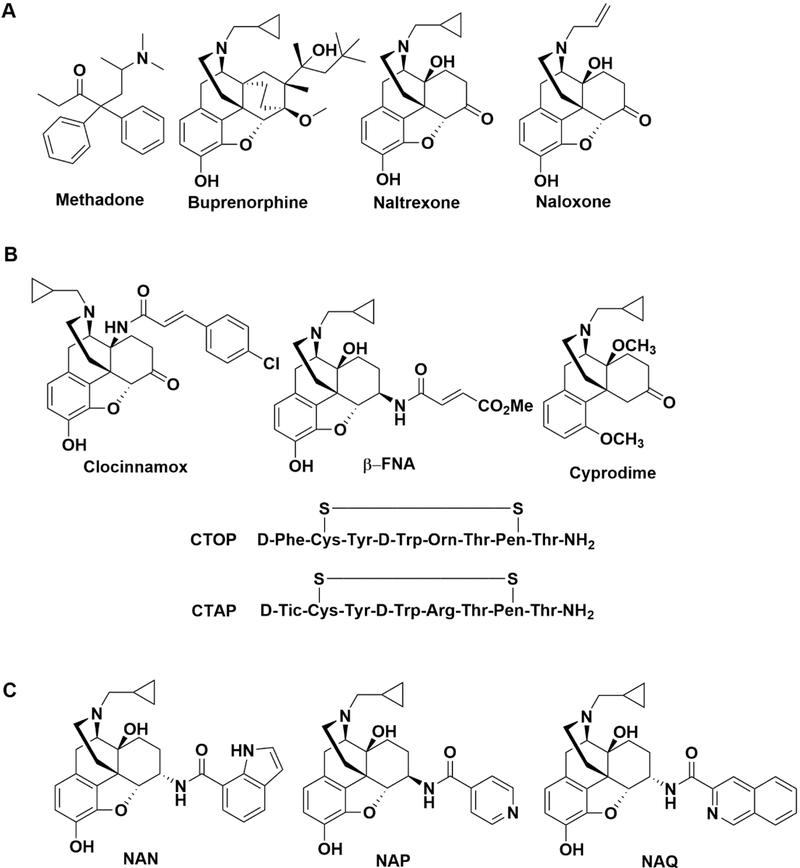
Characterization of 17-Cyclopropylmethyl-3,14β-dihydroxy-4,5α-epoxy-6α-(indole-7-carboxamido)morphinan (NAN) as a Novel Opioid Receptor Modulator for Opioid Use Disorder Treatment
- PMID: 30758946
- PMCID: PMC6520168
- DOI: 10.1021/acschemneuro.9b00038
Characterization of 17-Cyclopropylmethyl-3,14β-dihydroxy-4,5α-epoxy-6α-(indole-7-carboxamido)morphinan (NAN) as a Novel Opioid Receptor Modulator for Opioid Use Disorder Treatment
Abstract
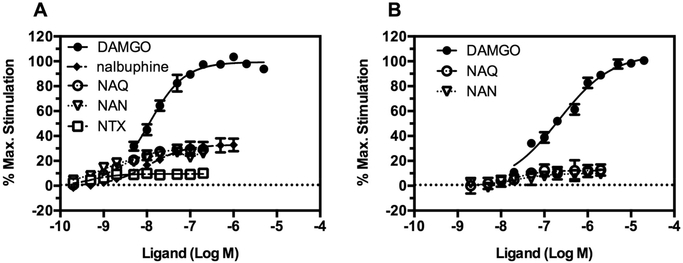
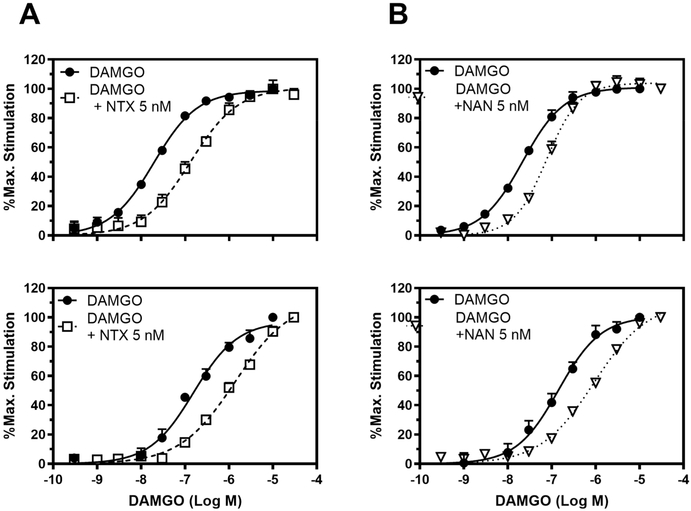
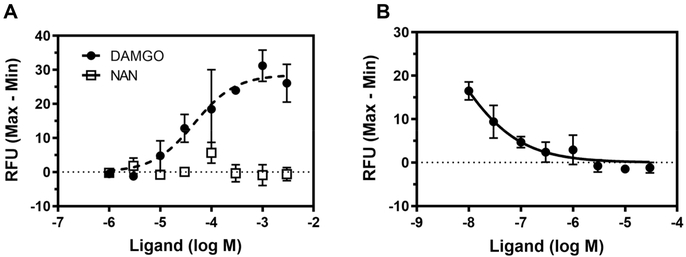
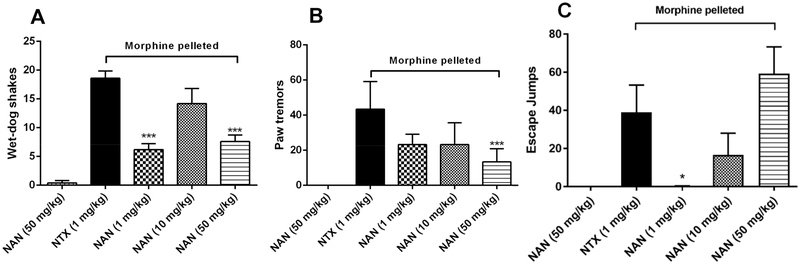
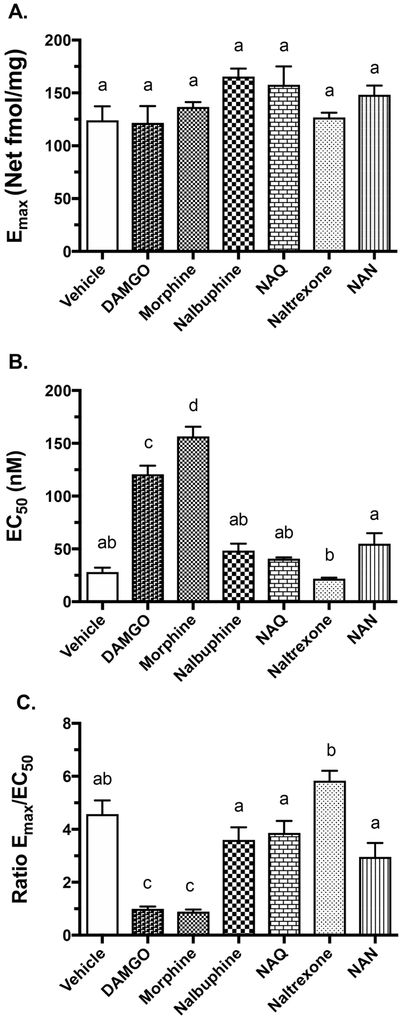
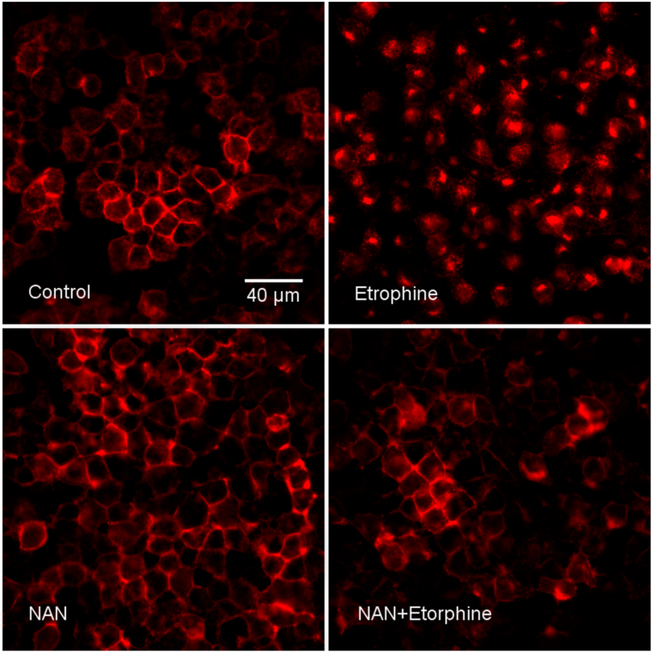
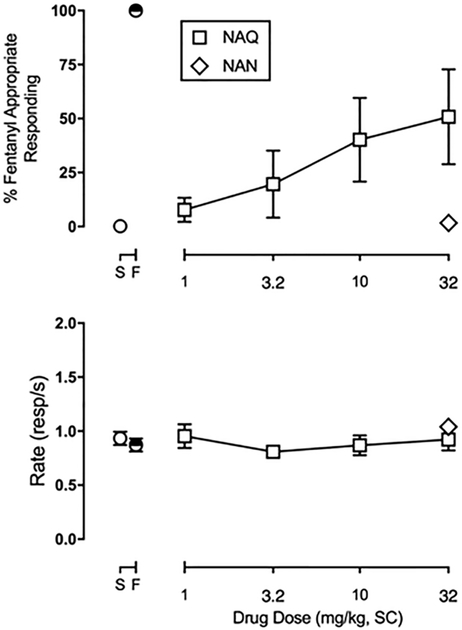
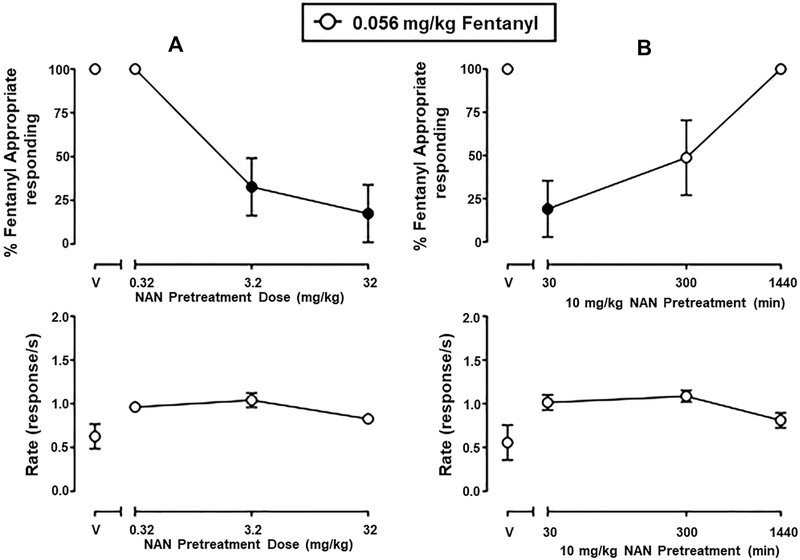
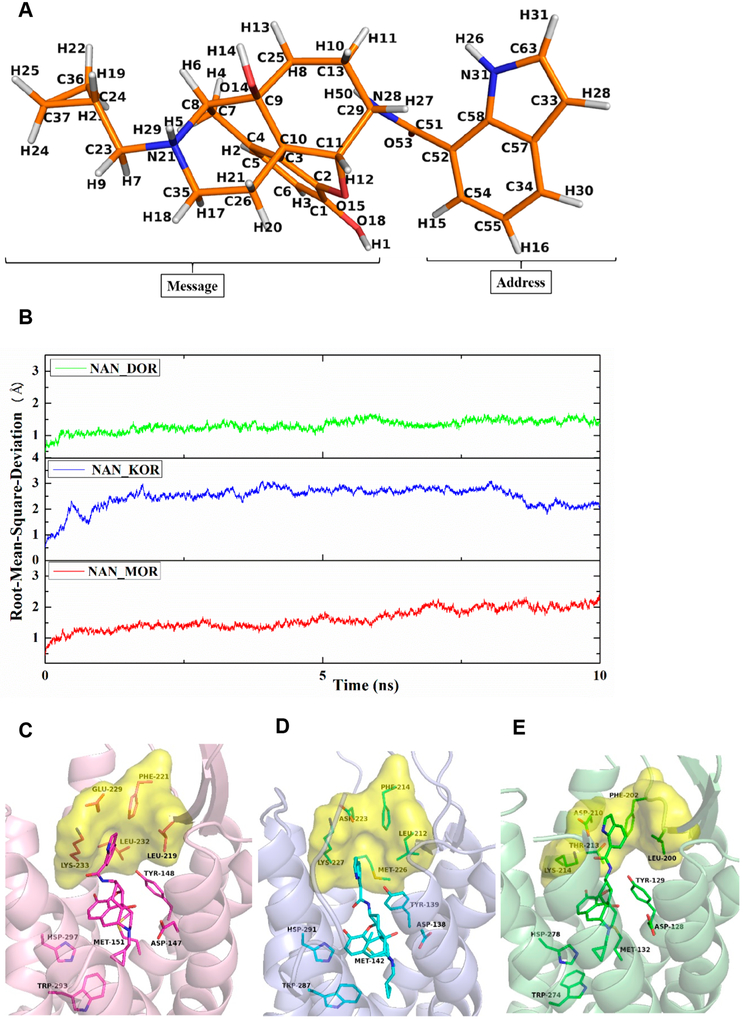
The opioid crisis is a significant public health issue with more than 115 people dying from opioid overdose per day in the United States. The aim of the present study was to characterize the in vitro and in vivo pharmacological effects of 17-cyclopropylmethyl-3,14β-dihydroxy-4,5α-epoxy-6α-(indole-7-carboxamido)morphinan (NAN), a μ opioid receptor (MOR) ligand that may be a potential candidate for opioid use disorder treatment that produces less withdrawal signs than naltrexone. The efficacy of NAN was compared to varying efficacy ligands at the MOR, and determined at the δ opioid receptor (DOR) and κ opioid receptor (KOR). NAN was identified as a low efficacy partial agonist for G-protein activation at the MOR and DOR, but had relatively high efficacy at the KOR. In contrast to high efficacy MOR agonists, NAN did not induce MOR internalization, downregulation, or desensitization, but it antagonized agonist-induced MOR internalization and stimulation of intracellular Ca2+ release. Opioid withdrawal studies conducted using morphine-pelleted mice demonstrated that NAN precipitated significantly less withdrawal signs than naltrexone at similar doses. Furthermore, NAN failed to produce fentanyl-like discriminative stimulus effects in rats up to doses that produced dose- and time-dependent antagonism of fentanyl. Overall, these results provide converging lines of evidence that NAN functions mainly as a MOR antagonist and support further consideration of NAN as a candidate medication for opioid use disorder treatment.
Keywords: NAN; Opioid use disorder; mixed function ligand; naltrexamine; opioid antagonist; μ opioid receptors.
Figures
Similar articles
-
Behavioral and cellular pharmacology characterization of 17-cyclopropylmethyl-3,14β-dihydroxy-4,5α-epoxy-6α-(isoquinoline-3'-carboxamido)morphinan (NAQ) as a mu opioid receptor selective ligand.Eur J Pharmacol. 2014 Aug 5;736:124-30. doi: 10.1016/j.ejphar.2014.04.041. Epub 2014 May 8. Eur J Pharmacol. 2014. PMID: 24815322 Free PMC article.
-
Design, syntheses, and pharmacological characterization of 17-cyclopropylmethyl-3,14β-dihydroxy-4,5α-epoxy-6α-(isoquinoline-3'-carboxamido)morphinan analogues as opioid receptor ligands.Bioorg Med Chem. 2015 Apr 15;23(8):1701-15. doi: 10.1016/j.bmc.2015.02.055. Epub 2015 Mar 6. Bioorg Med Chem. 2015. PMID: 25783191 Free PMC article.
-
Pharmacological characterization of 17-cyclopropylmethyl-3,14-dihydroxy-4,5-epoxy-6-[(3'-fluoro-4'-pyridyl)acetamido]morphinan (NFP) as a dual selective MOR/KOR ligand with potential applications in treating opioid use disorder.Eur J Pharmacol. 2019 Dec 15;865:172812. doi: 10.1016/j.ejphar.2019.172812. Epub 2019 Nov 16. Eur J Pharmacol. 2019. PMID: 31743739 Free PMC article.
-
Ligand-Free Signaling of G-Protein-Coupled Receptors: Relevance to μ Opioid Receptors in Analgesia and Addiction.Molecules. 2022 Sep 8;27(18):5826. doi: 10.3390/molecules27185826. Molecules. 2022. PMID: 36144565 Free PMC article. Review.
-
Buprenorphine Pharmacodynamics: A Bridge to Understanding Buprenorphine Clinical Benefits.Drugs. 2025 Feb;85(2):215-230. doi: 10.1007/s40265-024-02128-y. Epub 2025 Jan 28. Drugs. 2025. PMID: 39873915 Review.
Cited by
-
The Magic Methyl and Its Tricks in Drug Discovery and Development.Pharmaceuticals (Basel). 2023 Aug 15;16(8):1157. doi: 10.3390/ph16081157. Pharmaceuticals (Basel). 2023. PMID: 37631072 Free PMC article. Review.
-
Blocking potential metabolic sites on NAT to improve its safety profile while retaining the pharmacological profile.Bioorg Chem. 2024 Jul;148:107489. doi: 10.1016/j.bioorg.2024.107489. Epub 2024 May 22. Bioorg Chem. 2024. PMID: 38797065 Free PMC article.
-
Exploring naltrexamine derivatives featuring azaindole moiety via nitrogen-walk approach to investigate their in vitro pharmacological profiles at the mu opioid receptor.Bioorg Med Chem Lett. 2021 Jun 1;41:127953. doi: 10.1016/j.bmcl.2021.127953. Epub 2021 Mar 22. Bioorg Med Chem Lett. 2021. PMID: 33766769 Free PMC article.
-
Stereoselective syntheses of 3-dehydroxynaltrexamines and N-methyl-3-dehydroxynaltrexamines.Tetrahedron Lett. 2020 Sep 24;61(39):152379. doi: 10.1016/j.tetlet.2020.152379. Epub 2020 Aug 20. Tetrahedron Lett. 2020. PMID: 33100417 Free PMC article.
-
Verifying the role of 3-hydroxy of 17-cyclopropylmethyl-4,5α-epoxy-3,14β-dihydroxy-6β-[(4'-pyridyl) carboxamido]morphinan derivatives via their binding affinity and selectivity profiles on opioid receptors.Bioorg Chem. 2021 Apr;109:104702. doi: 10.1016/j.bioorg.2021.104702. Epub 2021 Feb 9. Bioorg Chem. 2021. PMID: 33631465 Free PMC article.
References
-
- Sixtieth Congress (1909) An Act to Prohibit the Importation and Use of Opium for Other than Medicinal Purposes; Congress: Washington, DC.
-
- Muhuri P, Gfroerer JC, and Davies CM (2013) Associations of Nonmedical Pain Reliever Use and Initiation of Heroin Use in the US SAMHSA: CBHSQ Data Review p 17, SAMHSA.
-
- Rudd RA, Seth P, David F, and Scholl L (2016) Increases in Drug and Opioid-Involved Overdose Deaths — United States, 2010–2015. MMWR. Morb. Mortal. Wkly. Rep. 65, 1445–1452. - PubMed
-
- Rudd RA, Aleshire N, Zibbell JE, and Gladden MR (2016) Increases in Drug and Opioid Overdose Deaths — United States, 2000–2014. Morb. Mortal. Wkly. Rep. 64, 1378–1382. - PubMed
-
- Hedegaard H, Warner M, and Minino AM (2017) Drug Overdose Deaths in the United States, 1999–2016. NCHS Data Brief, p 294, Centers for Disease Control and Prevention. - PubMed
Publication types
MeSH terms
Substances
Grants and funding
LinkOut - more resources
Full Text Sources
Medical
Research Materials
Miscellaneous
