

Differential effects of intrauterine growth restriction and a hypersinsulinemic-isoglycemic clamp on metabolic pathways and insulin action in the fetal liver
- PMID: 30758974
- PMCID: PMC6589601
- DOI: 10.1152/ajpregu.00359.2018
Differential effects of intrauterine growth restriction and a hypersinsulinemic-isoglycemic clamp on metabolic pathways and insulin action in the fetal liver
Abstract
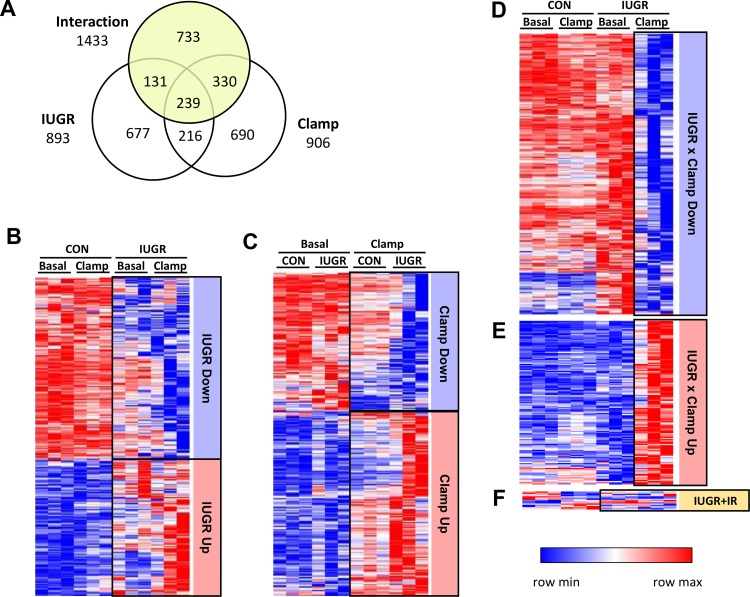
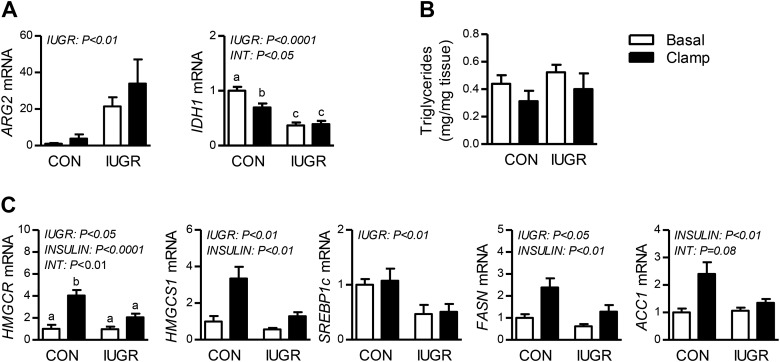
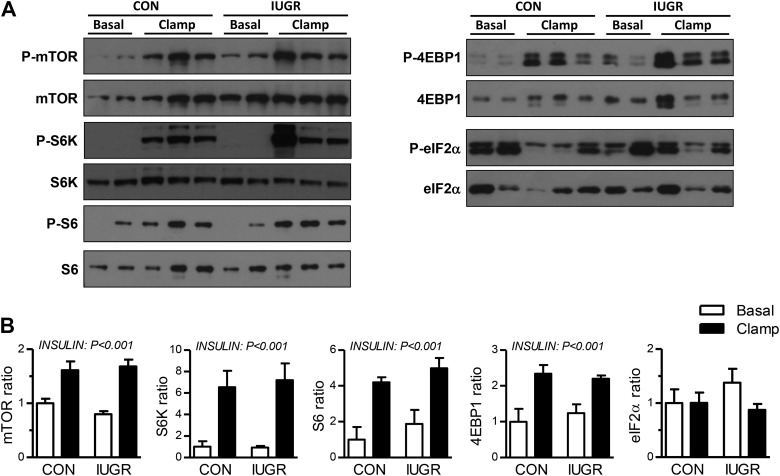
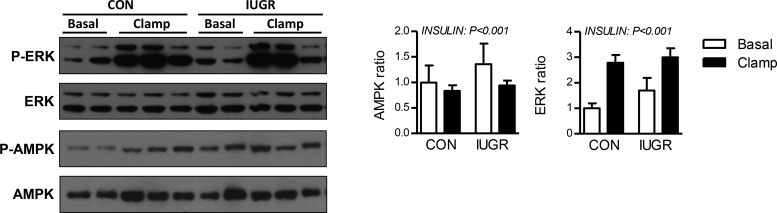
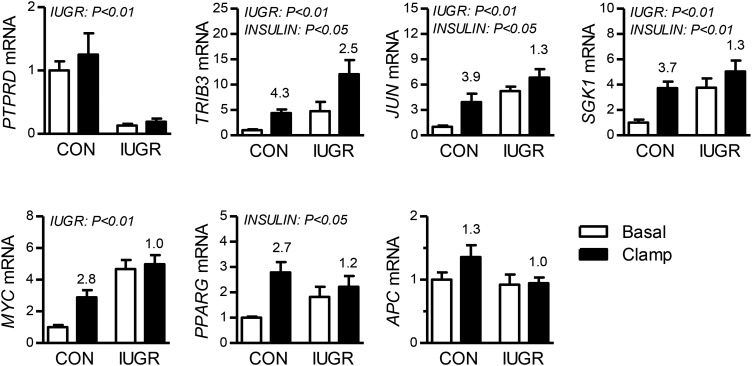
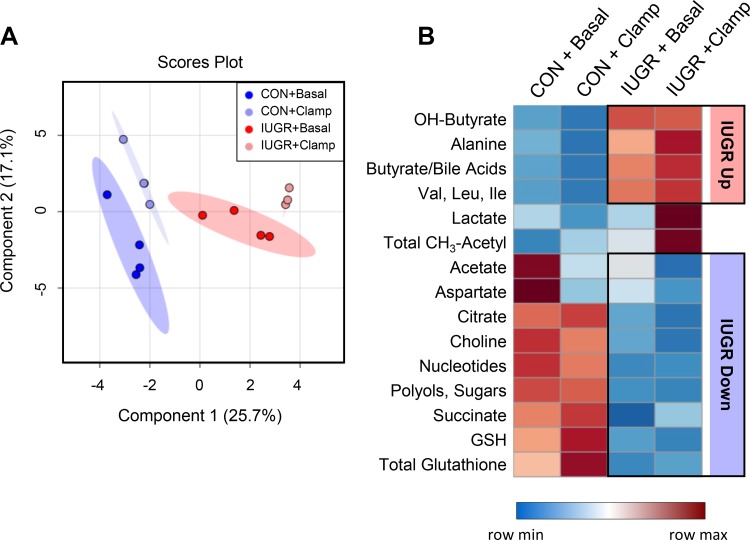
Intrauterine growth-restricted (IUGR) fetal sheep have increased hepatic glucose production (HGP) that is resistant to suppression during a hyperinsulinemic-isoglycemic clamp (insulin clamp). We hypothesized that the IUGR fetal liver would have activation of metabolic and signaling pathways that support HGP and inhibition of insulin-signaling pathways. To test this, we used transcriptomic profiling with liver samples from control (CON) and IUGR fetuses receiving saline or an insulin clamp. The IUGR liver had upregulation of genes associated with gluconeogenesis/glycolysis, transcription factor regulation, and cytokine responses and downregulation of genes associated with cholesterol synthesis, amino acid degradation, and detoxification pathways. During the insulin clamp, genes associated with cholesterol synthesis and innate immune response were upregulated in CON and IUGR. There were 20-fold more genes differentially expressed during the insulin clamp in IUGR versus CON. These genes were associated with proteasome activation and decreased amino acid and lipid catabolism. We found increased TRB3, JUN, MYC, and SGK1 expression and decreased PTPRD expression as molecular targets for increased HGP in IUGR. As candidate genes for resistance to insulin's suppression of HGP, expression of JUN, MYC, and SGK1 increased more during the insulin clamp in CON compared with IUGR. Metabolites were measured with 1H-nuclear magnetic resonance and support increased amino acid concentrations, decreased mitochondria activity and energy state, and increased cell stress in the IUGR liver. These results demonstrate a robust response, beyond suppression of HGP, during the insulin clamp and coordinate responses in glucose, amino acid, and lipid metabolism in the IUGR fetus.
Keywords: developmental programming; fetus; gluconeogenesis; insulin resistance; liver.
Figures
Similar articles
-
Limited capacity for glucose oxidation in fetal sheep with intrauterine growth restriction.Am J Physiol Regul Integr Comp Physiol. 2015 Oct 15;309(8):R920-8. doi: 10.1152/ajpregu.00197.2015. Epub 2015 Jul 29. Am J Physiol Regul Integr Comp Physiol. 2015. PMID: 26224688 Free PMC article.
-
Increased insulin sensitivity and maintenance of glucose utilization rates in fetal sheep with placental insufficiency and intrauterine growth restriction.Am J Physiol Endocrinol Metab. 2007 Dec;293(6):E1716-25. doi: 10.1152/ajpendo.00459.2007. Epub 2007 Sep 25. Am J Physiol Endocrinol Metab. 2007. PMID: 17895285
-
Neonatal exendin-4 treatment reduces oxidative stress and prevents hepatic insulin resistance in intrauterine growth-retarded rats.Am J Physiol Regul Integr Comp Physiol. 2009 Dec;297(6):R1785-94. doi: 10.1152/ajpregu.00519.2009. Epub 2009 Oct 21. Am J Physiol Regul Integr Comp Physiol. 2009. PMID: 19846744 Free PMC article.
-
Fetoplacental transport and utilization of amino acids in IUGR--a review.Placenta. 2005 Apr;26 Suppl A:S52-62. doi: 10.1016/j.placenta.2005.01.003. Placenta. 2005. PMID: 15837069 Review.
-
Dimming the Powerhouse: Mitochondrial Dysfunction in the Liver and Skeletal Muscle of Intrauterine Growth Restricted Fetuses.Front Endocrinol (Lausanne). 2021 May 17;12:612888. doi: 10.3389/fendo.2021.612888. eCollection 2021. Front Endocrinol (Lausanne). 2021. PMID: 34079518 Free PMC article. Review.
Cited by
-
Decoding Apelin: Its Role in Metabolic Programming, Fetal Growth, and Gestational Complications.Children (Basel). 2024 Oct 21;11(10):1270. doi: 10.3390/children11101270. Children (Basel). 2024. PMID: 39457235 Free PMC article. Review.
-
Skeletal muscle amino acid uptake is lower and alanine production is greater in late gestation intrauterine growth-restricted fetal sheep hindlimb.Am J Physiol Regul Integr Comp Physiol. 2019 Nov 1;317(5):R615-R629. doi: 10.1152/ajpregu.00115.2019. Epub 2019 Sep 4. Am J Physiol Regul Integr Comp Physiol. 2019. PMID: 31483682 Free PMC article.
-
Sustained maternal inflammation during the early third-trimester yields intrauterine growth restriction, impaired skeletal muscle glucose metabolism, and diminished β-cell function in fetal sheep1,2.J Anim Sci. 2019 Dec 17;97(12):4822-4833. doi: 10.1093/jas/skz321. J Anim Sci. 2019. PMID: 31616931 Free PMC article.
-
Dousing the flame: reviewing the mechanisms of inflammatory programming during stress-induced intrauterine growth restriction and the potential for ω-3 polyunsaturated fatty acid intervention.Front Physiol. 2023 Sep 1;14:1250134. doi: 10.3389/fphys.2023.1250134. eCollection 2023. Front Physiol. 2023. PMID: 37727657 Free PMC article. Review.
-
Long-Term Neurologic Consequences following Fetal Growth Restriction: The Impact on Brain Reserve.Dev Neurosci. 2025;47(2):139-146. doi: 10.1159/000539266. Epub 2024 May 14. Dev Neurosci. 2025. PMID: 38740013 Free PMC article. Review.
References
-
- Benjamini Y, Hochberg Y. Controlling the false discovery rate - a practical and powerful approach to multiple testing. J R Stat Soc Series B Stat Methodol 57: 289–300, 1995. doi:10.1111/j.2517-6161.1995.tb02031.x. - DOI
Publication types
MeSH terms
Substances
Grants and funding
LinkOut - more resources
Full Text Sources
Medical
Research Materials
Miscellaneous