

doi: 10.1371/journal.pgen.1007929.
eCollection 2019 Feb.
A systematic genetic screen identifies essential factors involved in nuclear size control
Affiliations
- PMID: 30759079
- PMCID: PMC6391033
- DOI: 10.1371/journal.pgen.1007929
Item in Clipboard
A systematic genetic screen identifies essential factors involved in nuclear size control
PLoS Genet.
.
Abstract
Nuclear size correlates with cell size, but the mechanism by which this scaling is achieved is not known. Here we screen fission yeast gene deletion mutants to identify essential factors involved in this process. Our screen has identified 25 essential factors that alter nuclear size, and our analysis has implicated RNA processing and LINC complexes in nuclear size control. This study has revealed lower and more extreme higher nuclear size phenotypes and has identified global cellular processes and specific structural nuclear components important for nuclear size control.
Conflict of interest statement
The authors have declared that no competing interests exist.
Figures
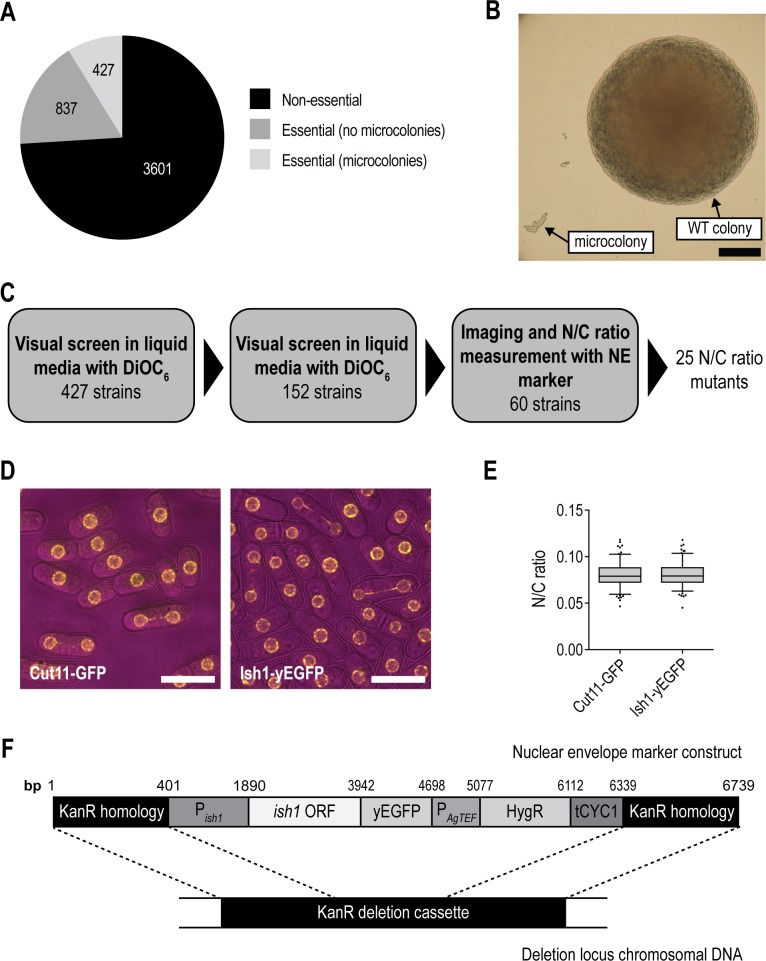
(A) Pie chart illustrating stratification of S. pombe gene deletion collection into non-essential and essential gene deletion mutants. Essential gene deletion mutants are then categorised by ability to form microcolonies [18, 19]. (B) Representative image of wild type (WT) colony and microcolony grown on solid YE4S agar from spores from sporulated heterozygous deletion mutant diploid (40 h, 32°C). Scale bar: 100 μm. (C) Schematic of the three stage screen. Two visual screens in liquid media using the lipophilic dye DiOC6 identified 60 potential N/C ratio mutant candidates. Imaging and measurement of N/C ratio of strains containing nuclear envelope (NE) marker Ish1-yEGFP led to the identification of 25 N/C ratio mutant candidates. (D) Wild type haploid cells with nuclear envelopes marked with Cut11-GFP or Ish1-yEGFP as indicated. Brightfield (magenta), GFP (yellow). Scale bar: 10 μm. (E) N/C ratio of cell populations described in (D). n = 150 cells per condition. Box delimited by 25th percentile, median and 75th percentile. Whiskers represent 10th and 90th percentiles. Data points outside this range marked as dots. Unpaired student’s t-test carried out (p = 0.6871). (F) Schematic of nuclear envelope marker construct. Kanamycin resistance marker (KanR) homologous sequence flanks the ish1 open reading frame (ish1 ORF) and upstream sequence (Pish1), yEGFP coding sequence (yEGFP) and hygromycin resistance marker (HygR) regulated by the AgTEF promoter (PAgTEF) and CYC1 terminator (tCYC1).
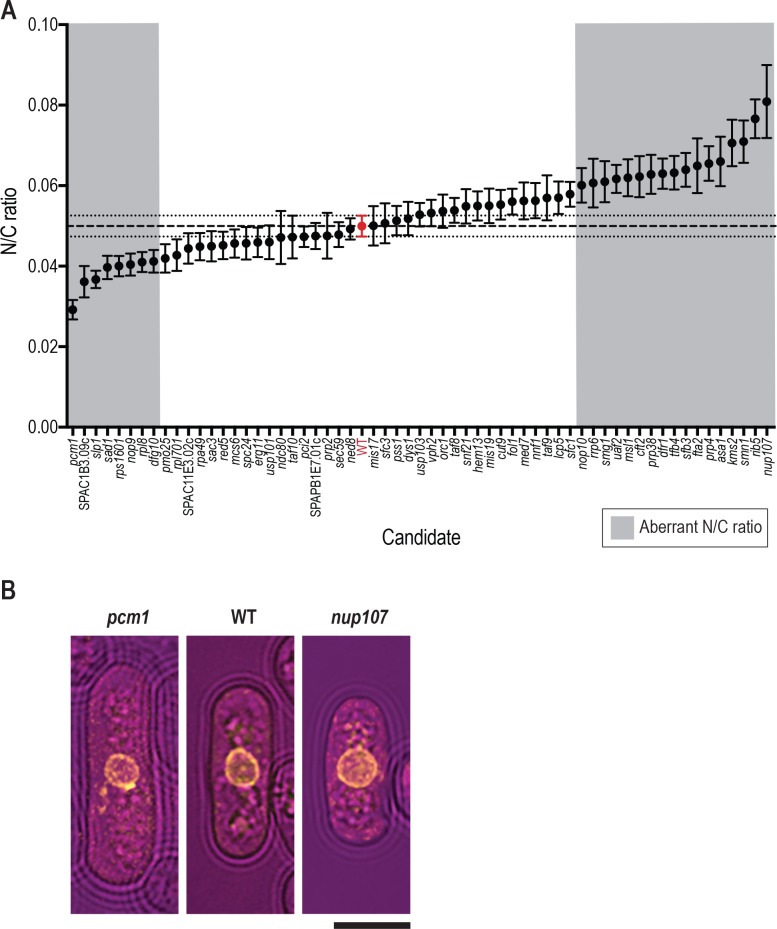
(A) N/C ratio of wild type cells (red) and 60 gene deletion mutants in the third screen with nuclear envelope marker Ish1-yEGFP integrated in the deletion cassette. Mean plotted for each strain (n = 50 cells per strain). Error bars represent 95% confidence intervals. Dashed line represents wild type cell population mean. Dotted lines represent wild type 95% confidence intervals. Wild type strain used is the haploid derived from 5300 control strain (red). Aberrant N/C ratio candidates (grey background) were identified as described in Materials and Methods. (B) Images of an example cell for wild type (WT) and strains carrying deletions in pcm1 and nup107. Brightfield (magenta), Ish1-yEGFP (yellow). Scale bar: 5 μm.
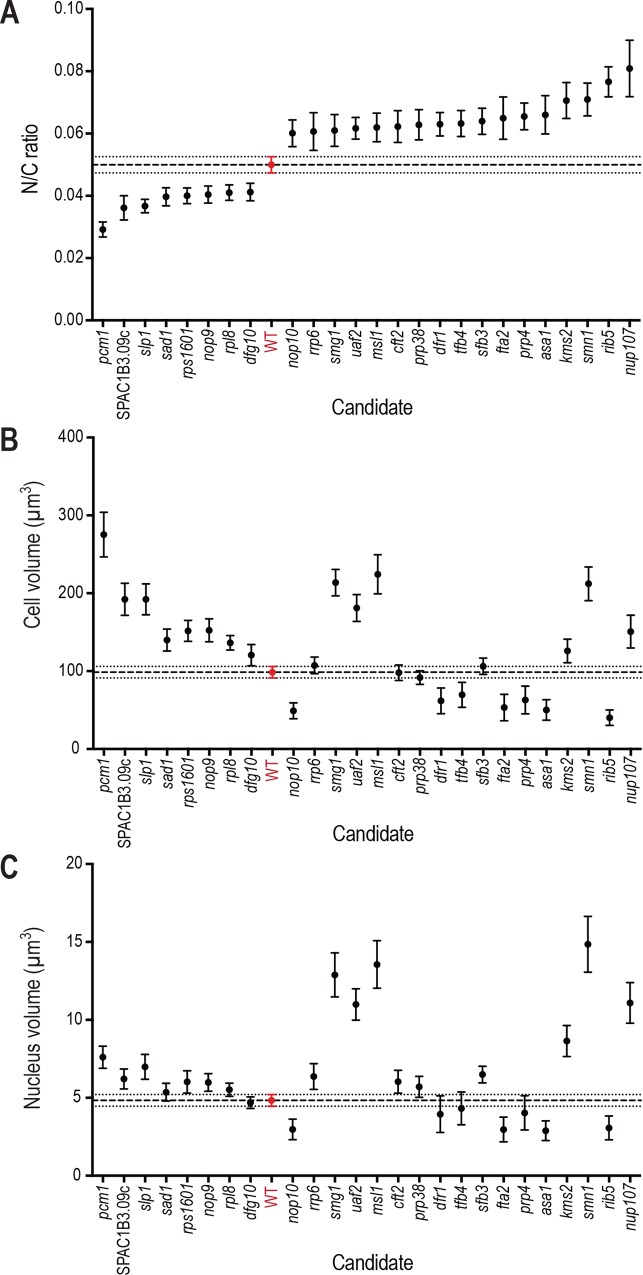
(A-C) N/C ratio (A), Cell volume (B) and Nucleus volume (C) of wild type cells (red) and 25 gene deletion mutants in the third screen with nuclear envelope marker Ish1-yEGFP integrated in the deletion cassette. Mean plotted for each strain (n = 50 cells per strain). Error bars represent 95% confidence intervals. Dashed line represents wild type cell population mean. Dotted lines represent wild type 95% confidence intervals. Wild type strain used is the haploid derived from 5300 control strain (red).
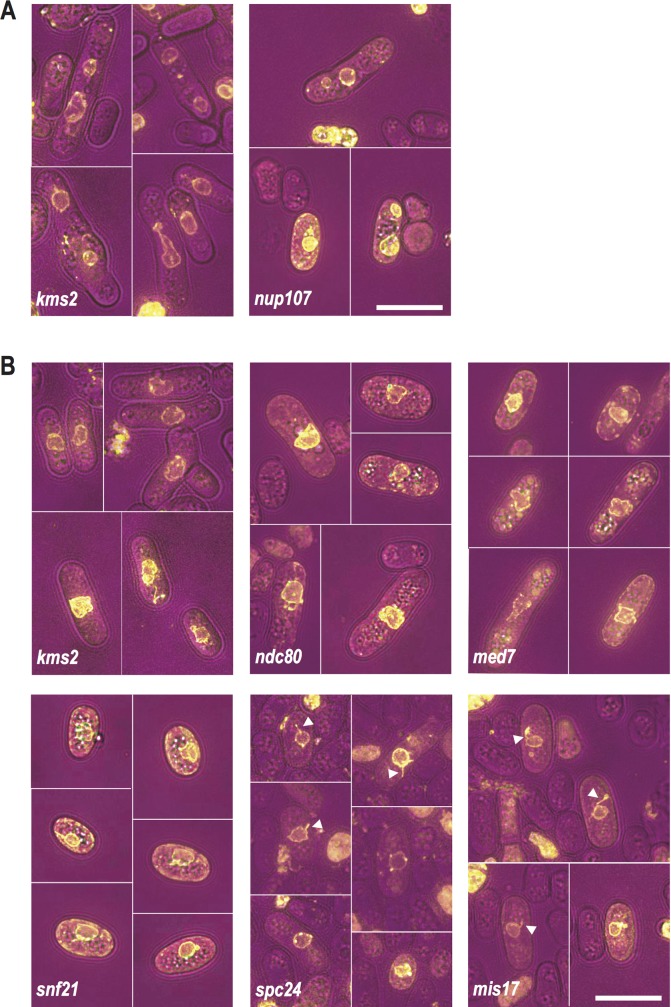
(A) Images of asymmetric nuclear division in strains with genes indicated deleted. Brightfield (magenta), Ish1-yEGFP (yellow). Scale bar: 10 μm. (B) Representative images of strains carrying deletions in the genes indicated identified as having nuclear shape defects during screen. Nuclear tethers indicative of defective microtubule-spindle pole body attachment [22] were observed in spc24Δ and mis17Δ cells and are labelled by white triangles. Brightfield (magenta), Ish1-yEGFP (yellow). Scale bar: 10 μm.
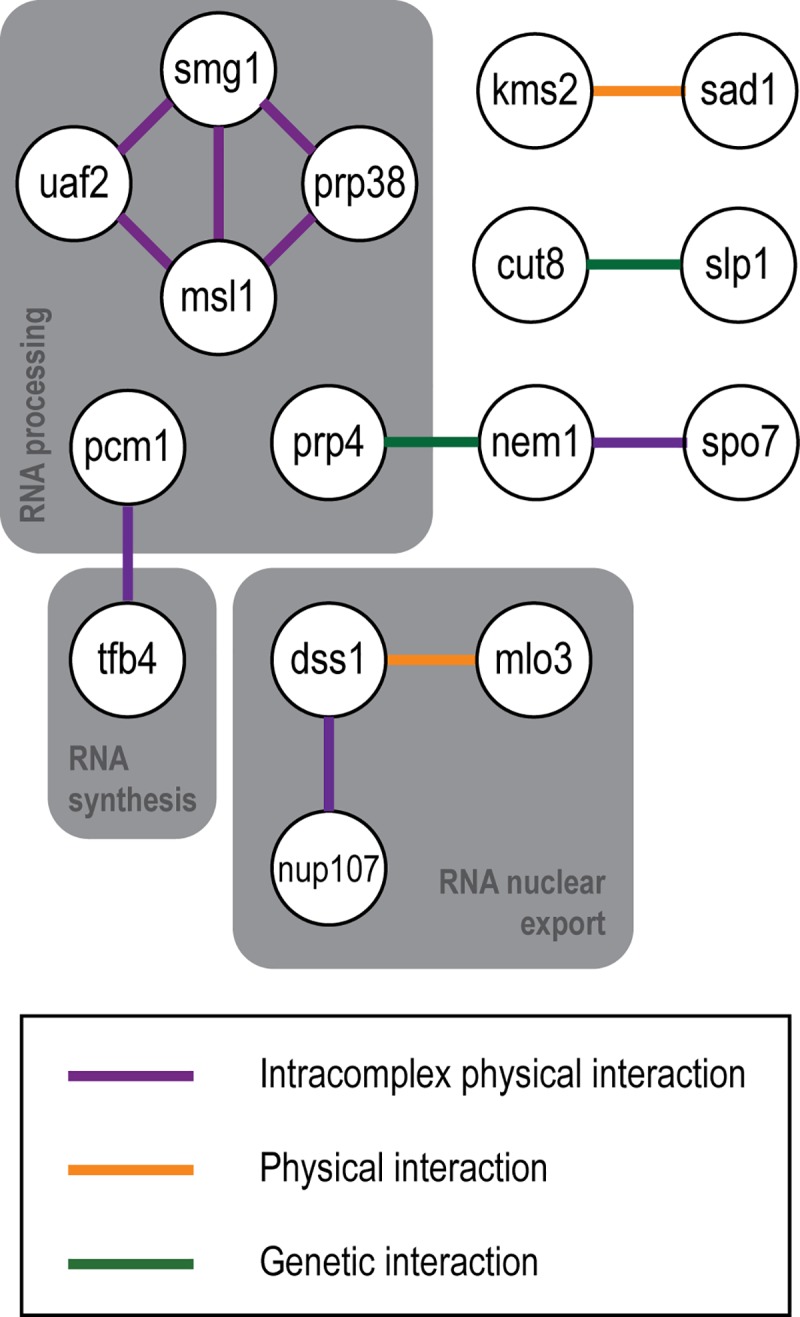
Network analysis carried out using esyN software [25] with PomBase [24] and BioGRID [36] curated interactions. Interacting candidate factors with roles in RNA processing, synthesis and nuclear export indicated.
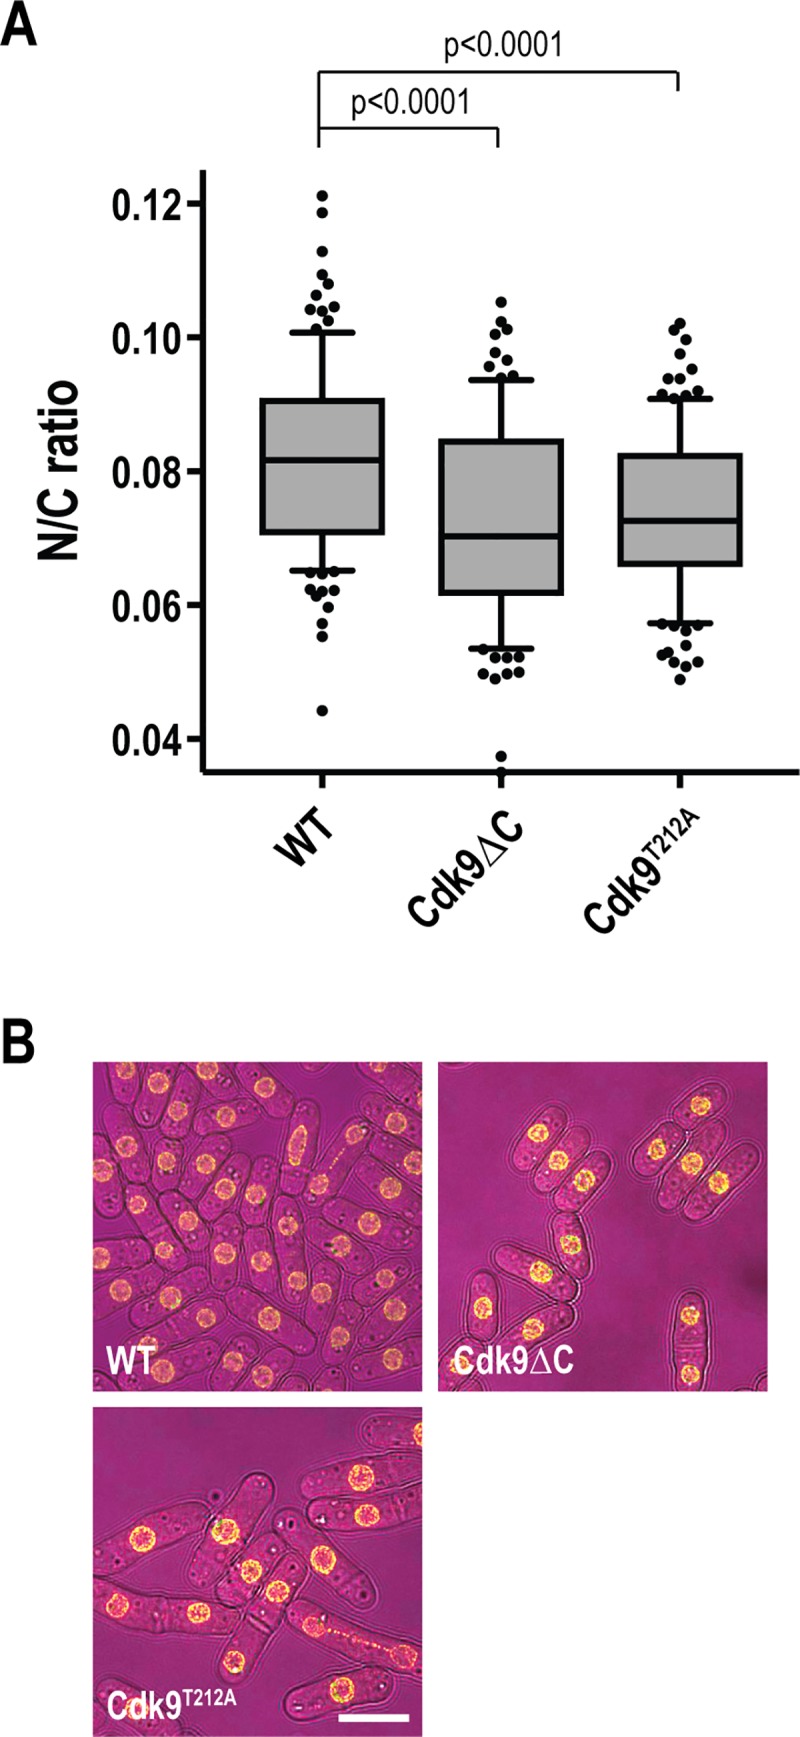
(A) N/C ratio of wild type (WT) and Cdk9 C-terminal truncation (Cdk9ΔC) and T-loop (Cdk9T212A) mutant cells grown at 25°C. n ≥ 100 cells per condition. Box delimited by 25th percentile, median and 75th percentile. Whiskers represent 10th and 90th percentiles. Data points outside this range marked as dots. Unpaired student’s t-tests with Welch’s correction carried out to determine significance. Cdk9ΔC retains kinase activity but loses the ability to bind to Pcm1, reducing recruitment of both Cdk9 and Pcm1 to chromatin [28]. In cdk9T212A cells Cdk9 activation by CDK-activating kinase is perturbed [28]. (B) Representative images of wild type (WT) and Cdk9 C-terminal truncation (Cdk9ΔC) and T-loop (Cdk9T212A) mutants cells grown at 25°C. Brightfield (magenta), Cut11-GFP (yellow). Scale bar: 10 μm.
References
-
- Hertwig R. Ueber die Korrelation von Zell-und Kerngrösse und ihre Bedeutung für die Geschlechtliche Differenzierung und die Teilung der Zelle. Biologisches Centralblatt. 1903(23):4–62.
-
- Boveri T. Zellenstudien V. Über die Abhängigkeit der Kerngrösse und Zellenzahl bei Seeigellarven von der Chromosomenzahl der Ausganszellen. Jenaische Zeitschrift für Naturwissenschaft. 1905;39:445–524.
-
- Wilson EB. The Cell in Development and Heredity. 3 ed. New York: Macmillan; 1925.
-
- Gregory T. Genome size evolution in animals In: Gregory T, editor. The Evolution of the Genome. London: Elsevier Academic Press; 2005. p. 4–87.
-
- Conklin EG. Cell size and nuclear size. Journal of Experimental Zoology. 1912;12(1):1–98.
Publication types
MeSH terms
Grants and funding
LinkOut - more resources
Full Text Sources
Other Literature Sources
Molecular Biology Databases
