. 2019 Feb 13;15(2):e1007784.
doi: 10.1371/journal.pgen.1007784. eCollection 2019 Feb.

Maternal and zygotic gene regulatory effects of endogenous RNAi pathways

Affiliations

Maternal and zygotic gene regulatory effects of endogenous RNAi pathways

Miguel Vasconcelos Almeida et al. PLoS Genet. .

Abstract

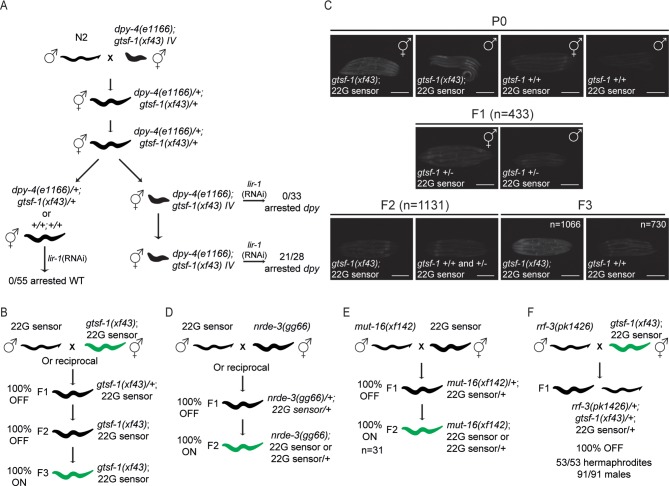
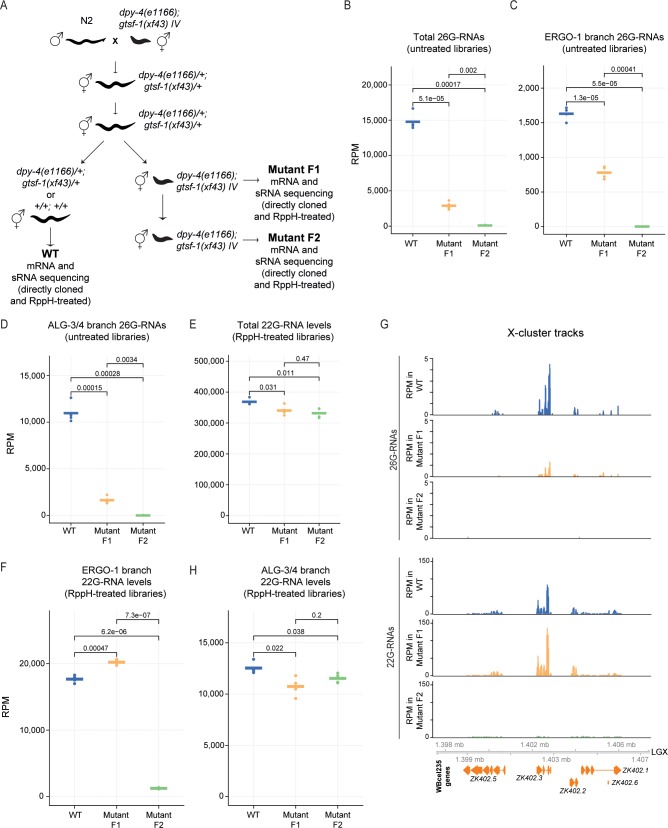
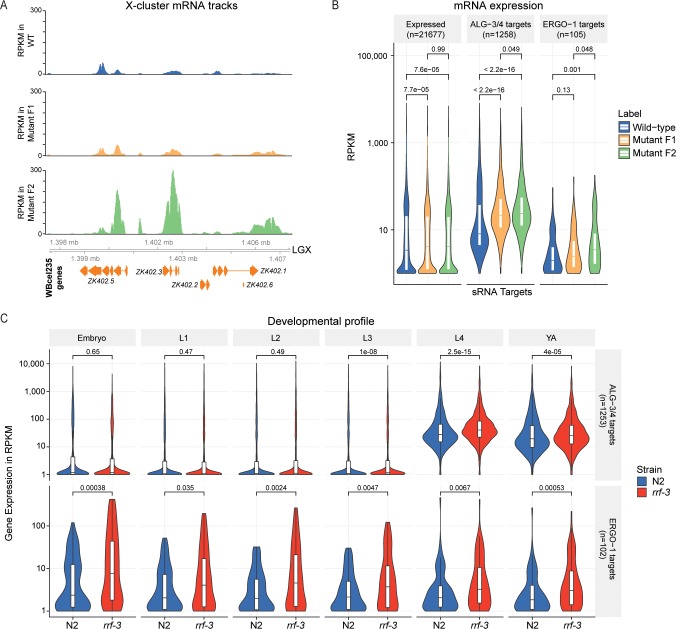
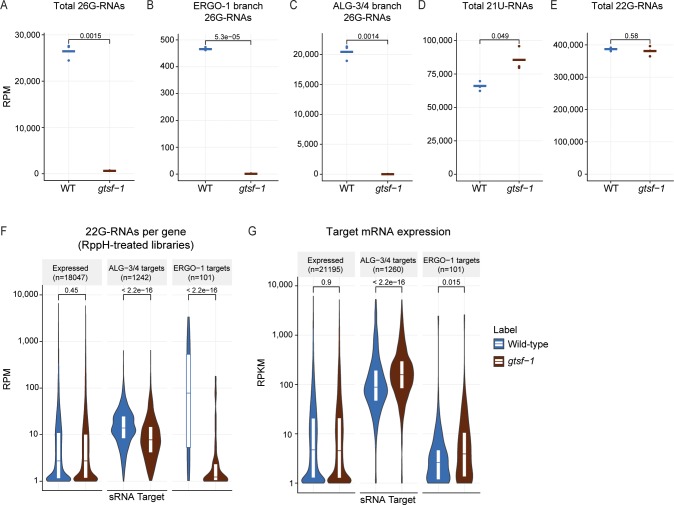
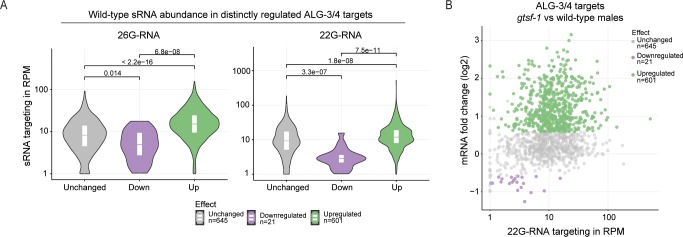
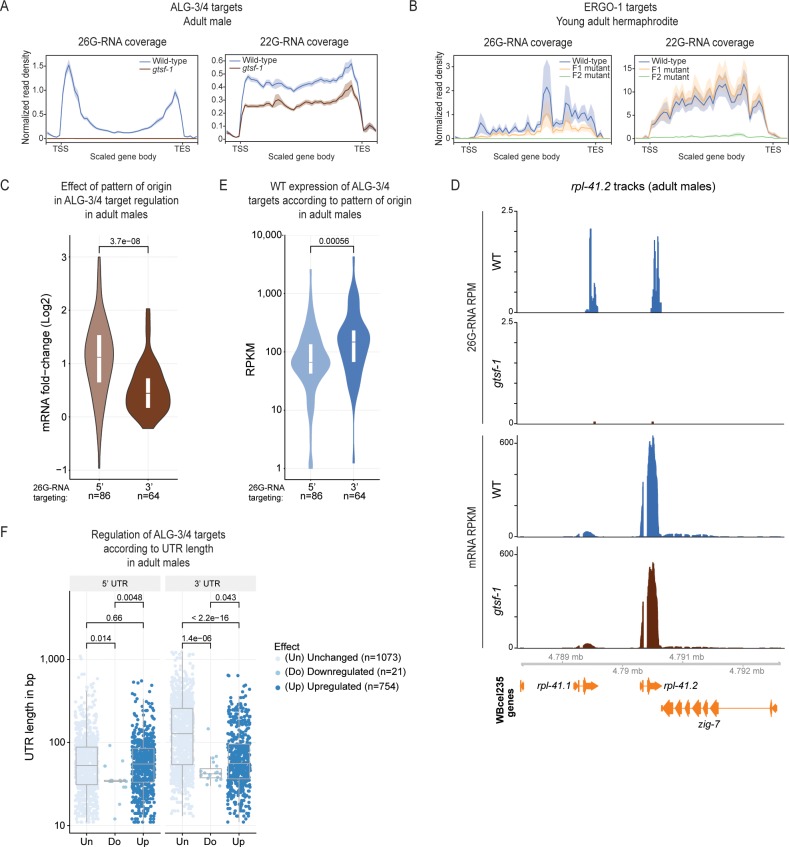
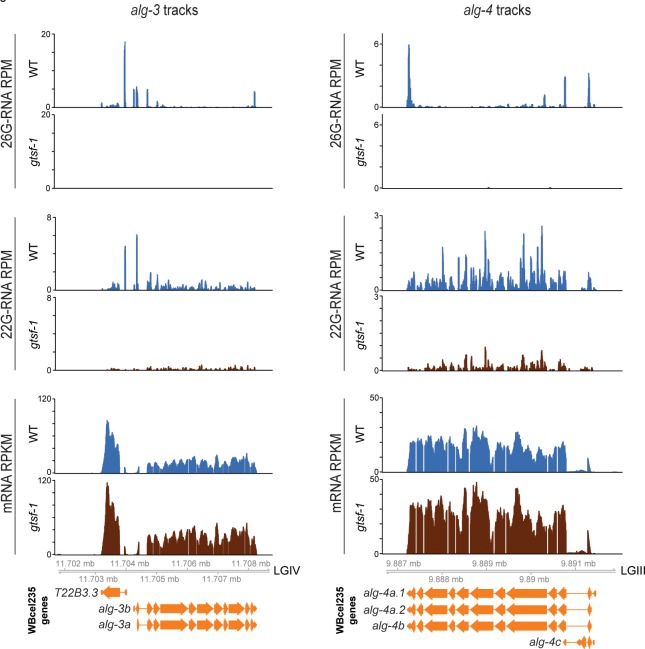
Endogenous small RNAs (sRNAs) and Argonaute proteins are ubiquitous regulators of gene expression in germline and somatic tissues. sRNA-Argonaute complexes are often expressed in gametes and are consequently inherited by the next generation upon fertilization. In Caenorhabditis elegans, 26G-RNAs are primary endogenous sRNAs that trigger the expression of downstream secondary sRNAs. Two subpopulations of 26G-RNAs exist, each of which displaying strongly compartmentalized expression: one is expressed in the spermatogenic gonad and associates with the Argonautes ALG-3/4; plus another expressed in oocytes and in embryos, which associates with the Argonaute ERGO-1. The determinants and dynamics of gene silencing elicited by 26G-RNAs are largely unknown. Here, we provide diverse new insights into these endogenous sRNA pathways of C. elegans. Using genetics and deep sequencing, we dissect a maternal effect of the ERGO-1 branch of the 26G-RNA pathway. We find that maternal primary sRNAs can trigger the production of zygotic secondary sRNAs that are able to silence targets, even in the absence of zygotic primary triggers. Thus, the interaction of maternal and zygotic sRNA populations, assures target gene silencing throughout animal development. Furthermore, we explore other facets of 26G-RNA biology related to the ALG-3/4 branch. We find that sRNA abundance, sRNA pattern of origin and the 3' UTR length of target transcripts are predictors of the regulatory outcome by the Argonautes ALG-3/4. Lastly, we provide evidence suggesting that ALG-3 and ALG-4 regulate their own mRNAs in a negative feedback loop. Altogether, we provide several new regulatory insights on the dynamics, target regulation and self-regulation of the endogenous RNAi pathways of C. elegans.


Conflict of interest statement

The authors have declared that no competing interests exist.

Figures

Fig 1
Fig 1. Maternal and zygotic sRNAs drive RNAi in the soma.
(A) Experimental setup to address maternal transmission of the Eri phenotype in gtsf-1 mutants. Eri phenotype was assessed by transferring worms to plates containing lir-1 RNAi food and scoring for larval arrest. dpy-4(e1166) is weakly semi-dominant. Since the phenotype is mild, for simplicity, we will refer to dpy-4(e1166) heterozygotes as “wild-type”. (B, D-F) Schematics of genetic crosses using the 22G sensor background. Green worms illustrate ubiquitous derepression of the 22G sensor. Conversely, black worms illustrate repression of the 22G sensor. Unless otherwise noted, for all crosses the number of scored F1s, F2s and F3s was each >50. (C) Related to the cross shown in (B). Wide-field fluorescence microscopy images showing 22G sensor GFP signal. Five representative gravid adult hermaphrodites or adult males from each generation are shown. Of note, some autofluorescence of the gut is observed in gravid adult animals and is especially noticeable in worms with the sensor off. Scale bars represent 0,25 mm.
Fig 2
Fig 2. sRNA dynamics in Eri maternal inheritance.
(A) Schematics of the cross setup used to isolate worms of different generations and gtsf-1 genotypes. gtsf-1;dpy-4 mutants were outcrossed with N2 males, allowed to self for two generations and then WT, Dpy mutant F1 and Dpy mutant F2 young adult animals were isolated, RNA was extracted, sRNAs and mRNAs were cloned and sequenced. sRNA libraries were either prepared directly or after treatment with RppH. WT, wild-type. (B-F, H) Normalized levels of sRNAs, in RPM (Reads Per Million), per generation/phenotype. Four biological replicates are shown. P-values were calculated with a two-sided unpaired t-test. (B) Total levels of 26G-RNAs in the untreated libraries. (C) Total levels of 26G-RNAs mapping to ERGO-1 targets in the untreated libraries. (D) Total levels of 26G-RNAs mapping to ALG-3/4 targets in the untreated libraries. (E) Total levels of 22G-RNAs in the RppH-treated libraries. (F) Total levels of 22G-RNAs mapping to ERGO-1 targets in the RppH-treated libraries. (G) Genome browser tracks of the X-cluster, a known set of ERGO-1 targets, showing mapped 26G- and 22G-RNAs. 26G- and 22G-RNA tracks were obtained from untreated and RppH-treated libraries, respectively. (H) Total levels of 22G-RNAs mapping to ALG-3/4 targets in RppH-treated libraries.
Fig 3
Fig 3. mRNA dynamics in Eri maternal inheritance.
(A) Genome browser tracks showing mRNA, in RPKM (Reads Per Kilobase Million), of X-cluster genes. (B) Distribution of normalized mRNA expression, in RPKM, of all expressed genes, ALG-3/4 targets and ERGO-1 targets in different generations/phenotype. (C) Distribution of normalized mRNA expression, in RPKM, ALG-3/4 targets (upper panel) and ERGO-1 targets (lower panel) throughout development. Expression is shown for wild-type N2 (in blue) and rrf-3(pk1426) (in red) animals. YA, young adult. L1-L4, first to fourth larval stages of C. elegans development. Violin plots in (B-C) show the distribution density of the underlying data. The top and bottom of the embedded box represent the 75th and the 25th percentile of the distribution, respectively. The line in the box represents the median. P-values were calculated with a two-sided unpaired Mann-Whitney/Wilcoxon rank-sum test.
Fig 4
Fig 4. GTSF-1 is required for sRNA biogenesis and target silencing in adult males.
(A-E) Normalized levels of sRNAs in RppH treated libraries, in RPM. Three biological replicates are shown. WT, wild-type. (A) Total levels of 26G-RNAs. (B) 26G-RNAs mapping to ERGO-1 targets. (C) 26G-RNAs mapping to ALG-3/4 targets. (D) total levels of 21U-RNAs. (E) total levels of 22G-RNAs. (F) RPM Levels of sRNAs mapping, per gene, to known targets of ALG-3/4 and ERGO-1. (G) Normalized mRNA expression of ALG-3/4 and ERGO-1 targets, in RPKM. Violin plots in (F-G) show the distribution density of the underlying data. The top and bottom of the embedded box represent the 75th and the 25th percentile of the distribution, respectively. The line in the box represents the median. P-values were calculated either with a two-sided unpaired t-test (A-E), or with a two-sided Mann-Whitney/Wilcoxon rank-sum test (F-G).
Fig 5
Fig 5. In adult males, sRNA abundance is a predictor of regulatory outcome by ALG-3/4.
(A) Distribution of sRNA levels (26G-RNA on the left panel, 22G-RNA on the right panel) mapping to ALG-3/4 targets that are unchanged, down- or upregulated upon gtsf-1 mutation. n is indicated below. (B) MA-plot displaying the 22G-RNA levels in respect to regulatory outcome. (B) is another representation of the data shown in the right panel of (A). Violin plots in (A) show the distribution density of the underlying data. The top and bottom of the embedded box represent the 75th and the 25th percentile of the distribution, respectively. The line in the box represents the median. P-values were calculated with a two-sided unpaired Mann-Whitney/Wilcoxon rank-sum test.
Fig 6
Fig 6. Predictors of regulatory outcome by ALG-3/4 in males and ERGO-1 branch sRNA metagene analysis.
(A-B) Metagene analysis of 26G- (left panel) and 22G-RNAs (right panel) mapping to ALG-3/4 targets (n = 1258) in male datasets (A), and to ERGO-1 targets (n = 104) in young adult datasets (B), from our maternal effect setup (as in Fig 2A). Target gene body length was scaled between transcription start site (TSS) and transcription end site (TES). Moreover, the regions comprising 250 nucleotides immediately upstream of the TSS and downstream of the TES are also included. (C) Regulation of ALG-3/4 target genes predominantly targeted at the 5’ or at the 3’ by 26G-RNAs. (D) Genome browser tracks displaying the RPM levels of 26G-RNAs (upper panels) and RPKM mRNA levels (lower panels) mapping to rpl-41.2, a gene predominantly targeted by 26G-RNAs at the 3’ region, in adult males. WT, wild-type. (E) Wild-type (WT) expression levels, in RPKM, of ALG-3/4 target genes predominantly targeted at the 5’ or on the 3’ by 26G-RNAs. (F) 5’ UTR (left panel) and 3’ UTR (right panel) lengths of all the transcript isoforms annotated for ALG-3/4 target genes, according to effect on gene expression. For (C-F) we used male sequencing datasets. Violin plots in (C-D) and the boxplot in (E) show the distribution of the data. The top and bottom of the embedded boxes represent the 75th and the 25th percentile of the distribution, respectively. The line in the box represents the median. P-values were calculated with a two-sided unpaired Mann-Whitney/Wilcoxon rank-sum test.
Fig 7
Fig 7. ALG-3 and ALG-4 are engaged in a negative feedback loop in males.
Genome browser tracks showing 26G-RNAs (upper panels) and 22G-RNAs (middle panels) mapping to alg-3 (left panels) and alg-4 (right panels), in RPM. Lower panels show the RPKM mRNA levels of alg-3 (on the left) and alg-4 (on the right). Sequencing datasets of adult males were used. WT, wild-type.

References

    1. Ha M, Kim VN. Regulation of microRNA biogenesis. Nat Rev Mol Cell Biol. 2014;15: 509–524. 10.1038/nrm3838 - DOI - PubMed
    1. Ernst C, Odom DT, Kutter C. The emergence of piRNAs against transposon invasion to preserve mammalian genome integrity. Nat Commun. 2017;8: 1411 10.1038/s41467-017-01049-7 - DOI - PMC - PubMed
    1. Huang X, Fejes Tóth K, Aravin AA. piRNA Biogenesis in Drosophila melanogaster. Trends Genet. 2017;33: 882–894. 10.1016/j.tig.2017.09.002 - DOI - PMC - PubMed
    1. Luteijn MJ, Ketting RF. PIWI-interacting RNAs: from generation to transgenerational epigenetics. Nat Rev Genet. 2013;14: 523–534. 10.1038/nrg3495 - DOI - PubMed
    1. Rojas-Ríos P, Simonelig M. piRNAs and PIWI proteins: regulators of gene expression in development and stem cells. Development. 2018;145: dev161786. 10.1242/dev.161786 - DOI - PubMed

Publication types

MeSH terms