. 2019 Feb 13;14(2):e0209639.
doi: 10.1371/journal.pone.0209639. eCollection 2019.

Facial cues to age perception using three-dimensional analysis

Affiliations

Facial cues to age perception using three-dimensional analysis

Takeo Imai et al. PLoS One. .

Abstract

To clarify cues for age perception, the three-dimensional head and face forms of Japanese women were analyzed. It is known that age-related transformations are mainly caused by changes in soft tissue during adulthood. A homologous polygon model was created by fitting template meshes to each study participant to obtain three-dimensional data for analyzing whole head and face forms. Using principal component analysis of the vertices coordinates of these models, 26 principal components were extracted (contribution ratios >0.5%), which accounted for more than 90% of the total variance. Among the principal components, five had a significant correlation with the perceived ages of the participants (p < 0.05). Transformations with these principal components in the age-related direction produced aged faces. Moreover, the older the perceived age, the larger the ratio of age-manifesting participants, namely participants who had one or more age-related principal component score greater than +1.0 σ in the age-related direction. Therefore, these five principal components were regarded as aging factors. A cluster analysis of the five aging factors revealed that all of the participants fell into one of four groups, meaning that specific combinations of factors could be used as cues for age perception in each group. These results suggest that Japanese women can be classified into four groups according to age-related transformations of soft tissue in the face.


Conflict of interest statement

This study was fully funded by Kao Corporation (http://www.kao.com/) and all authors were permanent employees of Kao Corporation. The methodology was invented and has been patented by Kao Corporation [Face Impression Analyzing Method, Aesthetic Counseling Method, and Face Image Generating Method.] (JPB-5231685, PCT/JP2012/004404). There are no further patents, products in development or marketed products to declare. This does not alter our adherence to all the PLOS ONE policies on sharing data and materials.

Figures

Fig 1
Fig 1. Landmarks for polygon modelinga.
a Identical frontal and rotated [30°, left side] views of polygon models (averaged form) used in the present study. The abbreviations for the right and medial landmarks were indicated in the frontal view, and those for the left and the medial landmarks were indicated in the rotated view of the polygon models. The red dotted line represents a contour line in the z-axis that passes along both ectocanthions (lateral corners of the eyes, see Supporting Information 1–2) to describe the locations of the landmarks a4R and a4L. This line was not used in the analysis. b These landmarks were not used to create the homologous polygon models.
Fig 2
Fig 2. Schematic illustration of the three-dimensional (3D) measurements and homologous polygon modeling.
a Images of averaged faces were used instead of actual participant images in this schematic illustration. b Measured data were obtained from a mannequin head instead of actual participants. c The average form of all participants was used instead of homologous polygon models of actual participants. d The Dhaiba Model was used for the template meshes.
Fig 3
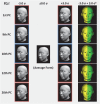
Fig 3. Simulated forms that reflected age-related principal components (PCs).
a Each normalized PC score varied from −3.0 σ to +3.0 σ. The 1st, 12th, and 20th PCs were in direct proportion to perceived age (red borders), and the 9th and 10th PCs were in inverse proportion to perceived age (blue borders). b Frontal view image of simulated form (−1.0 σ and +1.0 σ for the 1st PC, −3.0 σ and +3.0 σ for the 9th, 10th, and 12th PCs).
Fig 4
Fig 4. Relationship between the perceived ages of the simulated modelsa and the age-related principal component (PC) scoresb.
a Bars represent standard errors. b Each normalized PC score varied from –3.0 σ to +3.0 σ.
Fig 5
Fig 5. Ratio of age-manifesting participantsa in each age cohort and number of age-manifesting principal components (PCs)b.
a Participants who had one or more age-related PC score greater than +1.0 σ in the age-related direction. b Age-related PCs scores greater than +1.0 σ in the age-related direction (bars represent standard errors).
Fig 6
Fig 6. Differences in facial forms between younger and oldera participants in each group.
a Participants under and over the mean age of each group.

References

    1. Gaceviciene R, Liakou AI, Theodoridis A, Makrantonaki E and Zouboulis CC. Skin anti-aging strategies. Dermatoendocrinol. 2012; 4(3): 308–319. 10.4161/derm.22804 - DOI - PMC - PubMed
    1. Ramos-e-Silva M, Celem LR, Ramos-e-Silva S and Fucci-da-Costa AP. Anti-aging cosmetics: facts and controversies. Clin Dermatol. 2013; 31(6):750–8. 10.1016/j.clindermatol.2013.05.013 - DOI - PubMed
    1. Alley T. Social and applied aspects of perceiving faces. New Jersey: Lawrence Erlbaum Associates Ltd; 1988.
    1. Zebrowitz L. Reading Faces. Colorado, Westview Press; 1997. pp. 14–39.
    1. Todd JT, Mark LS, Shaw RE, Pittenger JB. The perception of human growth. Sci Am. 1980; 242(2): 132–144. - PubMed

Publication types