

Cardiopulmonary responses to maximal aerobic exercise in patients with cystic fibrosis
- PMID: 30759119
- PMCID: PMC6373911
- DOI: 10.1371/journal.pone.0211219
Cardiopulmonary responses to maximal aerobic exercise in patients with cystic fibrosis
Abstract
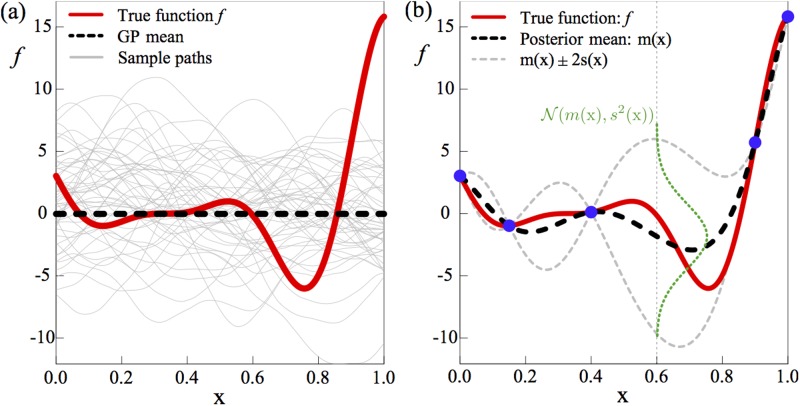
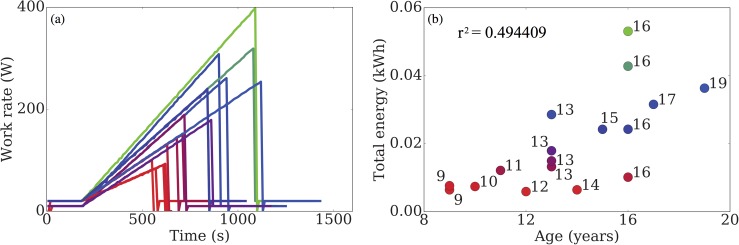
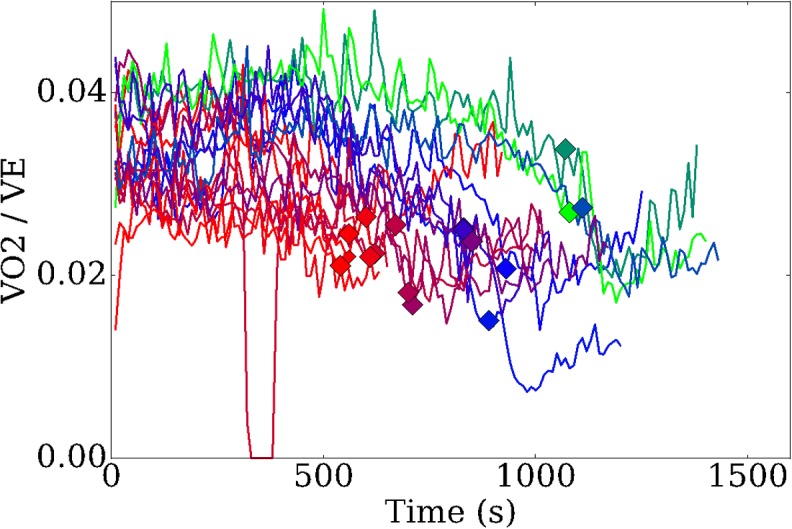
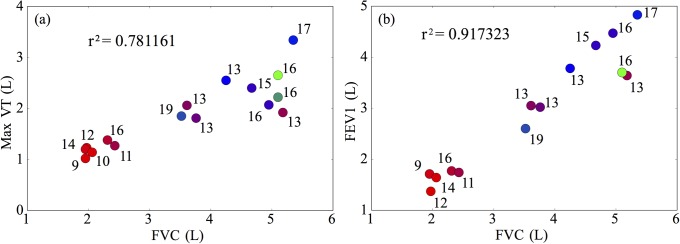
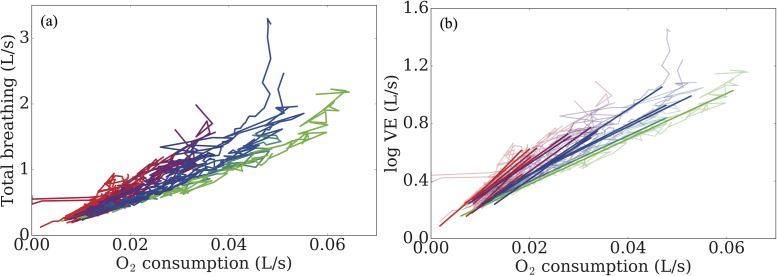
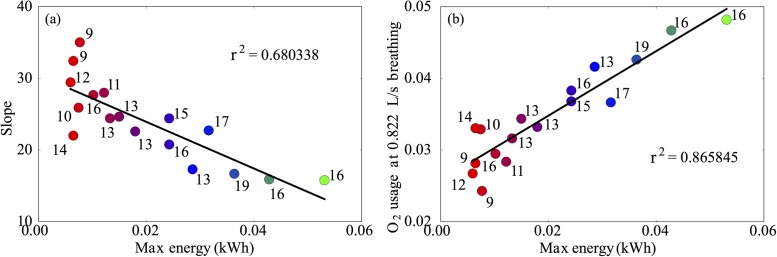
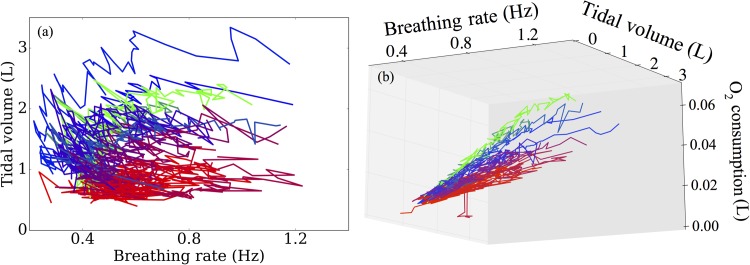
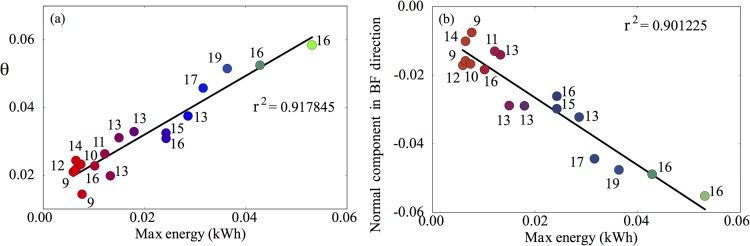
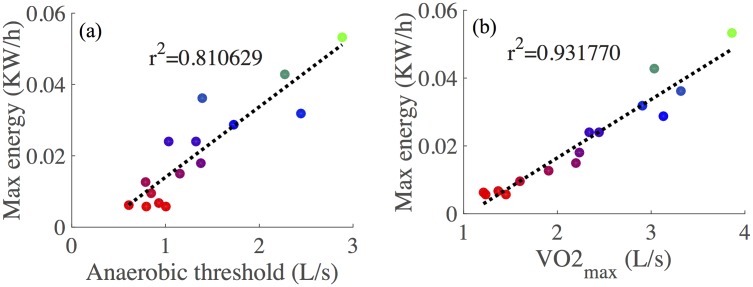
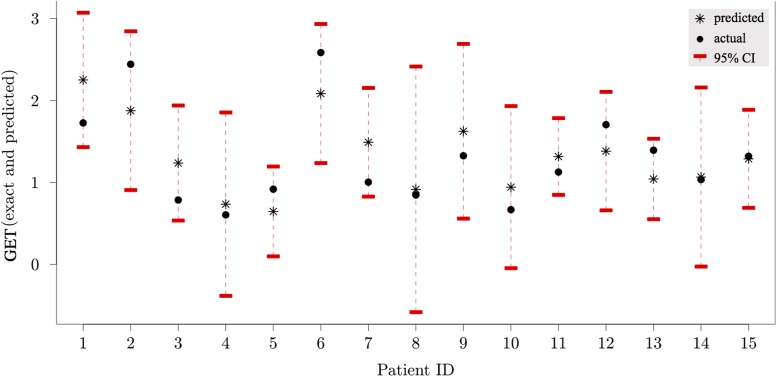
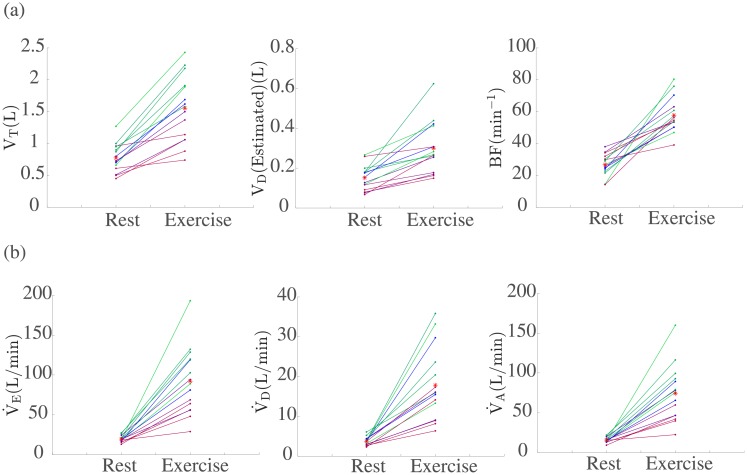
Cystic fibrosis (CF) is a debilitating chronic condition, which requires complex and expensive disease management. Exercise has now been recognised as a critical factor in improving health and quality of life in patients with CF. Hence, cardiopulmonary exercise testing (CPET) is used to determine aerobic fitness of young patients as part of the clinical management of CF. However, at present there is a lack of conclusive evidence for one limiting system of aerobic fitness for CF patients at individual patient level. Here, we perform detailed data analysis that allows us to identify important systems-level factors that affect aerobic fitness. We use patients' data and principal component analysis to confirm the dependence of CPET performance on variables associated with ventilation and metabolic rates of oxygen consumption. We find that the time at which participants cross the gas exchange threshold (GET) is well correlated with their overall performance. Furthermore, we propose a predictive modelling framework that captures the relationship between ventilatory dynamics, lung capacity and function and performance in CPET within a group of children and adolescents with CF. Specifically, we show that using Gaussian processes (GP) we can predict GET at the individual patient level with reasonable accuracy given the small sample size of the available group of patients. We conclude by presenting an example and future perspectives for improving and extending the proposed framework. The modelling and analysis have the potential to pave the way to designing personalised exercise programmes that are tailored to specific individual needs relative to patient's treatment therapies.
Conflict of interest statement
The authors have declared that no competing interests exist.
Figures
Similar articles
-
Analysis of oxygen uptake efficiency parameters in young people with cystic fibrosis.Eur J Appl Physiol. 2018 Oct;118(10):2055-2063. doi: 10.1007/s00421-018-3926-8. Epub 2018 Jul 12. Eur J Appl Physiol. 2018. PMID: 30003381 Free PMC article.
-
[EXERCISE CAPACITY AND AEROBIC PHYSICAL FITNESS ASSESSMENT AMONG ADOLESCENTS AND ADULTS WITH CYSTIC FIBROSIS BY A QUESTIONNAIRE AND EXERCISE TESTS].Harefuah. 2016 Jun;155(6):352-6, 387, 386. Harefuah. 2016. PMID: 27544987 Hebrew.
-
Cardiopulmonary exercise testing with supramaximal verification produces a safe and valid assessment of V̇o2max in people with cystic fibrosis: a retrospective analysis.J Appl Physiol (1985). 2018 Oct 1;125(4):1277-1283. doi: 10.1152/japplphysiol.00454.2018. Epub 2018 Aug 2. J Appl Physiol (1985). 2018. PMID: 30346240
-
Clinical interpretation of cardiopulmonary exercise testing in cystic fibrosis and implications for exercise counselling.Paediatr Respir Rev. 2017 Sep;24:72-78. doi: 10.1016/j.prrv.2015.09.009. Epub 2015 Oct 13. Paediatr Respir Rev. 2017. PMID: 26515919 Review.
-
Exercise testing in cystic fibrosis: Who and why?Paediatr Respir Rev. 2018 Jun;27:28-32. doi: 10.1016/j.prrv.2018.01.004. Epub 2018 May 18. Paediatr Respir Rev. 2018. PMID: 30158079 Review.
Cited by
-
Encoding Cardiopulmonary Exercise Testing Time Series as Images for Classification using Convolutional Neural Network.Annu Int Conf IEEE Eng Med Biol Soc. 2022 Jul;2022:1611-1614. doi: 10.1109/EMBC48229.2022.9871878. Annu Int Conf IEEE Eng Med Biol Soc. 2022. PMID: 36086506 Free PMC article.
-
Effect of Trikafta on bone density, body composition and exercise capacity in CF: A pilot study.Pediatr Pulmonol. 2023 Feb;58(2):577-584. doi: 10.1002/ppul.26243. Epub 2022 Nov 22. Pediatr Pulmonol. 2023. PMID: 36372909 Free PMC article.
References
-
- Cystic Fibrosis Trust. UK cystic fibrosis registry 2015 annual data report. London, UK; 2016.
-
- Elborn JS. Cystic fibrosis. The Lancet. 2016;388(10059):2519–31. - PubMed
-
- Andréasson B, Jonson B, Kornfält R, Nordmark EVA, Sandström S. Long-term Effects of Physical Exercise on Working Capacity and Pulmonary Function in Cystic Fibrosis. Acta paediatrica. 1987;76(1):70–5. - PubMed
-
- Orenstein DM. Exercise conditioning and cardiopulmonary fitness in cystic fibrosis. The effects of a three-month supervised running program. Chest. 1981;80(4):392 - PubMed
