

Disturbed neurotransmitter homeostasis in ether lipid deficiency
- PMID: 30759250
- PMCID: PMC6548223
- DOI: 10.1093/hmg/ddz040
Disturbed neurotransmitter homeostasis in ether lipid deficiency
Abstract
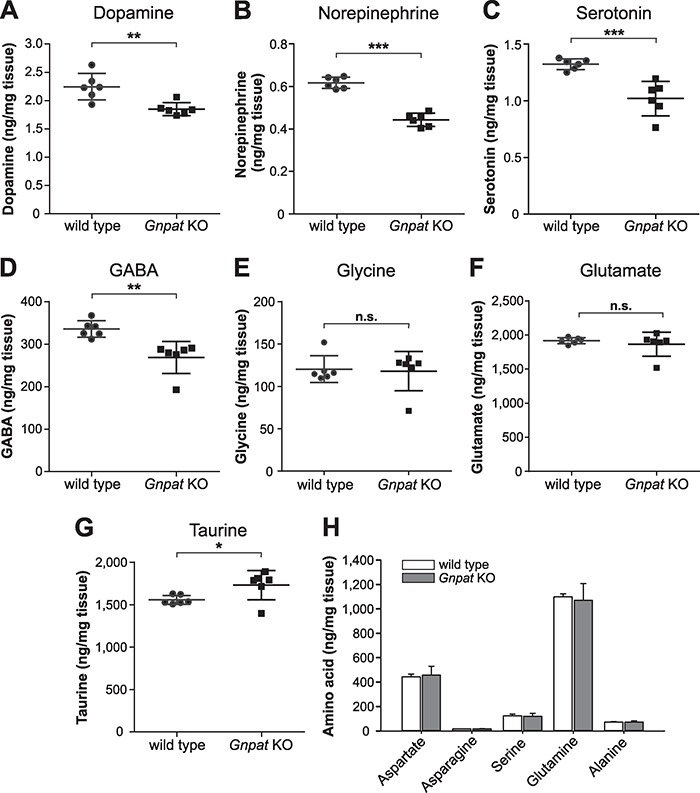
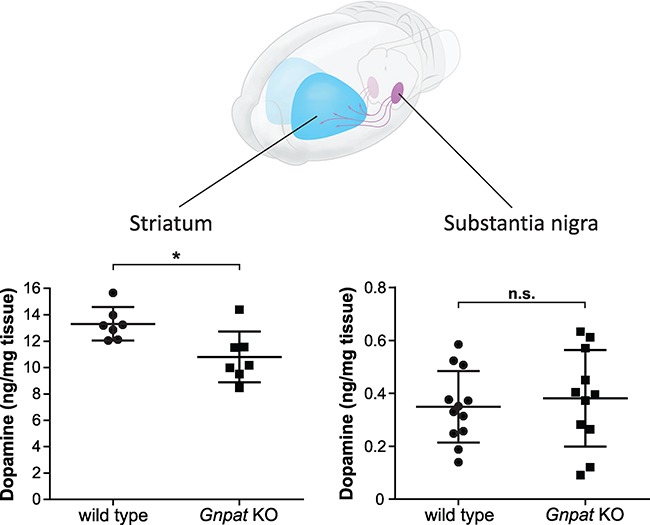
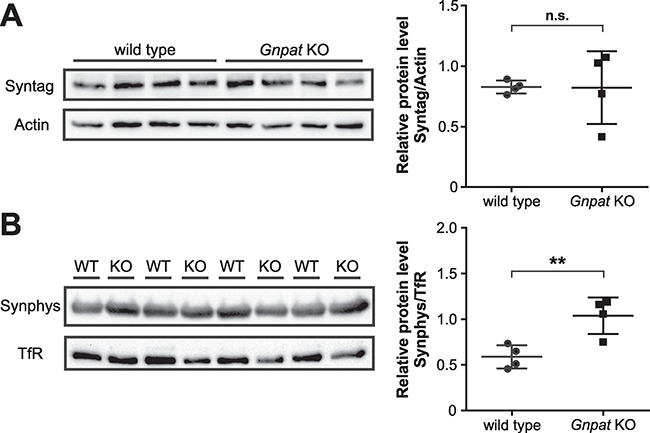
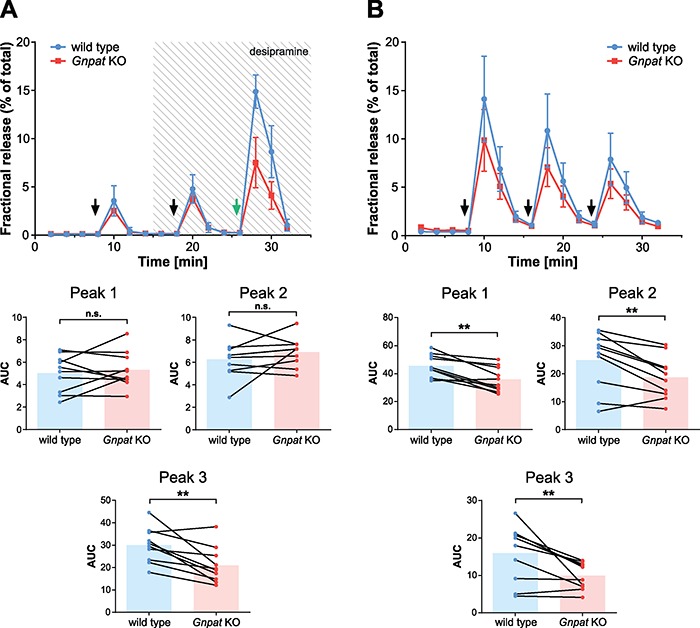
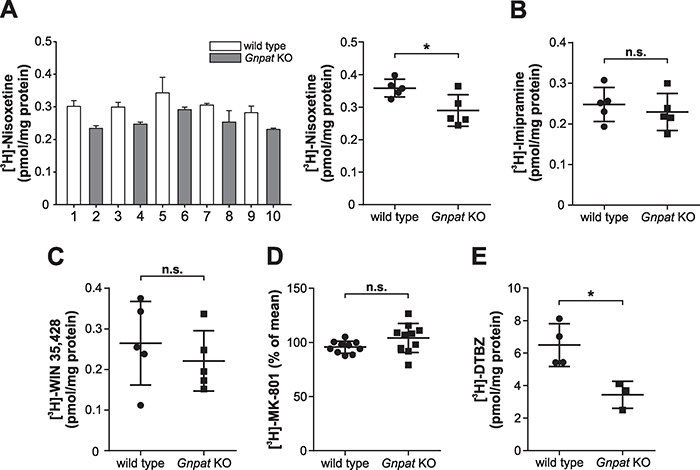
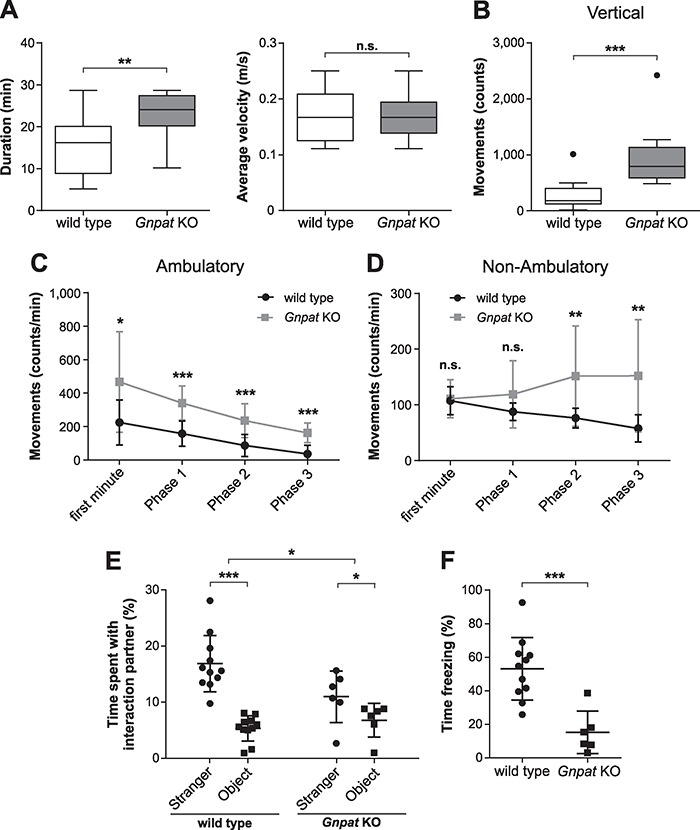
Plasmalogens, the most prominent ether (phospho)lipids in mammals, are structural components of most cellular membranes. Due to their physicochemical properties and abundance in the central nervous system, a role of plasmalogens in neurotransmission has been proposed, but conclusive data are lacking. Here, we targeted this issue in the glyceronephosphate O-acyltransferase (Gnpat) KO mouse, a model of complete deficiency in ether lipid biosynthesis. Throughout the study, focusing on adult male animals, we found reduced brain levels of various neurotransmitters. In the dopaminergic nigrostriatal tract, synaptic endings but not neuronal cell bodies were affected. Neurotransmitter turnover was altered in ether lipid-deficient murine as well as human post-mortem brain tissue. A generalized loss of synapses did not account for the neurotransmitter deficits, since the levels of several presynaptic proteins appeared unchanged. However, reduced amounts of vesicular monoamine transporter indicate a compromised vesicular uptake of neurotransmitters. As exemplified by norepinephrine, the release of neurotransmitters from Gnpat KO brain slices was diminished in response to strong electrical and chemical stimuli. Finally, addressing potential phenotypic correlates of the disturbed neurotransmitter homeostasis, we show that ether lipid deficiency manifests as hyperactivity and impaired social interaction. We propose that the lack of ether lipids alters the properties of synaptic vesicles leading to reduced amounts and release of neurotransmitters. These features likely contribute to the behavioral phenotype of Gnpat KO mice, potentially modeling some human neurodevelopmental disorders like autism or attention deficit hyperactivity disorder.
© The Author(s) 2019. Published by Oxford University Press.
Figures
Similar articles
-
Ether Lipid Deficiency in Mice Produces a Complex Behavioral Phenotype Mimicking Aspects of Human Psychiatric Disorders.Int J Mol Sci. 2019 Aug 13;20(16):3929. doi: 10.3390/ijms20163929. Int J Mol Sci. 2019. PMID: 31412538 Free PMC article.
-
Impaired neurotransmission in ether lipid-deficient nerve terminals.Hum Mol Genet. 2012 Jun 15;21(12):2713-24. doi: 10.1093/hmg/dds097. Epub 2012 Mar 8. Hum Mol Genet. 2012. PMID: 22403185 Free PMC article.
-
SLC10A4 is a vesicular amine-associated transporter modulating dopamine homeostasis.Biol Psychiatry. 2015 Mar 15;77(6):526-36. doi: 10.1016/j.biopsych.2014.07.017. Epub 2014 Jul 24. Biol Psychiatry. 2015. PMID: 25176177
-
A comparative exploration of monoamine neurotransmitter transport disorders: mechanisms, clinical manifestations, and therapeutic approaches.J Med Life. 2025 Mar;18(3):188-195. doi: 10.25122/jml-2024-0398. J Med Life. 2025. PMID: 40291937 Free PMC article. Review.
-
The ether lipid-deficient mouse: tracking down plasmalogen functions.Biochim Biophys Acta. 2006 Dec;1763(12):1511-26. doi: 10.1016/j.bbamcr.2006.08.038. Epub 2006 Aug 30. Biochim Biophys Acta. 2006. PMID: 17027098 Review.
Cited by
-
Per- and Polyfluoroalkyl Substances: Impacts on Morphology, Behavior and Lipid Levels in Zebrafish Embryos.Toxics. 2024 Feb 29;12(3):192. doi: 10.3390/toxics12030192. Toxics. 2024. PMID: 38535925 Free PMC article.
-
Reduction of eEF2 kinase alleviates the learning and memory impairment caused by acrylamide.Cell Biosci. 2024 Aug 23;14(1):106. doi: 10.1186/s13578-024-01285-7. Cell Biosci. 2024. PMID: 39180059 Free PMC article.
-
Oral administration of a synthetic vinyl-ether plasmalogen normalizes open field activity in a mouse model of rhizomelic chondrodysplasia punctata.Dis Model Mech. 2020 Jan 24;13(1):dmm042499. doi: 10.1242/dmm.042499. Dis Model Mech. 2020. PMID: 31862688 Free PMC article.
-
Plasmalogens, platelet-activating factor and beyond - Ether lipids in signaling and neurodegeneration.Neurobiol Dis. 2020 Nov;145:105061. doi: 10.1016/j.nbd.2020.105061. Epub 2020 Aug 28. Neurobiol Dis. 2020. PMID: 32861763 Free PMC article. Review.
-
Benchmarking of Trapped Ion Mobility Spectrometry in Differentiating Plasmalogens from Other Ether Lipids in Lipidomics Experiments.Anal Chem. 2025 May 27;97(20):10578-10587. doi: 10.1021/acs.analchem.4c06617. Epub 2025 May 13. Anal Chem. 2025. PMID: 40358456 Free PMC article.
References
-
- Rohrbough J. and Broadie K. (2005) Lipid regulation of the synaptic vesicle cycle. Nat. Rev. Neurosci., 6, 139–150. - PubMed
-
- Holthuis J.C. and Menon A.K. (2014) Lipid landscapes and pipelines in membrane homeostasis. Nature, 510, 48–57. - PubMed
-
- Futai M., Oka T., Sun-Wada G., Moriyama Y., Kanazawa H. and Wada Y. (2000) Luminal acidification of diverse organelles by V-ATPase in animal cells. J. Exp. Biol., 203, 107–116. - PubMed
-
- Sollner T., Whiteheart S.W., Brunner M., Erdjument-Bromage H., Geromanos S., Tempst P. and Rothman J.E. (1993) SNAP receptors implicated in vesicle targeting and fusion. Nature, 362, 318–324. - PubMed
-
- Brose N., Petrenko A.G., Sudhof T.C. and Jahn R. (1992) Synaptotagmin: a calcium sensor on the synaptic vesicle surface. Science, 256, 1021–1025. - PubMed
Publication types
MeSH terms
Substances
Grants and funding
LinkOut - more resources
Full Text Sources
Molecular Biology Databases
Research Materials
