. 2019 Apr 8;47(6):2739-2756.
doi: 10.1093/nar/gkz095.

Modulation of the ATM/autophagy pathway by a G-quadruplex ligand tips the balance between senescence and apoptosis in cancer cells

Affiliations

Modulation of the ATM/autophagy pathway by a G-quadruplex ligand tips the balance between senescence and apoptosis in cancer cells

Jennifer Beauvarlet et al. Nucleic Acids Res. .

Abstract

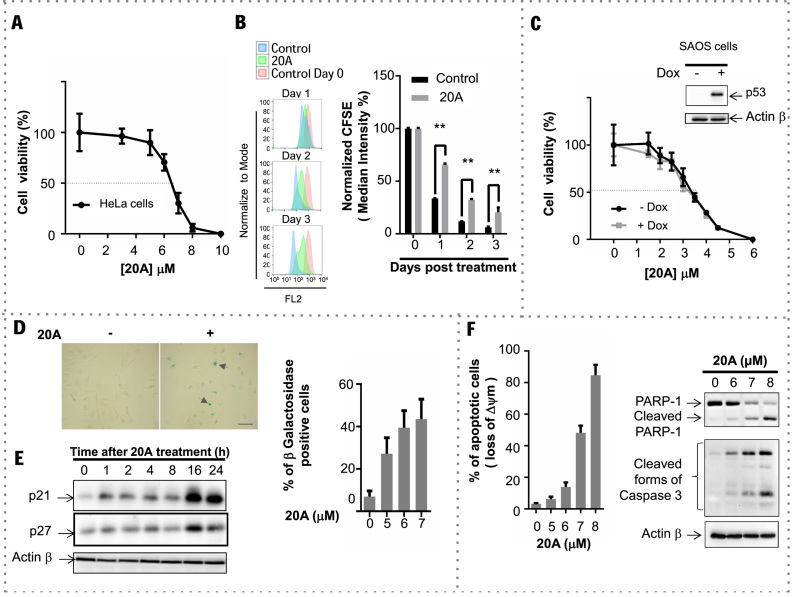
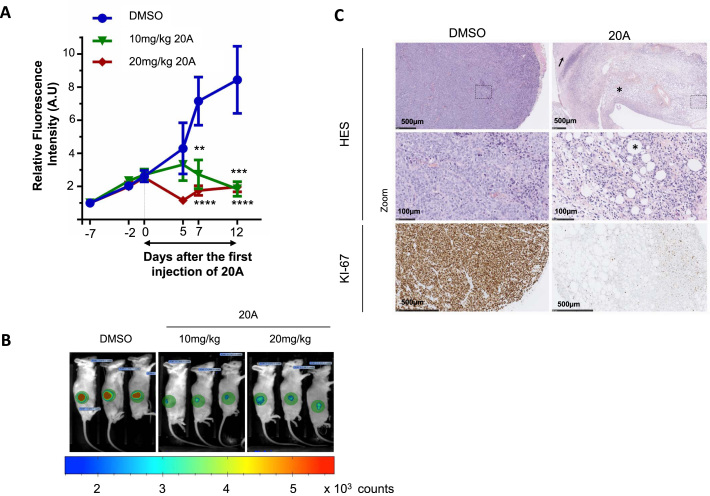
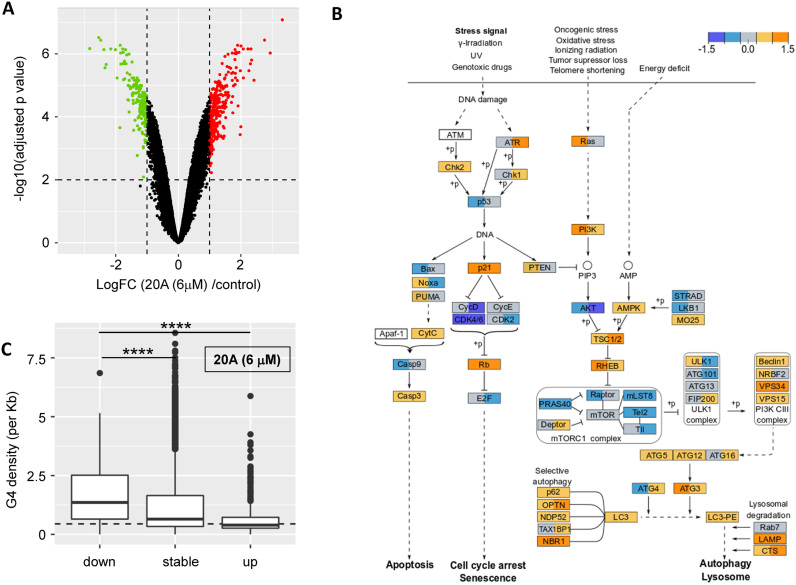
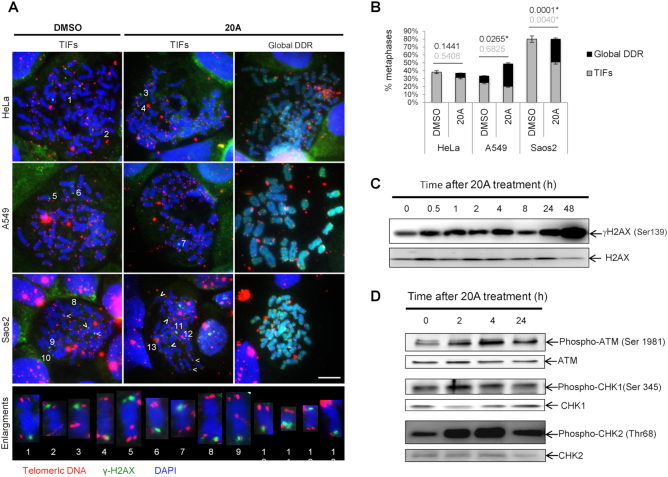
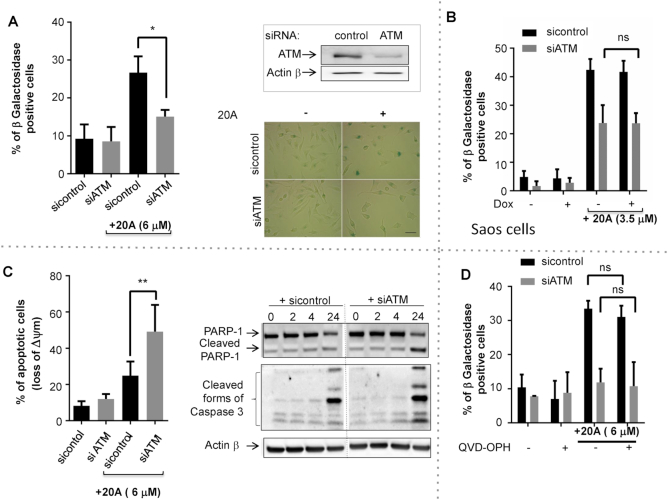
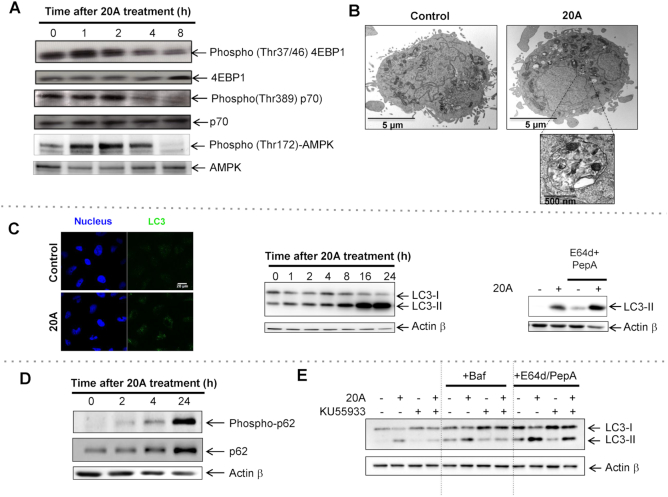
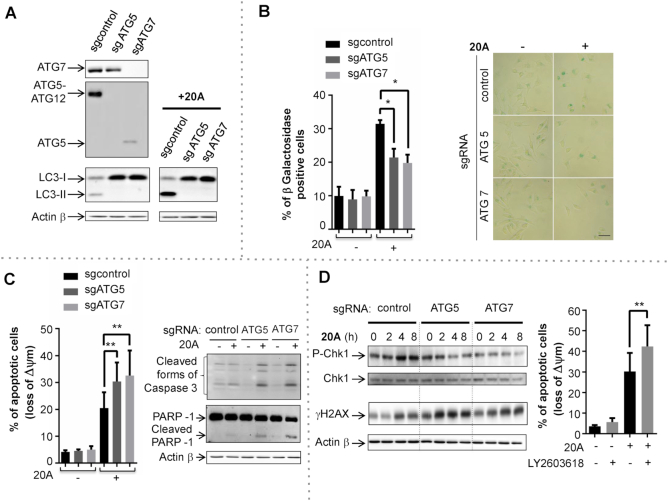
G-quadruplex ligands exert their antiproliferative effects through telomere-dependent and telomere-independent mechanisms, but the inter-relationships among autophagy, cell growth arrest and cell death induced by these ligands remain largely unexplored. Here, we demonstrate that the G-quadruplex ligand 20A causes growth arrest of cancer cells in culture and in a HeLa cell xenografted mouse model. This response is associated with the induction of senescence and apoptosis. Transcriptomic analysis of 20A treated cells reveals a significant functional enrichment of biological pathways related to growth arrest, DNA damage response and the lysosomal pathway. 20A elicits global DNA damage but not telomeric damage and activates the ATM and autophagy pathways. Loss of ATM following 20A treatment inhibits both autophagy and senescence and sensitizes cells to death. Moreover, disruption of autophagy by deletion of two essential autophagy genes ATG5 and ATG7 leads to failure of CHK1 activation by 20A and subsequently increased cell death. Our results, therefore, identify the activation of ATM by 20A as a critical player in the balance between senescence and apoptosis and autophagy as one of the key mediators of such regulation. Thus, targeting the ATM/autophagy pathway might be a promising strategy to achieve the maximal anticancer effect of this compound.


Figures

Figure 1.
Figure 1.
20A treatment results in cancer cell growth arrest through the induction of senescence and apoptosis. (A) Viability of HeLa cells after a 24-h exposure to 20A at concentrations ranging from 1 to 10 μM. Plotted are means ± S.D. of three independent experiments, each performed in quadruplicate. (B) HeLa cells were labeled with 1 μM CFSE (day 0) and then treated with 6 μM 20A. Flow cytometry analysis of the CFSE fluorescence intensity was monitored on indicated days. Left, representative flow cytometry traces in which the red histogram corresponds to the day of cell staining (day 0). Control cells were mock treated. Right, results expressed as MFI normalized to that obtained from day zero. Plotted are means ± S.D. of six values obtained from two independent experiments, each performed in triplicate. **P < 0.01 using Mann–Whitney test. (C) Saos-2 cells were grown in either the presence or absence of 0.5 μg/ml Dox for 6 h and then treated for 24 h with the indicated concentration of 20A. Plotted are means ± S.D. of three independent experiments, each performed in quadruplicate. Inset represents western blot analysis of p53 expression levels in Saos-2 cells grown in the presence or absence of 0.5 μg/ml Dox for 6 h; ACTINβ was detected as a loading control. (D) HeLa cells were treated with 6 μM 20A for the indicated time and then stained for β-galactosidase activity to detect senescence. Left, representative images of cells stained for β-galactosidase (arrowheads indicate senescent cells; scale bar = 50 μm). Total cell number and total number of β-galactosidase-positive cells were scored to determine the fraction of senescent cells. Data are means ± S.D. of four independent experiments; at least 100 cells from 10 randomly chosen fields were counted in each experiment. *P < 0.05 using Mann–Whitney test. (E) Representative immunoblot analysis of p21, p27 and ACTINβ levels in HeLa cells treated with 6 μM 20A for the indicated time. (F) Apoptotic cell death evaluated after treatment of HeLa cells with the indicated concentration of 20A for 24 h. Left, percentage of cells that have lost mitochondrial transmembrane potential (Δψm) plotted versus 20A concentration. Results are means ± S.D. of triplicate data obtained from one experiment. Right, immunoblot analysis of cleaved forms of caspase 3 and PARP1 in cells treated with the indicated concentrations of 20A; ACTINβ was detected as a loading control.
Figure 2.
Figure 2.
20A treatment compromises tumor growth in mice bearing HeLa xenografts. (A) The tdTomato fluorescence within tumors was recorded in HeLa xenografts in mice during the treatment period with DMSO (control) or 10 or 20 mg/kg 20A per injection. Tumor growth is plotted as means ± S.E.M. of the relative fluorescence intensity within the xenografts scored on indicated days following tumor implantation from 10 mice per group. P **<0.01; ***<0.001; ****<0.0001 with Mann–Whitney test compared to DMSO-treated group. (B) For each treatment group, images of three representative mice are shown at day 12 after treatment initiation. The fluorescence intensity is presented as a rainbow scale with increasing intensity from blue to red. The green circles represent areas used to measure total fluorescence intensity. (C) Representative images of hematoxylin-eosin-saffron stained DMSO-treated and 20 mg/kg 20A-treated tumor sections performed at the end of the treatment period. Arrow indicates tumor cells with necrosis and asterisk shows fibrosis and adiponecrosis. Immunohistochemistry (IHC) analyses for Ki67 expression were also performed on the paraffin-embedded sections of tumor tissues.
Figure 3.
Figure 3.
Transcriptome analysis of 20A treated cells. (A) Global changes in gene expression in 20A treated cells. limma differential expression results are plotted with the x-axis showing the log fold changes between 6 μM 20A treatment versus control cells (after 16 h, Figure 3A) or 6 h, Figure S2C) and the y-axis showing the significance of the statistical tests (p corrected for multi-testing minus log transformed). Green and red dots highlight significantly down- and up-regulated genes (absolute log fold change above 1 and significance above 2; P < 0.01). Results related to the proteomics analysis are presented in Figure S2A and S2B and Table S1. (B) Results obtained on three interconnected KEGG signaling pathways that are significantly enriched in response to 20A treatment (p53, MTORC1 and autophagy; each pathway is individually shown in Figure S6). For each gene product, the value of log fold change at 6 h (in the left part of the box) and log fold change at 16 h (in the right part of the box) are presented and denoted with the color code presented on the top of the figure. Log fold change values between −0.3 and 0.3 are colored in gray, those between 0.3 and 0.9 are in light orange, above 0.9 are in orange, between -0.3 and -0.9 are in light blue and those below -0.9 are in dark blue. Solid lines represent direct regulation, dotted lines represent indirect regulation and ‘+p’ indicates regulation by phosphorylation. (C) G4 density in gene bodies for genes down-regulated by 20A, not significantly affected (‘stable’) by 6 μM 20A, or up-regulated after 16 h of treatment with 20A. Results obtained after 6 h are presented in Figure S7B. ****p< 0.0001 versus genes down-regulated.
Figure 4.
Figure 4.
20A causes global DNA damage but not telomeric damage. (A) Representative metaphases for HeLa, A549 and Saos2 cells displaying TIFs or global DDR under two experimental conditions, 24-h treatment with 20A or DMSO. Telomeric DNA (TelC, red), (γH2AX, green) and (4′,6-Diamidino-2-phenylindoledihydrochloride (DAPI), blue). Enlargements of chromosomes with TIFs are shown; scale bar = 10 μM. (B) Quantification of metaphases with at least one TIF or global DDR. Two biological replicates, n = 35–45 metaphases per condition. P-values, statistics of proportions for Global DDR (black print) and TIFs (gray print), * p value < 0.05 versus untreated cells. (C) HeLa cells were treated with 6 μM 20A at time indicated and then subjected to western blotting analysis for γH2AX and total H2AX. (D) Western blotting analysis of the levels of phospho-ATM (Ser 1981), ATM, phospho-CHK1 (Ser 345), CHK1, phospho-CHK2 (Thr68) and CHK2 in HeLa cells following treatment with 6 μM 20A for the indicated times.
Figure 5.
Figure 5.
ATM is activated by 20A to direct cells to senescence instead of apoptosis. In panels A, C and D HeLa cells were transiently transfected with either ATM siRNA or control siRNA. 20A (6 μM) was added 24 h later for a period of 24 h. (A) Left: the percent of senescent cells determined as described in Figure 1D. Data are means ± S.D. of four independent experiments. *P < 0.05 using Mann–Whitney test. Upper right, immunoblot analysis of the levels of ATM protein expression in either the presence or absence of siRNA ATM. Lower right, representative images of cells treated as indicated and stained for β-galactosidase; scale bar = 50 μm. (B) Saos-2 cells were grown in either the presence or absence of 0.5 μg/ml Dox for 6 h and then treated for 24 h with 3.5 μM 20A. The percentage of senescent cells was determined as described in Figure 1D. Data correspond to the mean ± S.D. of three independent experiments. (C) Left, apoptotic cell death was scored by measurement of loss of Δψm. The data are presented as means ± S.D. of eight values obtained from four independent experiments each performed in duplicate. **P < 0.01 using Mann–Whitney test. Right, immunoblot images of the appearance of the cleaved forms of both caspase 3 and PARP1 are shown. (D) Cells were incubated for 2 h with QVD-OPH (20 μM) prior the addition of 6 μM 20A for 24 h. The percent of senescent cells determined as described in Figure 1D. Data correspond to the mean ± S.D. of three independent experiments. *ns: not significant by t-test.
Figure 6.
Figure 6.
20A promotes autophagy induction through a mechanism that involves ATM activation. (A) HeLa cells were treated for the indicated times with 6 μM 20A. The activities of the MTORC1 and AMPK pathways were determined by immunoblot analysis using antibodies directed against phospho-4EBP1 (Thr37/46), 4EBP1, phospho-p70 (Thr 389), p70, phospho-AMPK (Thr 172) and AMPK. (B) Representative electron micrographs of HeLa cells untreated or treated for 16 h with 6 μM 20A. (C) Left, immunofluorescence analysis for the abundance of LC3 puncta (green dots) in HeLa cells after 3 h in either the absence or presence of 6 μM 20A; Hoechst was used to stain nuclei (blue). Representative confocal images are shown; scale bar = 10 μm. Center, immunoblot images of LC3-II levels in HeLa cells treated with 6 μM 20A for the indicated times. Right, immunoblot of cells treated with or without E64d (10 μg/ml) plus pepstatin A (2 μg/ml) 2 h prior 20A treatment (6 μM, 8 h). (D) Immunoblot analysis of phospho-p62 (Ser 403) and p62 levels in HeLa cells treated with 6 μM 20A for the indicated times. (E) Immunoblot analysis of LC3-II levels in HeLa cells incubated with or without 10 μM KU55933 for 2 h and then treated with 6 μM 20A for 8 h. Where indicated, cells were incubated with 10 μg/ml E64d plus 2 μg/ml pepstatin A for 2 h prior 20A treatment. Where noted, bafilomycin A1 (50 nM) was added 3 h before cell lysis.
Figure 7.
Figure 7.
Autophagy disruption causes a deficiency in CHK1 activation and sensitizes cells to apoptosis induced by 20A. (A) Autophagy disruption in HeLa cells was validated by immunoblot analysis of ATG5, ATG7, LC3-II in autophagy-proficient (sgControl) and autophagy-deficient (sgATG5 and sgATG7) cells following treatment with 6 μM 20A for 16 h. (B) Left, the percentages of senescent cells were scored by β-galactosidase staining as described in Figure 1D in sgControl, sgATG5 and sgATG7 cells after 24h treatment with 6 μM 20A. The data are presented as means ± S.D. of four independent experiments. *P < 0.05 using Mann–Whitney test. Right, representative cell images; scale bar = 50 μm. (C) Autophagy-proficient (sgControl) and autophagy-deficient (sgATG5 and sgATG7) cells were treated with 6 μM 20A for 24 h. Left, loss of mitochondrial transmembrane potential was evaluated by flow cytometry. Data are means ± S.D. of 12 values obtained from four independent experiments each performed in triplicate. **P < 0.01 using Mann–Whitney test. Right, immunoblot analysis of cleaved forms of caspase 3 and PARP1. (D) Left, immunoblot analysis of phospho-CHK1 (Ser 345) and γH2AX (Ser 139) levels in sgControl, sgATG5 and sgATG7 cells treated with 6 μM 20A for the indicated time. Right, loss of mitochondrial transmembrane potential was evaluated by flow cytometry assay in HeLa cells pretreated for 2 h with the CHK1 inhibitor LY2603618 (0.5 μM) prior to treatment with 6 μM 20A for an additional 24 h. The data are presented as means ± S.D. of nine values obtained from three independent experiments each performed in triplicate. **P < 0.01 using Mann–Whitney test.

References

    1. Huppert J.L., Balasubramanian S.. G-quadruplexes in promoters throughout the human genome. Nucleic Acids Res. 2007; 35:406–413. - PMC - PubMed
    1. Bedrat A., Lacroix L., Mergny J.-L.. Re-evaluation of G-quadruplex propensity with G4Hunter. Nucleic Acids Res. 2016; 44:1746–1759. - PMC - PubMed
    1. Hänsel-Hertsch R., Di Antonio M., Balasubramanian S.. DNA G-quadruplexes in the human genome: detection, functions and therapeutic potential. Nat. Rev. Mol. Cell Biol. 2017; 18:279–284. - PubMed
    1. Neidle S. Quadruplex nucleic acids as novel therapeutic targets. J. Med. Chem. 2016; 59:5987–6011. - PubMed
    1. Riou J.F., Guittat L., Mailliet P., Laoui A., Renou E., Petitgenet O., Mégnin-Chanet F., Hélène C., Mergny J.L.. Cell senescence and telomere shortening induced by a new series of specific G-quadruplex DNA ligands. Proc. Natl. Acad. Sci. U.S.A. 2002; 99:2672–2677. - PMC - PubMed

Publication types

MeSH terms