

Selective recognition of c-MYC Pu22 G-quadruplex by a fluorescent probe
- PMID: 30759259
- PMCID: PMC6412119
- DOI: 10.1093/nar/gkz059
Selective recognition of c-MYC Pu22 G-quadruplex by a fluorescent probe
Abstract
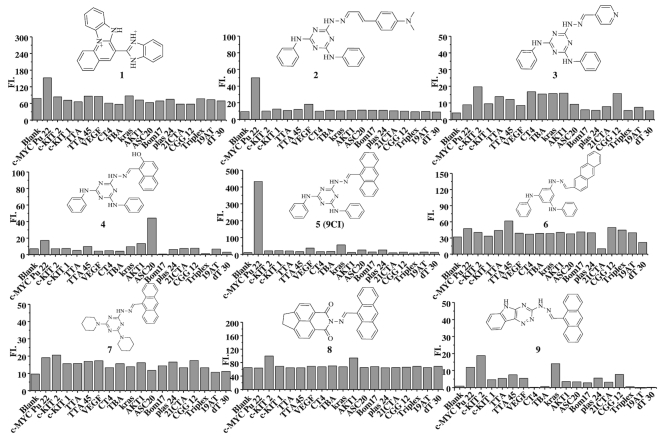
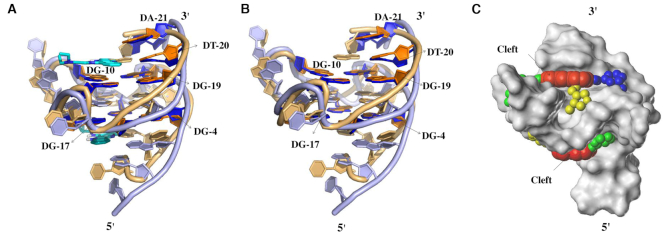
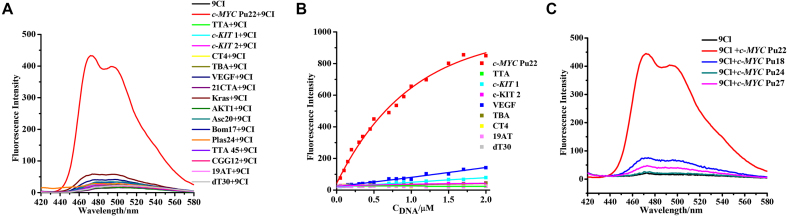
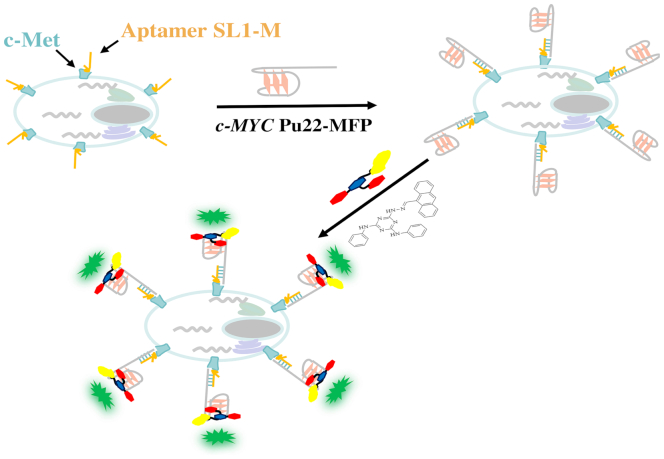
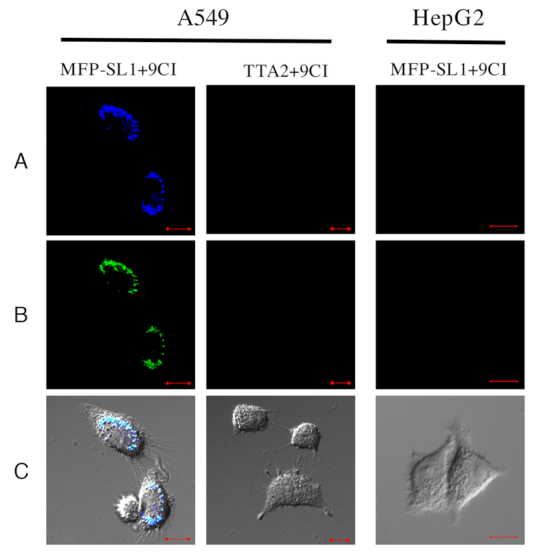
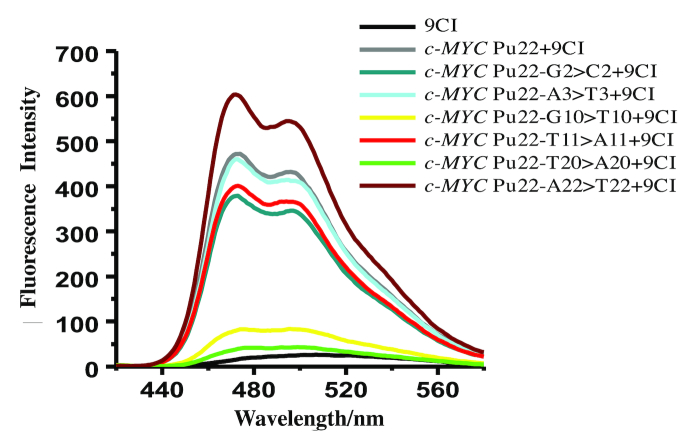
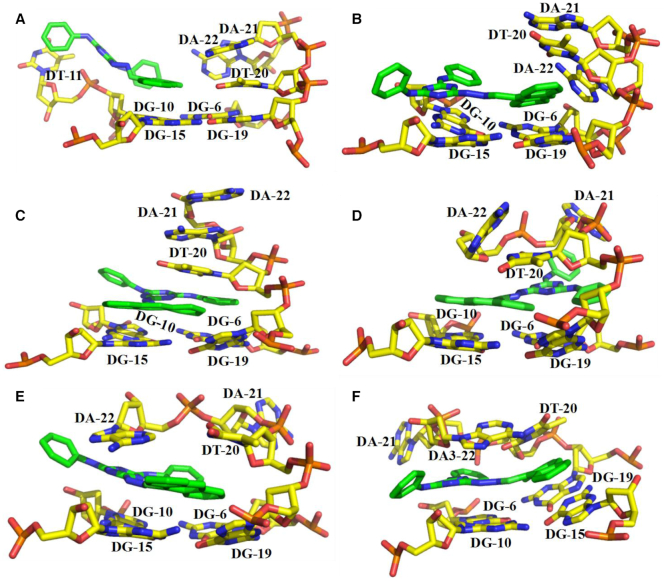
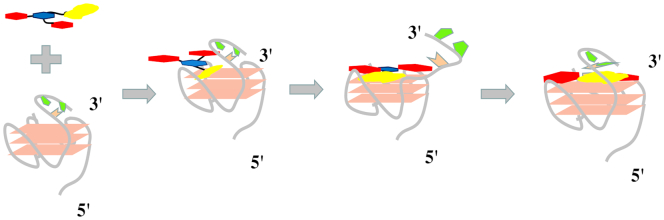
Nucleic acid mimics of fluorescent proteins can be valuable tools to locate and image functional biomolecules in cells. Stacking between the internal G-quartet, formed in the mimics, and the exogenous fluorophore probes constitutes the basis for fluorescence emission. The precision of recognition depends upon probes selectively targeting the specific G-quadruplex in the mimics. However, the design of probes recognizing a G-quadruplex with high selectivity in vitro and in vivo remains a challenge. Through structure-based screening and optimization, we identified a light-up fluorescent probe, 9CI that selectively recognizes c-MYC Pu22 G-quadruplex both in vitro and ex vivo. Upon binding, the biocompatible probe emits both blue and green fluorescence with the excitation at 405 nm. With 9CI and c-MYC Pu22 G-quadruplex complex as the fluorescent response core, a DNA mimic of fluorescent proteins was constructed, which succeeded in locating a functional aptamer on the cellular periphery. The recognition mechanism analysis suggested the high selectivity and strong fluorescence response was attributed to the entire recognition process consisting of the kinetic match, dynamic interaction, and the final stacking. This study implies both the single stacking state and the dynamic recognition process are crucial for designing fluorescent probes or ligands with high selectivity for a specific G-quadruplex structure.
© The Author(s) 2019. Published by Oxford University Press on behalf of Nucleic Acids Research.
Figures
Similar articles
-
DNA Binding Mode Analysis of a Core-Extended Naphthalene Diimide as a Conformation-Sensitive Fluorescent Probe of G-Quadruplex Structures.Int J Mol Sci. 2021 Sep 30;22(19):10624. doi: 10.3390/ijms221910624. Int J Mol Sci. 2021. PMID: 34638964 Free PMC article.
-
G4-FID: a fluorescent DNA probe displacement assay for rapid evaluation of quadruplex ligands.Methods Mol Biol. 2010;608:257-71. doi: 10.1007/978-1-59745-363-9_15. Methods Mol Biol. 2010. PMID: 20012426
-
Exploring the Parallel G-Quadruplex Nucleic Acid World: A Spectroscopic and Computational Investigation on the Binding of the c-myc Oncogene NHE III1 Region by the Phytochemical Polydatin.Molecules. 2022 May 7;27(9):2997. doi: 10.3390/molecules27092997. Molecules. 2022. PMID: 35566347 Free PMC article.
-
Visualizing the quadruplex: from fluorescent ligands to light-up probes.Top Curr Chem. 2013;330:111-77. doi: 10.1007/128_2012_346. Top Curr Chem. 2013. PMID: 22886708 Review.
-
Small Molecule Fluorescent Probes for G- Quadruplex Visualization as Potential Cancer Theranostic Agents.Molecules. 2019 Feb 19;24(4):752. doi: 10.3390/molecules24040752. Molecules. 2019. PMID: 30791494 Free PMC article. Review.
Cited by
-
A Minimalistic Coumarin Turn-On Probe for Selective Recognition of Parallel G-Quadruplex DNA Structures.ACS Chem Biol. 2021 Aug 20;16(8):1365-1376. doi: 10.1021/acschembio.1c00134. Epub 2021 Jul 30. ACS Chem Biol. 2021. PMID: 34328300 Free PMC article.
-
Enhanced Rigidity Changes Ultraviolet Absorption: Effect of a Merocyanine Binder on G-Quadruplex Photophysics.J Phys Chem Lett. 2020 Dec 3;11(23):10212-10218. doi: 10.1021/acs.jpclett.0c03070. Epub 2020 Nov 18. J Phys Chem Lett. 2020. PMID: 33206544 Free PMC article.
-
Native de novo structural determinations of non-canonical nucleic acid motifs by X-ray crystallography at long wavelengths.Nucleic Acids Res. 2020 Sep 25;48(17):9886-9898. doi: 10.1093/nar/gkaa439. Nucleic Acids Res. 2020. PMID: 32453431 Free PMC article.
-
Selective Recognition of a Single HIV-1 G-Quadruplex by Ultrafast Small-Molecule Screening.Anal Chem. 2021 Nov 23;93(46):15243-15252. doi: 10.1021/acs.analchem.0c04106. Epub 2021 Nov 11. Anal Chem. 2021. PMID: 34762806 Free PMC article.
-
DNA G-Quadruplexes as Targets for Natural Product Drug Discovery.Engineering (Beijing). 2024 Jul;38:39-51. doi: 10.1016/j.eng.2024.03.015. Epub 2024 May 6. Engineering (Beijing). 2024. PMID: 40809342 Free PMC article.
References
-
- Hansel-Hertsch R., Di Antonio M., Balasubramanian S.. DNA G-quadruplexes in the human genome: detection, functions and therapeutic potential. Nat. Rev. Mol. Cell Biol. 2017; 18:279–284. - PubMed
Publication types
MeSH terms
Substances
LinkOut - more resources
Full Text Sources
