. 2019 Jun;34(6):832-844.
doi: 10.1002/mds.27632. Epub 2019 Feb 13.

Striatal spreading depolarization: Possible implication in levodopa-induced dyskinetic-like behavior

Affiliations

Striatal spreading depolarization: Possible implication in levodopa-induced dyskinetic-like behavior

Antonio de Iure et al. Mov Disord. 2019 Jun.

Abstract

Objective: Spreading depolarization (SD) is a transient self-propagating wave of neuronal and glial depolarization coupled with large membrane ionic changes and a subsequent depression of neuronal activity. Spreading depolarization in the cortex is implicated in migraine, stroke, and epilepsy. Conversely, spreading depolarization in the striatum, a brain structure deeply involved in motor control and in Parkinson's disease (PD) pathophysiology, has been poorly investigated.

Methods: We characterized the participation of glutamatergic and dopaminergic transmission in the induction of striatal spreading depolarization by using a novel approach combining optical imaging, measurements of endogenous DA levels, and pharmacological and molecular analyses.

Results: We found that striatal spreading depolarization requires the concomitant activation of D1-like DA and N-methyl-d-aspartate receptors, and it is reduced in experimental PD. Chronic l-dopa treatment, inducing dyskinesia in the parkinsonian condition, increases the occurrence and speed of propagation of striatal spreading depolarization, which has a direct impact on one of the signaling pathways downstream from the activation of D1 receptors.

Conclusion: Striatal spreading depolarization might contribute to abnormal basal ganglia activity in the dyskinetic condition and represents a possible therapeutic target. © 2019 International Parkinson and Movement Disorder Society.

Keywords: D1 like receptor; LIDs; Parkinson's disease; Spreading depolarization; Striatum.


Figures

FIG. 1.
FIG. 1.
Spreading depolarization originating within the nucleus striatum in rat corticostriatal slice. (A) Drawing of a coronal corticostriatal rat slice showing the propagation of striatal spreading depolarization (SSD) that originates within striatal tissue (left) and diffuses to the whole striatum. (B) Representative traces showing the change of the resting membrane potential of a striatal spiny projection neuron (top), of the striatal DC potential (middle) and of the intrinsic optical signal (IOS) drawn in a region of interest (ROI; bottom) following a 4-minute application of 26 mM potassium chloride (KCl) to a corticostriatal slice maintained in a standard Kreb’s solution. (C) Images of a representative rat corticostriatal slice, maintained in a magnesium-free Kreb’s solution, showing 2 consecutive SSD episodes propagating over time. (D) Graph showing the IOS changes measured from the slice presented in C during the first and second SSD episodes induced by KCl application (arrow). Note the typical biphasic IOS change associated to a KCl-induced SSD. (E) Histogram showing the early peak and delayed phase amplitudes of IOS changes during the second SSD episode with respect to the first SSD episode (dotted line, control in predrug condition; n = 11 slices for each experimental group; early peak, % of 1st episode, 95.57 ± 2.34%, t10 = 1.89, P > .05; delayed peak, % of 1st episode, 106.0 ± 5.58%, t10 = 1.082, P > .05, paired Student’s t test). (F) Histogram showing the percentage of striatal slices presenting SSD following KCl application when maintained in a standard Kreb’s solution (standard solution, 60%, n = 12 of 21 slices and 40%, n = 8 of 21 slices) or in a magnesium-free solution (Mg2+-free, n = 15 of 15 slices). **P < .01,*** P < .001, chi-square test. CC, corpus callosum.
FIG. 2.
FIG. 2.
Striatal spreading depolarization (SSD) is prevented by N-methyl-d-aspartate (NMDA), but not α-amino-3-hydroxy-5-methyl-4-isoxazolepropionic acid (AMPA), receptor antagonism and triggers phosphorylation of extracellular signal–regulated kinase (ERK). (A) Images of a corticostriatal slice in control conditions (left) during a potassium chloride (KCl)–induced SSD (middle) and following a second episode of SSD induced by a KCl application in the presence of the NMDA receptor antagonist L-aminophosphonovalerate (L-APV). (B) The graph on the left shows the intrinsic optical signal (IOS) changes, measured in the region of interest (ROI) of the slice presented in A during the first SSD episode (predrug condition) and during the second SSD episode recorded in the presence of L-APV. The histogram shows the IOS peaks amplitudes during the second episode of SSD induced in the presence of L-APV in respect to the first SSD episode (control in predrug condition; early peak, predrug vs APV, n = 11 slices for both, 17.32 ± 3.88%, t10 = 21.27, ***P < .001; delayed phase, n = 11 for both, 40.85 ± 5.38%, t10 = 10.98, ***P < .001, paired Student’s t test). (C) Traces on the left show striatal IOS (top) and DC potential (bottom) recordings during a first SSD episode (control) and during a second episode in the presence of L-APV in a decorticated slice. Histogram on the right show the IOS peaks amplitudes (top) and discontinuous current (DC) potential shifts (bottom) during SSD induced in the presence of L-APV in decorticated slices. (IOS: early peak, predrug vs APV, n = 4 slices for both, 26.09 ± 16.77%, t6 = 2.8, *P < .05; delayed phase, n = 4 for both, 39.9 ± 10.41 %, P > .05; DC potential shift, predrug vs APV, n = 5 slices, t4 = 2.8, *P < .05, paired Student’s t test). (D) Images of a corticostriatal slice in control conditions (left) during a KCl-induced SSD (middle) and following a second episode of SSD in the presence of the AMPA receptor antagonist 6-cyano-7-nitroquinoxaline-2,3-dione (CNQX). (E) The graph on the left shows the IOS changes, measured in the ROI of the slice in D, during SSD induced in predrug condition and during the second SSD episode induced in the presence of CNQX. The histogram shows the IOS peak amplitudes during the second episode of SSD induced in the presence of CNQX in respect to the first SSD episode (control in predrug condition; early peak, predrug, n = 6 slices, vs CNQX, n = 5 slices, 95.91 ± 7.72%, t4 = 0.529, P > .05; delayed phase, predrug vs CNQX, n = 5 slices for both, 100.6 ± 5.03%, t4 = 0.109, P > .05; paired Student’s t test). (F) Striatal ERK phosphorylation levels in rat slices following SSD (n = 3 slices for both groups, control, 100.0 ± 13.31% vs SSD, 184.1 ± 18.94, t4 = 3.63, *P < .05, unpaired Student’s t test). All data are expressed as mean ± standard error. SSD is induced in a magnesium-free solution.
FIG. 3.
FIG. 3.
Striatal spreading depolarization (SSD) is prevented by D1, but not D2, DA receptor antagonism and is associated to phosphorylation of the α-amino-3-hydroxy-5-methyl-4-isoxazolepropionic acid (AMPA) GluA1 subunit. (A) Images of a corticostriatal slice in control conditions (left) during a potassium chloride (KCl)–induced SSD (middle) and following a second episode of SSD in the presence of the D1 DA receptor antagonist SCH 23390. (B) The graph on the left shows the intrinsic optical signal (IOS) changes, measured in the region of interest (ROI) of the slice presented in A, during the first (predrug condition) and the second SSD episode recorded in the presence of SCH 23390. The histogram shows the IOS peak amplitudes during the second SSD episode induced in the presence of SCH 23390 in respect to the first SSD episode (control in predrug condition; n = 8 slices for both groups, early peak, predrug vs SCH, 15.58 ± 2.65%, t7 = 31.86, ***P < .001; delayed phase, predrug, n = 7 slices, vs SCH, n = 8 slices, 34.61 ± 4.18%, t6 = 18.79, ***P < .001; paired Student’s t test). (C) Images of a corticostriatal slice in control conditions (left) during a KCl-induced SSD (middle) and following a second episode of SSD in the presence of the D2 DA receptor antagonist L-sulpiride (L-sulp). (D) The graph on the left shows the IOS changes measured in the ROI of the slice presented in C during the first SSD episode (predrug condition) and the second SSD recorded in the presence of L-sulpiride. The histogram shows the IOS peak amplitudes during the second SSD episode induced in the presence of L-sulpiride with respect to the first SSD episode (dotted line, control in predrug condition; n = 6 slices for all groups, early peak, predrug vs L-sulp, 91.14 ± 6.60%, t5 = 1.34, P > .05; delayed phase, predrug vs L-sulp, 93.66 ± 5.21%, t5 = 1.21, P > .05; paired Student’s t test). (E) Striatal GluA1 phosphorylation levels at Ser845 residue in rat slices undergoing SSD, under both basal condition (vehicle; n = 3 for each experimental group; 2-way analysis of variance, SSD effect, F1,12 = 32.50, P < .0001; vehicle CTR vs vehicle SSD, t4 = 12.32, **P = .0002, unpaired Student’s t test) and following a bath application of 10 μM SKF 38393 (SSD, t4 = 3.47, *P = .0256, unpaired Student’s t test) or 10 μM SCH 23390 (SSD, t4 = 0.66, P = .5450). SSD is induced in a magnesium-free solution. All data are expressed as mean ± standard error.
FIG. 4.
FIG. 4.
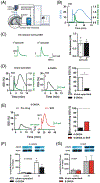
Striatal spreading depolarization (SSD) is dependent on striatal DA levels stimulating the D1 receptor-mediated signaling pathway. (A) Representation of the acquisition system for the combined intrinsic optical signal (IOS) and amperometric detection in rat corticostriatal slices. The IOS emitted from the slice is acquired by a charge-coupled device (CCD) camera and transferred to a personal computer. Amperometric currents are detected by a carbon fiber electrode connected to a potentiostat also interfaced to the personal computer. A potassium chloride (KCl) application delivered by a perfusion system can trigger a SSD episode and DA release in the slice preparation. (B) Graph showing the superimposed time courses of the percentage IOS (left y axis) and the DA concentration (right y axis) changes associated to a KCl-induced SSD. (C) Traces of amperometric transient currents showing changes in DA concentration following KCl applications during 2 consecutive SSD episodes. The histogram shows reproducible DA concentration increases associated to first and second KCl-induced SSD episodes (1st episode, n = 5, 0.85 ± 0.18 nA vs 2nd episode, n = 3, 0.87 ± 0.13 nA, t6 = 0.076, P > .05, unpaired Student’s t test). (D) Graphs showing the superimposed time courses of the percentage IOS and the DA concentration changes associated with a KCl-induced SSD in a slice of a sham-operated rat and of a 6-Hydroxydopamine (6-OHDA) DA-denervated animal. Histogram showing the percentage of slices of sham-operated and 6-OHDA rats presenting SSD (*P < .05, chi-square test). (E) Graph showing the superimposed time courses of the percentage IOS and the DA concentration changes during the first SSD episode (predrug condition) and during the second SSD episode recorded in the presence of SKF 38393 in a slice of a 6-OHDA DA-denervated rat. Histogram showing the percentage of slices of 6-OHDA rats presenting SSD in the presence and absence of the D1 receptor agonist SKF 38393. (F, G) Glutamate Ampa Receptor 1A (GluA1) GluA1 phosphorylation levels at Ser845 residue in the striatum of 6-OHDA-lesioned rat slices following SSD under both basal conditions (F; n = 3 for all of the experimental groups; 2-way analysis of variance; SSD effect, F1,8 = 31.90, *P = .0005) and on bath application of 10 μM SKF 38393 (P = .0838, unpaired Student’s t test). The D1 receptor agonist was able to rescue the striatal adenosine 3′,5′-cyclic monophosphate (cAMP)/protein kinase A (PKA) reduction found in the untreated lesioned slices (n = 3 for all the experimental groups; 2-way analysis of variance; SSD effect, F1,8 = 7.494, P = .0255; G). SSD is induced in a standard Kreb’s solution. All data are expressed as mean ± standard error. *P < .05.
FIG. 5.
FIG. 5.
Striatal spreading depolarization (SSD) and DA levels in dyskinetic and non dyskinetic rats. (A) Histogram showing the percentage of corticostriatal slices presenting SSD in different experimental groups of sham-operated, 6-OHDA-denervated, and l-dopa-treated 6-OHDA (dyskinetic and non dyskinetic) rats. (B) Histogram and representative traces of the amperometric striatal DA peak currents measured in corticostriatal slices of the different animal groups used for SSD measure (n = 5 6-OHDA vs n = 7 sham operated, t10 = 9.083, ***P < .001; n = 10 6-OHDA plus l-dopa [3 days] vs n = 7 6-OHDA plus l-dopa [15 days] non dyskinetic, t15 = 0.37, P > .05; 6-OHDA plus l-dopa [3 days] vs n = 8 6-OHDA plus l-dopa [15 days] dyskinetic, t16 = 0.65, P > .05; unpaired Student’s t test). DA peak amplitude of DA release in the slices of sham-operated rats versus slices from 6-OHDA plus 3 days of l-dopa treatment (3 days; 0.099 ± 0.023 nA, t15 = 9.98, ***P <.001, unpaired Student’s t test) as well as from non dyskinetic (15 days non dyskinetic; 0.109 ± 0.022 nA, t12 = 8.57, ***P < .001, unpaired Student’s t test) and from dyskinetic rats (15 days dyskinetic; 0.127 ± 0.021 nA, t13 = 9.021, ***P < .001, unpaired Student’s t test; 6-OHDA, t13 = 2.76, vs 3 days, t10 = 3.67, vs non dyskinetic, t11 = 4.071, vs dyskinetic, #P < .05, ## P < .01, unpaired Student’s t test). (C) Histogram of the different time to onset of SSD in sham-operated rats and in 6-OHDA rats treated with l-dopa for 3 or 15 days (dyskinetic and non dyskinetic; sham vs dyskinetic, t25 = 5.32, ***P < .001; non dyskinetic vs dyskinetic, t19 = 3.22, **P < .01, unpaired Student’s t test). (D) TH-immunostaining in coronal section of the substantia nigra pars compacta (SNc) region of dyskinetic and non dyskinetic 6-OHDA-lesioned rats treated with l-dopa (2x objective, scale bar 500 μm). (E) The graph shows the massive loss of dopaminergic neurons in ipsilateral SNc compared with the contralateral side (****P = .0001) both in dyskinetic and non dyskinetic 6-OHDA-lesioned rats. Ipsi, ipsilateral; contra, contralateral.

Similar articles

Cited by

References

    1. Leao AA, Morrison RS. Propagation of spreading cortical depression. J Neurophysiol 1945;8:33–45.
    1. Eikermann-Haerter K, Yuzawa I, Qin T, et al. Enhanced subcortical spreading depression in familial hemiplegic migraine type 1 mutant mice. J Neurosci 2011;31(15):5755–5763. - PMC - PubMed
    1. Ayata C, Lauritzen M. Spreading depression, spreading depolarizations, and the cerebral vasculature. Physiol Rev 2015;95(3): 953–993. - PMC - PubMed
    1. Pietrobon D, Moskowitz MA. Chaos and commotion in the wake of cortical spreading depression and spreading depolarizations. Nat Rev Neurosci 2014;15(6):379–393. - PubMed
    1. Mayevsky A, Doron A, Manor T, Meilin S, Zarchin N, Ouaknine GE. Cortical spreading depression recorded from the human brain using a multiparametric monitoring system. Brain Res 1996;740(1-2):268–274. - PubMed

Publication types

MeSH terms

Supplementary concepts