. 2019 Feb 12;26(7):1747-1758.e5.
doi: 10.1016/j.celrep.2019.01.078.

Hypothalamic Control of Conspecific Self-Defense

Affiliations

Hypothalamic Control of Conspecific Self-Defense

Li Wang et al. Cell Rep. .

Abstract

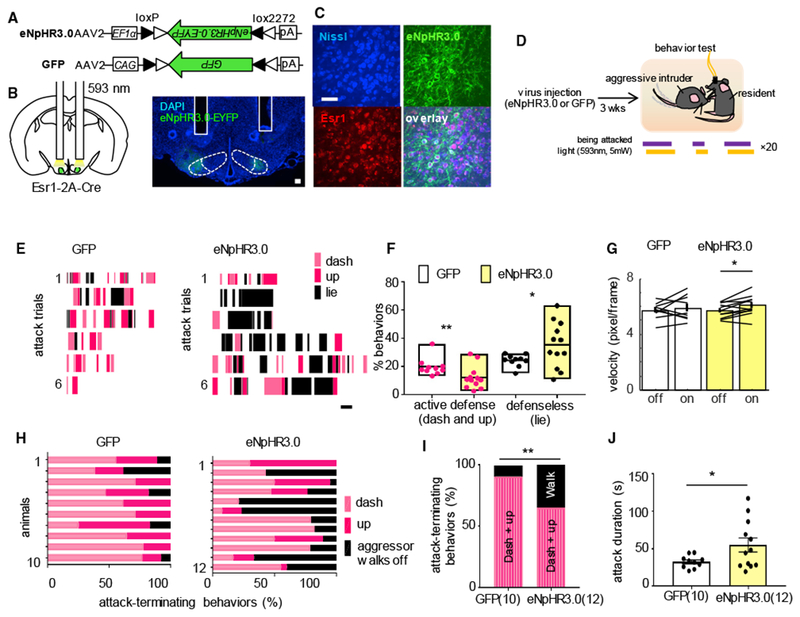
Active defense against a conspecific aggressor is essential for survival. Previous studies revealed strong c-Fos expression in the ventrolateral part of the ventromedial hypothalamus (VMHvl) in defeated animals. Here, we examined the functional relevance and in vivo responses of the VMHvl during conspecific defense. We found that VMHvl cells expressing estrogen receptor α (Esr1) are acutely excited during active conspecific defense. Optogenetic inhibition of the cells compromised an animal's ability to actively defend against an aggressor, whereas activating the cells elicited defense-like behaviors. Furthermore, the VMHvl is known for its role in aggression. In vivo recording and c-Fos mapping revealed differential organization of the defense and aggression-responsive cells in the VMHvl. Specifically, defense-activated cells are concentrated in the anterior part of the VMHvl, which preferentially targets the periaqueductal gray (PAG). Thus, our study identified an essential neural substrate for active conspecific defense and expanded the function of the VMHvl.

Keywords: aggression; estrogen receptor alpha; neural circuit; self-defense; ventromedial hypothalamus.


Conflict of interest statement

DECLARATION OF INTERESTS

The authors declare no competing interests.

Figures

Figure 1.
Figure 1.. The Anterior VMHvl Expresses a High Level of c-Fos after Social Defeat
(A) From top to bottom showing the representative images and number of c-Fos-expressing cells in the VMHvl of C57BL/6 male mice after no social interaction, attacking a BALB/c male intruder, attacking a non-aggressive C57BL/6 male intruder, being defeated by an aggressive C57BL/6 intruder, and being defeated by a SW intruder. Left column shows test conditions. Middle panels show c-Fos expression in the VMHvl (bregma: −1.4 to −1.9 mm) from representative animals. Right panels show the average number of c-Fos+ cells per 50 μM section in the VMHvl (bregma: −1.4 to −1.9 mm) after various test conditions. One-way ANOVA with repeated measures followed by pairwise comparison with Bonferroni correction: F(5, 30) = 0.478, p = 0.78923, n = 4–6 animals for each group. Scale bar: 100 μM. (B) Comparison of the number of c-Fos+ cells across test conditions in the sections from anterior VMHvl (bregma: −1.4 mm to −1.5 mm). (C) Comparison of the number of c-Fos+ cells across test conditions in the sections from the posterior VMHvl (bregma: −1.6 mm to −1.9 mm). One-way ANOVA followed by pairwise comparison with Tukey HSD correction. (D) Image showing the expression of defeat-induced c-Fos (green), Esr1 (magenta) and their overlay in the aVMHvl. Bottom: enlarged view of the boxed area. Top and bottom scale bars: 100 and 50 μM. (E) Left: the percentage of c-Fos and Esr1 double positive cells in all c-Fos+ cells (solid lines) and the percentage of Esr1+ cells in DAPI stained cells (chance level) across the anterior-posterior VMHvl. Right: the overlap between defeat- or attack-induced c-Fos and Esr1 in the entire VMHvl is significantly higher than the chance level. One-way ANOVA followed by pairwise comparison with Tukey HSD correction. (A) One way ANOVA with repeated measures. First row: F(5, 30) = 0.478, p = 0.78923, n = 6 animals. Second row: F(5, 18) = 1.889, p = 0.41561, n = 4 animals. Third row: F(5, 18) = 2.915, p = 0.04929, n = 4 animals; Post-hoc pairwise comparison with Bonferroni correction: All pairs, p > 0.05. Fourth row: F(5,30) = 13.752, p = 1.67 ×10⁻⁶, n = 6 animals. Post-hoc pairwise comparison with Bonferroni correction: −1.4 vs. −1.9 and −1.5 vs. −1.9, p < 0.05. All other pairs, p > 0.05. Fifth row: F(5,24) = 17.75, p = 9.54 ×10⁻⁷, n = 5 animals. Post-hoc pairwise comparison with Bonferroni correction: −1.4 vs. −1.8, −1.4 vs. −1.9, −1.5 vs. −1.8, −1.5 vs. −1.9 and −1.7 vs. −1.9, p < 0.05. All other pairs, p > 0.05. (B) One-way ANOVA: F(4, 20) = 22.55, p = 3.56 × 10⁻⁷, n = 4–6 animals for each group. Post hoc pairwise comparison with Tukey HSD correction: alone versus attack Balb/c, alone versus defeated by C57BL/6, alone versus defeated by SW, attack C57BL/6 versus defeated by C57BL/6, and attack C57BL/6 versus defeated by SW, p < 0.01. Attack Balb/c versus defeated by C57BL/6 and attack Balb/c versus defeated by SW, p < 0.05. All other pairs, p > 0.05. (C) One-way ANOVA: F(4, 20) = 6.61, p = 0.0015, n = 4–6 animals for each group. Post hoc pairwise comparison with Tukey HSD correction: alone versus defeated by C57BL/6 and alone versus defeated by SW, p < 0.01. Alone versus attack Balb/c, p < 0.05. All other pairs, p > 0.05. (E) One-way ANOVA: F(2, 21) = 11.63, p = 0.0004, n = 5–11 animals for each group. Post hoc pairwise comparison with Tukey HSD correction: chance level versus proportion of c-Fos and Esr1 double-positive cells in c-Fos+ cells in each test condition (attack or defeated), p < 0.01. Attack versus defeated, p > 0.05. Error bars represent SEM. *p < 0.05, **p < 0.01. See also Figure S1.
Figure 2.
Figure 2.. In Vivo Population Recording of the VMHvl Esr1+ Cells during Aggression and Conspecific Defense
(A) Schematics of the dual optical recording setup and experimental schedule. (B) Viral construct and implantation locations. (C) Top row: representative images showing the optic fiber tracks right above the aVMHvl (left) and pVMHvl (right). Blue: DAPI staining. Bottom row: Esr1 (red), GCaMP6f (green), and their overlay. Scale bars: 100 μm. (D) Representative traces of the Z-scored normalized GCaMP6 signal from the aVMHvl (black) and pVMHvl (red) during aggressor encounters. Color shades indicate behavioral events. (E) aVMHvl shows higher average ΔF/F change over baseline in the presence of an aggressor versus a non-aggressor. pVMHvl shows the opposite pattern. Paired t test. aVMHvl: t(5) = −3.47, p = 0.018. pVMHvl: t(5) = 3.94, p = 0.011. Student’s t test. aVMHvl: with non-aggressor, t(5) = 2.56, p = 0.051; with aggressor, t(5) = 3.83, p = 0.012; pVMHvl: with non-aggressor, t(5) = 5.45, p = 0.0028; with aggressor, t(5) = 3.00, p = 0.030. *p < 0.05. (F) Heatmaps showing the Z-scored GCaMP6f post-stimulus histograms (PSTHs) aligned to various behaviors at aVMHvl (top) and pVMHvl (bottom) of individual animals. Only 4 of 6 recorded animals showed attack. (G) Averaged PSTHs of the Z-scored GCaMP6f signal aligned to various behaviors of all animals. Shades represent ± SEM. (H) Comparing averaged GCaMP6 responses of aVMHvl and pVMHvl during various social behaviors. Paired t-test. Sniff non-aggressor: t(5) = −2.26, p = 0.073; attack: t(3) = −0.83, p = 0.47; sniff aggressor: t(5)= −2.61, p = 0.047; defend: t(5) = 3.06, p = 0.028; dash: t(5) = 3.31, p = 0.021; upright: t(5) = 1.50, p = 0.19; freeze: t(5) = 2.14, p = 0.085. *p < 0.05. (I) Relative GCaMP6f responses during various social behaviors in the aVMHvl (black) and pVMHvl (red). One-way ANOVA. p < 0.001 for both aVMHvl and pVMHvl. Pairwise comparison with Tukey-Kramer correction. Left: F(6, 33) = 5.57, p = 0.0004. Right: F(6, 33) = 6.45, p = 0.0001. Pairwise comparison with Tukey-Kramer correction. Left: defend versus sniff non-aggressor, p < 0.05; defend versus sniff aggressor, p < 0.05; defend versus up, p < 0.05; defend versus freeze, p < 0.05. Right: attack versus freeze, p < 0.05; attack versus up, p < 0.05; attack versus dash, p < 0.05; sniff aggress or versus freeze, p < 0.05; sniff non-aggressor versus freeze, p < 0.05. All other pairs, p > 0.05. *p < 0.05. Error bars ± SEM. See also Figures S2–S4.
Figure 3.
Figure 3.. Optogenetic Inhibition of the VMHvl Esr1+ Cells Suppresses Active Defense against Aggressors
(A) Viral constructs. (B) Implantation schematics and an image showing the bilateral cannula tracks (white lines) and eNpHR3.0-EYFP expression (green). Blue: DAPI staining. Scale bar: 100 μm. (c) Images showing overlay between eNpHR3.0-EYFP (green) and Esr1 (red) in the VMHvl. Blue: Nissl staining. Scale bar: 50 μm. (D) Experimental schedule. (E) Raster plots showing the behaviors of representative GFP (left) and eNpHR3.0 (right) mice when they were being attacked. Scale bar: 1 s. (F) Percentage of time animals showed active defensiveness (dash and up) and defenselessness (lying) during the agonistic interaction with the aggressor. Wilcoxon rank-sum test, dash and up, p = 0.0092. Unpaired t test, lie, p = 0.043, n = 10 animals for the GFP group, n = 12 animals for the eNpHR3.0 group. Left: rank-sum test, **p < 0.01. Right: unpaired t test, *p < 0.05. (G) Movement velocity during light-on and light-off periods when GFP and eNpHR3.0 mice were alone in the cage. Paired t test, p = 0.48, n = 10 animals for the GFP group, and p = 0.013, n = 12 animals for the eNpHR3.0 group. *p < 0.05. (H) Behaviors that terminated episodes of attack in GFP and eNpHR3.0 animals. (I) Average percentage of attacks that ended with the aggressor walking away versus the test animals dashing away or rearing up. Wilcoxon rank-sum test, p = 0.0085, n = 10 animals for the GFP group, n = 12 animals for the eNpHR3.0 group. *p < 0.05. (J) Average duration of attack episodes, which presumably reflects how effective the test mice can terminate attacks. Unpaired t test, p = 0.0374, n = 10 animals for the GFP group, n = 12 animals for the eNpHR3.0 group. *p < 0.05.
Figure 4.
Figure 4.. Optogenetic Activation of VMHvl Esr1+ Cells Elicits Defensive Behaviors
(A) Virus construct and dual cannula placement. (B) Cannula track and expression of ChR2-EYFP in the VMHvl. Scale bar: 100 μm. (C) Images showing overlap between Esr1 (red) and ChR2-EYFP (green). Blue: Nissl staining. Scale bar: 50 μm. (D) Experimental schedule. (E) Raster plots from two example animals. One showed light-induced attack and defensive behaviors (left), and the other showed only light-induced defensive behaviors (right). Scale bar: 10 s. (F) Accumulated probability of attack from 60 s before light onset to light offset. Time 0 indicates light onset. (G) Percentage of upright posture (left) and latency to upright posture (right) for light-induced attackers versus non-attackers. Left: p = 0.0036, n = 8 animals for the attacker group; p = 0.0029, n= 12 for non-attacker group. Right: p = 0.0002, n = 8 animals for the attacker group; p= 1.63 × 10⁻⁵, n = 12 for non-attacker group. (H) Percentage of trials that animals dashed (left) and latency to dash (right) for light-induced attackers versus non-attackers. Left: p = 0.0068, n = 8 animals for the attacker group; p = 1.05 × 10⁻⁵, n = 12 for non-attacker group. Right: p = 0.011, n = 8 animals for the attacker group; p = 7.74 × 10⁻⁵, n = 12 for non-attacker group. (I) Images showing light stimulation-induced c-Fos (red) in the VMHvl. Scale bar: 100 μm. (J) Total number of c-Fos-expressing cells in the VMHvl of the light-stimulated side versus the unstimulated side. p = 3.39 × 10⁻⁵, n = 17 animals. (K) Distribution of the number of light-induced c-Fos+ cells in the anterior versus posterior VMHvl. Purple dots indicate light-induced attackers. Paired t test in (G), (H), and (J). *p < 0.05, **p < 0.01, ***p < 0.001. Error bars ± SEM. See also Figure S5.
Figure 5.
Figure 5.. Differential Projection Patterns of the Anterior VMHvl and Posterior VMHvl Esr1+ Cells
(A) Viral construct and experimental schematics. (B) Left column shows the targeted brain structures indicated by red dashed lines. Right column shows example images containing the injection sites that are marked by the co-injected fluorescent microsphere (red arrows). (C) Example images showing retrogradely labeled cells in the aVMHvl and pVMHvl. (D) Percentage of anterior VMHvl (A) and posterior VMHvl (P) Esr1+ populations that are retrogradely labeled after targeting various brain regions. LS: p = 0.0045, n = 8 animals; MPOA: p = 0.0023, n = 5 animals; AHN: p = 0.4204, n = 7 animals; PVN: p = 0.0175, n = 4 animals; rPAG: p = 0.0223, n = 6 animals; cPAG: p = 0.0451, n = 8 animals. LS, lateral septum; MPOA, medial preoptic area; AHN, anterior hypothalamic nucleus; PVN, paraventricular nucleus of hypothalamus; rPAG and cPAG, rostral and caudal periaqueductal gray. All scale bars: 100 μm. Paired t test, *p < 0.05, **p < 0.01. See also Figure S6.

References

    1. Adams DB (1968). Cells related to fighting behavior recorded from midbrain central gray neuropil of cat. Science 159, 894–896. - PubMed
    1. Adams DB, Boudreau W, Cowan CW, Kokonowski C, Oberteuffer K, and Yohay K (1993). Offense produced by chemical stimulation of the anterior hypothalamus of the rat. Physiol. Behav 53, 1127–1132. - PubMed
    1. Biro L, Sipos E, Bruzsik B, Farkas I, Zelena D, Balazsfi D, Toth M, and Haller J (2018). Task division within the prefrontal cortex: distinct neuron populations selectively control different aspects of aggressive behavior via the hypothalamus. J. Neurosci 38, 4065–4075. - PMC - PubMed
    1. Blanchard RJ, and Blanchard DC (1989). Attack and defense in rodents as ethoexperimental models for the study of emotion. Prog. Neuropsychopharmacol. Biol. Psychiatry 13 (Suppl), S3–S14. - PubMed
    1. Blanchard RJ, O’Donnell V, and Blanchard DC (1979). Attack and defensive behaviors in the albino mouse. Aggress. Behav 5, 341–352.

Publication types

LinkOut - more resources