. 2019 Feb 12;26(7):1880-1892.e6.
doi: 10.1016/j.celrep.2019.01.072.

Diurnal Rhythms Spatially and Temporally Organize Autophagy

Affiliations

Diurnal Rhythms Spatially and Temporally Organize Autophagy

Mikhail Ryzhikov et al. Cell Rep. .

Abstract

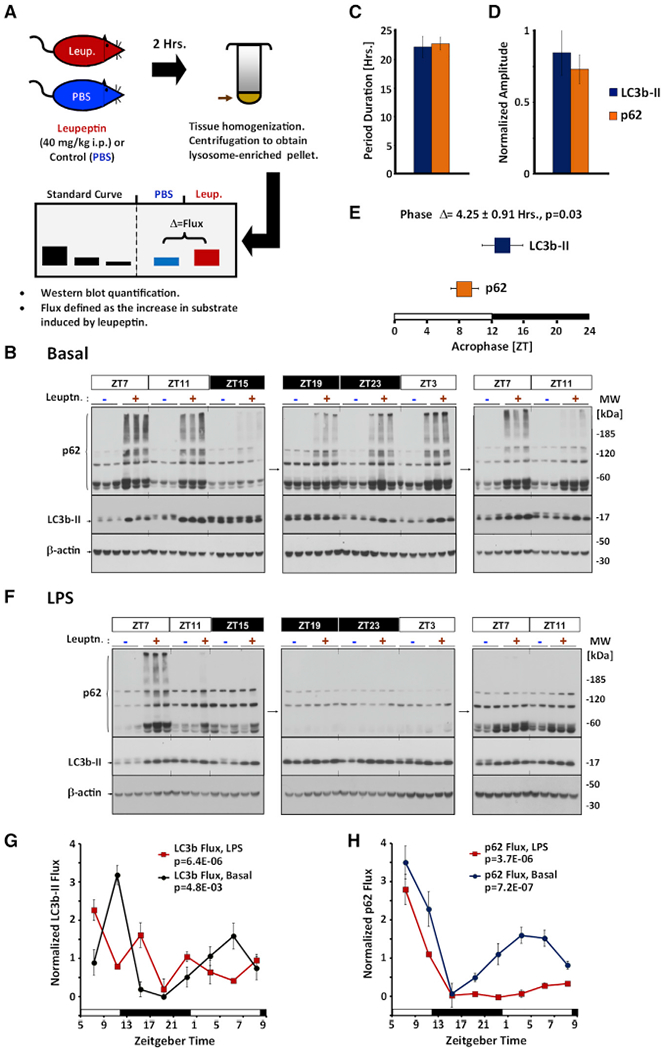
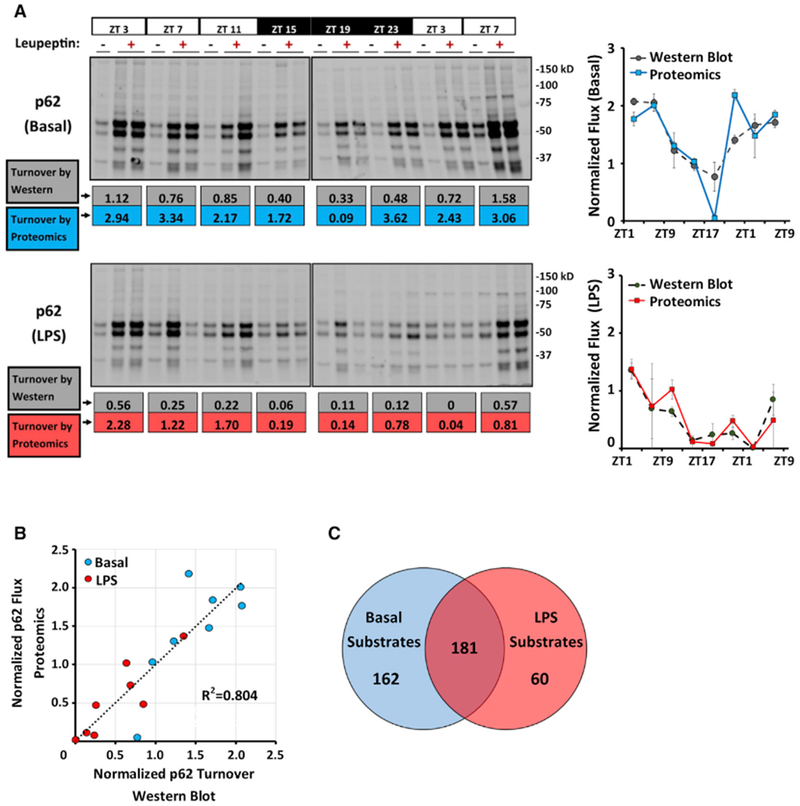
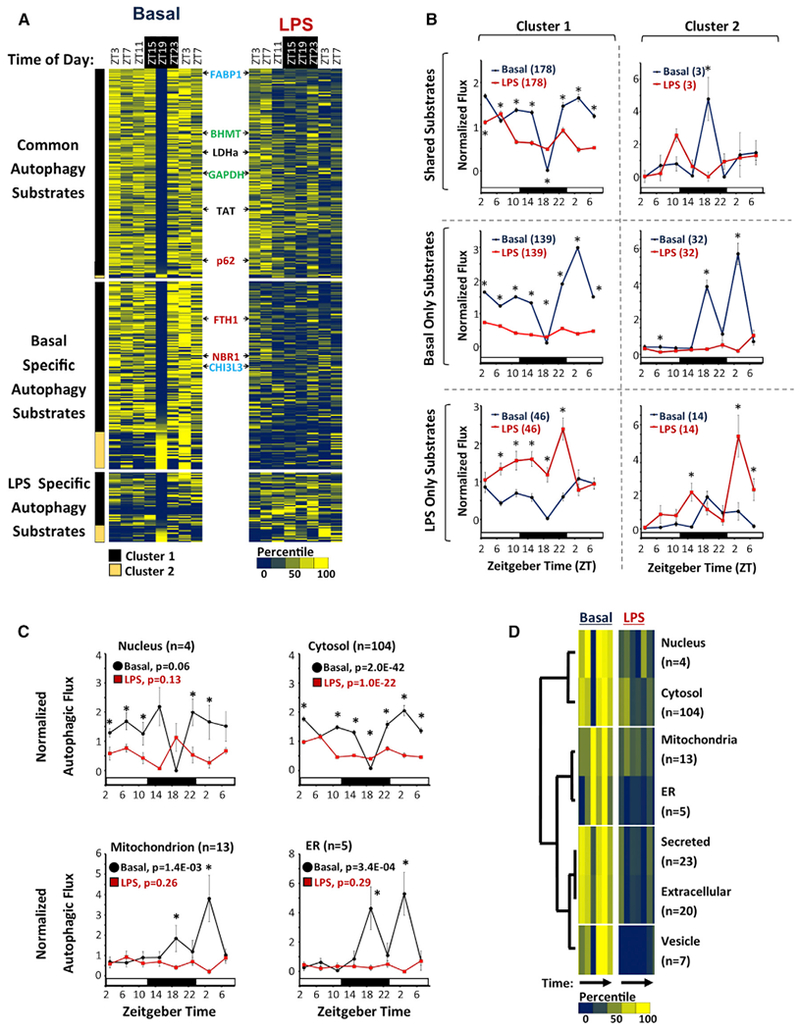
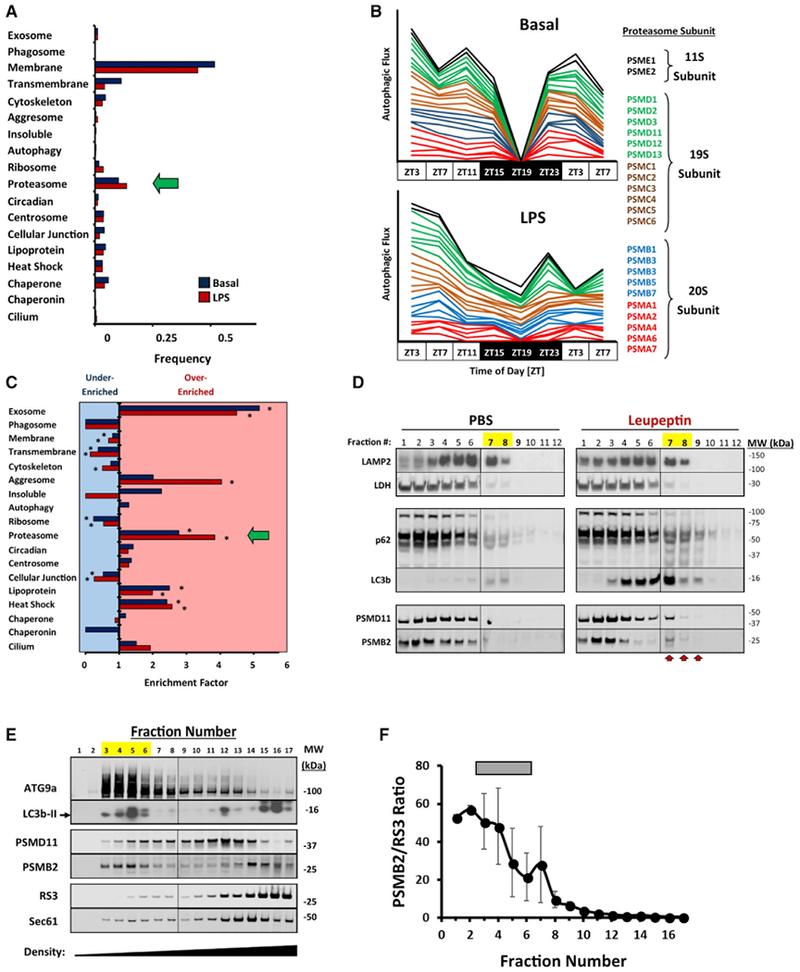
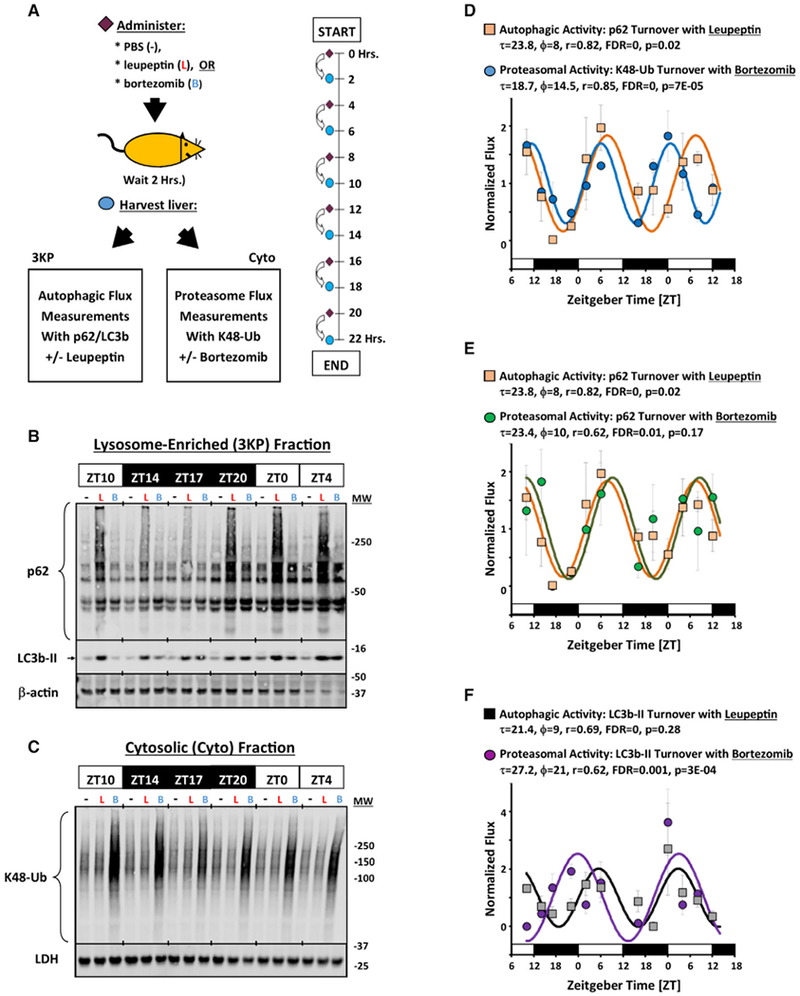
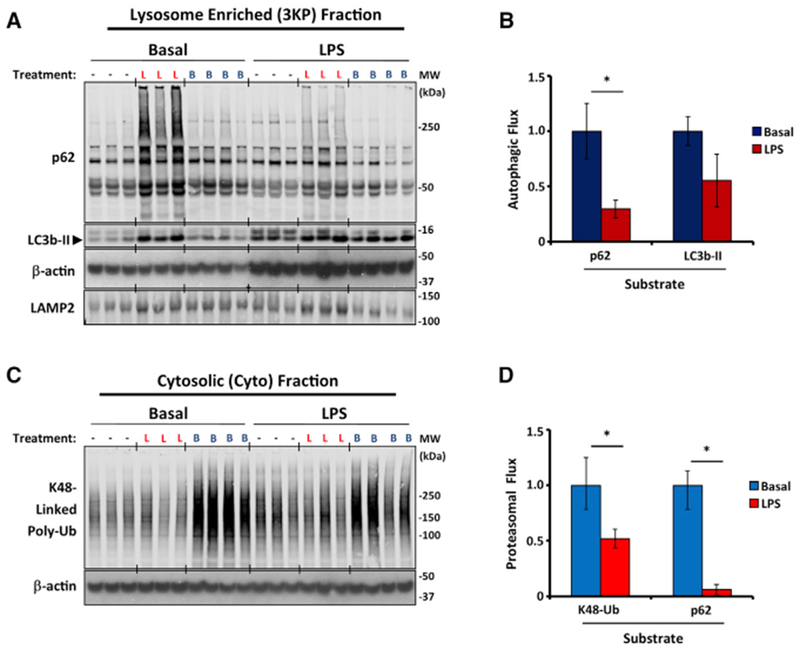
Circadian rhythms are a hallmark of physiology, but how such daily rhythms organize cellular catabolism is poorly understood. Here, we used proteomics to map daily oscillations in autophagic flux in mouse liver and related these rhythms to proteasome activity. We also explored how systemic inflammation affects the temporal structure of autophagy. Our data identified a globally harmonized rhythm for basal macroautophagy, chaperone-mediated autophagy, and proteasomal activity, which concentrates liver proteolysis during the daytime. Basal autophagy rhythms could be resolved into two antiphase clusters that were distinguished by the subcellular location of targeted proteins. Inflammation induced by lipopolysaccharide reprogrammed autophagic flux away from a temporal pattern that favors cytosolic targets and toward the turnover of mitochondrial targets. Our data detail how daily biological rhythms connect the temporal, spatial, and metabolic aspects of protein catabolism.

Keywords: autophagy; chaperone-mediated autophagy; circadian rhythm; clock; endotoxin; inflammation; lipopolysaccharide; macroautophagy; proteasome.


Conflict of interest statement

DECLARATION OF INTERESTS

A.M.K.C. is a cofounder, stock holder, and serves on the Scientific Advisory Board for Proterris, which develops therapeutic uses for carbon monoxide. A.M.K.C. also has a use patent on CO. A.M.K.C. served as a consultant for Teva Pharmaceuticals in July 2018.

Figures

Figure 1.
Figure 1.. Circadian Characteristics of Macroautophagic Flux in Basal Mouse Liver
(A) Cartoon depicting protocol for measuring macroautophagic flux. (B) Representative time series analysis of circadian rhythms in macroautophagy in basal mouse liver. Tiled images are representative western blots against p62 (top), LC3b-II (middle), and β-actin (bottom). Standards are shown to the left, and molecular weight markers (in kilodaltons) are depicted to the right of the images. Each lane represents lysosome-enriched protein fractions isolated from 126 μg of total liver homogenate (12 μL or 6% of the total fraction). Times of tissue harvest are depicted in units of zeitgeber time (ZT), where ZT0 represents lights on (6:00 a.m. local time) and ZT12 represents lights off (6:00 p.m. local time). Collection times that occurred during subjective night are highlighted in black. −, PBS control-injected animals; +, leupeptin-injected animals. (C–E) Circadian rhythm parameter analysis of basal macroautophagic flux in mouse liver using LC3b-II (blue bars) and p62 (orange bars) as markers. (C and D) Period duration (C) and amplitude (D) expressed as a fraction of the mean (mean ± SE, n = 6). (E) Acrophase (mean ± SE, n = 6). The average phase difference ± SE between LC3b-II and p62 turnover is indicated above the graph (n = 6). The p value reflects the likelihood that the phase difference between LC3b-II and p62 acrophases is zero. (F) Western blots depicting macroautophagic flux in livers of LPS-treated mice (12 mg/kg i.p. dose given at ZT5). Each lane represents lysosome-enriched fractions isolated from 126 μg of total liver homogenate (12 μL or 6%of the total fraction) (see STAR Methods). −, PBS control-injected animals; +, leupeptin-injected animals. Data are representative of 4 independent experiments. (G and H) Quantification of macroautophagic flux using LC3b-II turnover (G) or p62 turnover (H) as a marker of macroautophagic activity (mean ± SE, n = 3 flux measurements). The p values derived by one-way ANOVA are provided in the graph. Also see Figure S1.
Figure 2.
Figure 2.. A Proteomics-Based Approach to Measuring Autophagic Flux
(A) Western blots depicting p62 turnover in samples used for label-free proteomics analysis (see STAR Methods). Each lane represents 12 μL or 6% of the total fraction (see STAR Methods). Top, basal livers. Bottom, LPS (12 mg/kg given at ZT1). Below each blot, p62 turnover is calculated using either densitometry from western blotting (in units of picomoles of p62 per milligram of total protein per hour, gray values), or using FCSs obtained from proteomics (blue values for basal and red values for LPS). These data are depicted graphically in normalized form to the right of the blots. See also Figure S2A. (B) Correlation between proteomics-based and western blot-based estimates of macroautophagic flux using p62 turnover as a marker. Datapoints represent the mean of 2 turnover measurements obtained at various times of day. Blue circles, basal livers; red circles, LPS-treated mice. (C) Macroautophagy substrates identified in our proteomics time series analysis using an FDR cutoff of <5% (see STAR Methods). See also Data S1 and S2.
Figure 3.
Figure 3.. Circadian Analysis of the Liver Autophagic Flux
(A) Heatmap depicting autophagic flux in mouse liver as a function of time of day and treatment (basal versus LPS). FCS values were normalized and then expressed as a percentile from the mean, with dark blue representing low turnover and yellow representing high turnover. Substrates are grouped based on whether turnover was detected in both basal and LPS-treated livers (n = 181), basal alone (n = 162), or LPS alone (n = 60). The substrates are further subdivided into 2 clusters, based on whether they have a nadir in turnover at ZT19 (cluster 1, black bar, n = 308) or not (cluster 2, light brown bar, n = 35). The positions of known selective autophagy, bulk autophagy, and chaperone-mediated autophagy (CMA) substrates are depicted in red, black, and green text, respectively. The positions of FABP1 and CHI3L3 are noted in blue text. (B) Circadian rhythms in mean normalized autophagic flux ± SE for different groups of substrates. Black circles, basal livers; red squares, LPS-treated livers. Sample sizes are specified in parentheses. **p < 0.05 basal versus LPS (Student’s two-tailed t test). (C) Normalized autophagic flux (mean ± SE) for basal autophagy substrates with UNIPROT annotations exclusive for the nucleus (n = 4), cytosol (n = 104), mitochondria (n = 13), and ER (n = 5). Black circles, basal livers; red squares, LPS-treated livers. The p values calculated by one-way ANOVA are provided. *p < 0.05 basal versus LPS (Student’s two-tailed t test). (D) Hierarchal clustering analysis of autophagic flux mapping to specific subcellular compartments. Colored bars represent a heatmap of autophagic flux as a function of time of day in basal and LPS-treated livers. Low flux, dark blue bars; high flux, bright yellow bars. Sample sizes are depicted to the right. See also Figures S3 and S4 and Data S1.
Figure 4.
Figure 4.. The Proteasome Is a Selective Target of Autophagy
(A) Frequency of selected UNIPROT annotation terms in the basal (blue bars, n = 343) and LPS-associated (red bars, n = 241) autophagy substrate proteome. The annotation for proteasomes is marked by a green arrow. (B) Stacked line graphs depicting the time structure of proteasome subunit turnover via autophagy (n = 24). Top graph, basal livers. Bottom graph, LPS-treated livers. As a visual aid, turnover profiles for 11S regulatory subunits are black, those for 19S subunits are green and brown, and those for 20S subunits are blue and red. (C) Enrichment analysis for the UNIPROT annotation terms depicted in (A). Bars pointed to the right denote over-enrichment, and bars pointed to the left denote under-enrichment. See Data S4 for a tabular presentation of these data. *p < 0.05 (χ2 contingency table analysis). (D) Western blot depicting subcellular fractionation of total liver protein using Nycodenz density gradient centrifugation (see STAR Methods). LAMP2 and LDH are provided as lysosomal and cytosolic markers, respectively. Higher fraction numbers denote increasing density. Left, sham (PBS)-treated mice. Right, leupeptin-treated mice. High-density fractions containing autophagic substrates are denoted by arrows and yellow highlights. Data are representative of 3 independent analyses. (E) Western blots of mouse liver ER separated by OptiPrep density ultracentrifugation (see STAR Methods). Peak fractions for ATG9a and LC3b-II are highlighted yellow. Sec61 is provided as an ER marker. Data are representative of 3 independent analyses. (F) Mean proteasome enrichment relative to ribosomes ± SE (n = 3), as reflected by PSMB2/RS3 ratios. Peak fractions for ATG9a and LC3b-II are denoted by a gray bar.
Figure 5.
Figure 5.. Diurnal Rhythms in Autophagic and Proteasomal Activity
(A) Protocol for parallel time series analyses of autophagic and proteasomal flux. See STAR Methods and Figure S7A for descriptions of sample preparation. (B and C) Representative western blots of p62 and LC3b-II in the lysosome-enriched (3KP) fraction (B) and Lys48-linked polyubiquitin (K48-Ub) chains in the Cyto fraction (C). β-actin and LDH are shown as loading controls (B and C, respectively). For (B), each lane represents 12 μL of the 3KP fraction pooled from n = 3–4 mice, representing the content obtained from 126 μg of total protein. For (C), each lane represents 19 μg of protein pooled from n = 3–4 mice. −, PBS-treated animals; L, leupeptin-treated animals; B, bortezomib-treated animals. (D–F) Quantification of circadian rhythms in autophagic and proteasomal flux in normal mouse liver using various markers (mean ± SE, n = 3–4 measurements). Data presented were concatenated from 2 independent time series experiments. For each set of data, a best fit cosine curve and rhythm parameters were generated using COSOPT and are listed in the graphs. Statistical significance was determined using one-way ANOVA. (D) Autophagic flux as measured by the increase in p62 with leupeptin in the 3KP fraction (orange squares), and proteasomal flux as measured by the increase in K48-Ub with bortezomib in the Cyto fraction (blue circles). (E) Autophagic flux as measured by the increase in p62 with leupeptin in the 3KP fraction (orange squares), and proteasomal flux as measured by the uptick in p62 content with bortezomib in the 3KP fraction (green circles). (F) Autophagic flux as measured by the increase in LC3b-II by leupeptin in the 3KP fraction (gray squares), and proteasomal flux as measured by the uptick in LC3b-II content with bortezomib in the 3KP fraction (purple circles). Also see Figures S5 and S6.
Figure 6.
Figure 6.. LPS Coordinately Represses Autophagic and Proteasomal Flux
(A and C) Western blot analysis of macroautophagic (A) and proteasomal flux (C) in liver homogenates from PBS-treated (basal) and LPS-treated mice (12 mg/kg LPS given at ZT3, 19 h before harvest). −, PBS-treated animals; L, leupeptin-treated animals; B, bortezomib-treated animals. Data are representative of 2 independent experiments. Each lane in (A) represents 3KP fraction protein (12 μL or 6% of the total fraction), and each lane of (C) represents 19 mg of cytosolic protein. (B and D) Quantification of macroautophagic (B) and proteasomal flux (D) using various markers depicted on the horizontal axis of each graph. Each bar represents the mean ± SE (n = 7 mice pooled from 2 independent experiments). To facilitate comparisons, data were normalized to results from basal mice. *p < 0.05 basal versus LPS (Student’s two-tailed t test).

Comment in

References

    1. Agarraberes FA, and Dice JF (2001). A molecular chaperone complex at the lysosomal membrane is required for protein translocation. J. Cell Sci 774, 2491–2499. - PubMed
    1. Asano S, Fukuda Y, Beck F, Aufderheide A, Förster F, Danev R, and Baumeister W (2015). Proteasomes. A molecular census of 26S proteasomes in intact neurons. Science 347, 439–442. - PubMed
    1. Axe EL, Walker SA, Manifava M, Chandra P, Roderick HL, Habermann A, Griffiths G, and Ktistakis NT (2008). Autophagosome formation from membrane compartments enriched in phosphatidylinositol 3-phosphate and dynamically connected to the endoplasmic reticulum. J. Cell Biol 182, 685–701. - PMC - PubMed
    1. Chittum HS, Lane WS, Carlson BA, Roller PP, Lung FD, Lee BJ, and Hatfield DL (1998). Rabbit beta-globin is extended beyond its UGA stop codon by multiple suppressions and translational reading gaps. Biochemistry 37, 10866–10870. - PubMed
    1. Cho H, Zhao X, Hatori M, Yu RT, Barish GD, Lam MT, Chong LW, DiTacchio L, Atkins AR, Glass CK, et al. (2012). Regulation of circadian behaviour and metabolism by REV-ERB-α and REV-ERB-β. Nature 485, 123–127. - PMC - PubMed

Publication types