. 2019 Feb 12;26(7):1951-1964.e8.
doi: 10.1016/j.celrep.2019.01.063.

PyMINEr Finds Gene and Autocrine-Paracrine Networks from Human Islet scRNA-Seq

Affiliations

PyMINEr Finds Gene and Autocrine-Paracrine Networks from Human Islet scRNA-Seq

Scott R Tyler et al. Cell Rep. .

Abstract

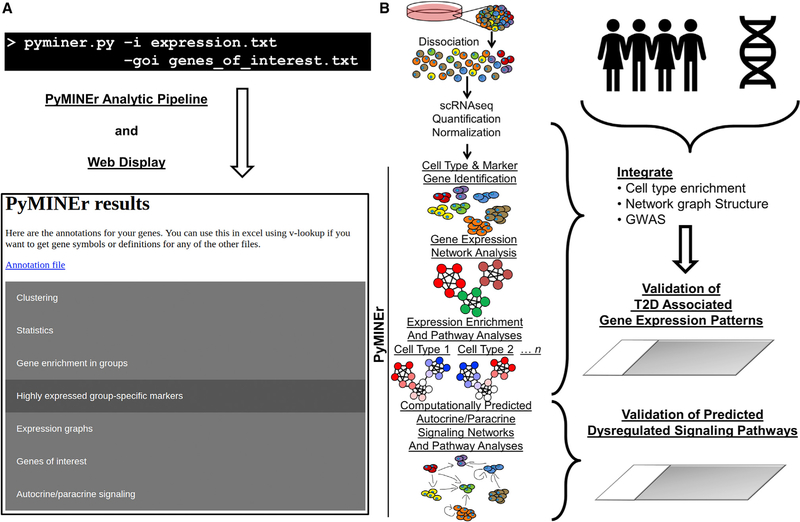
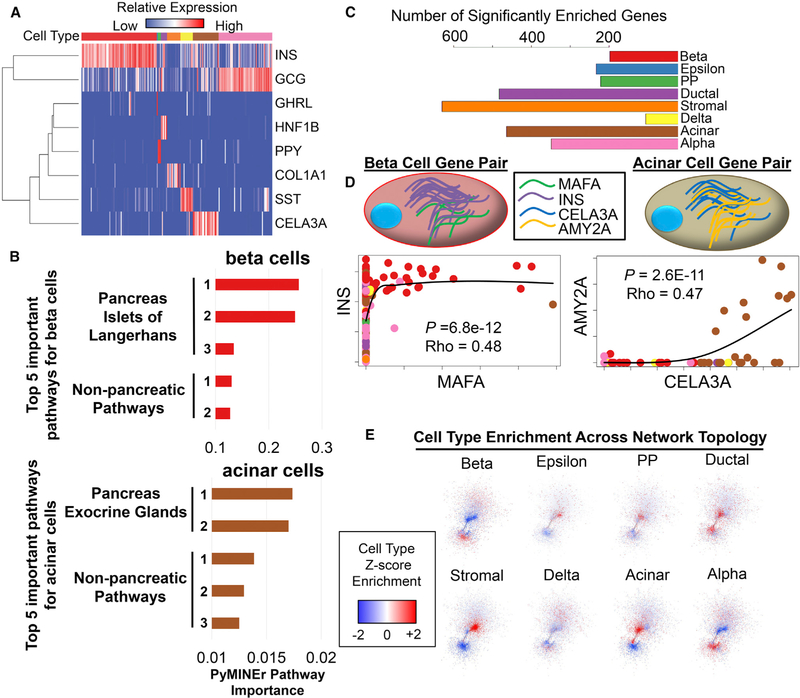
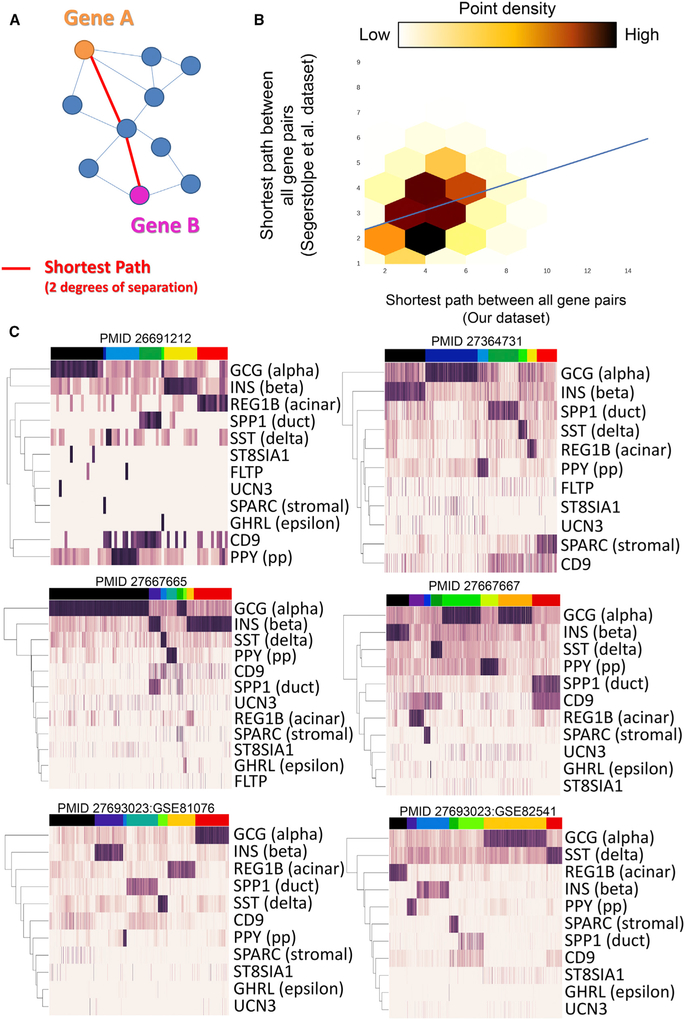
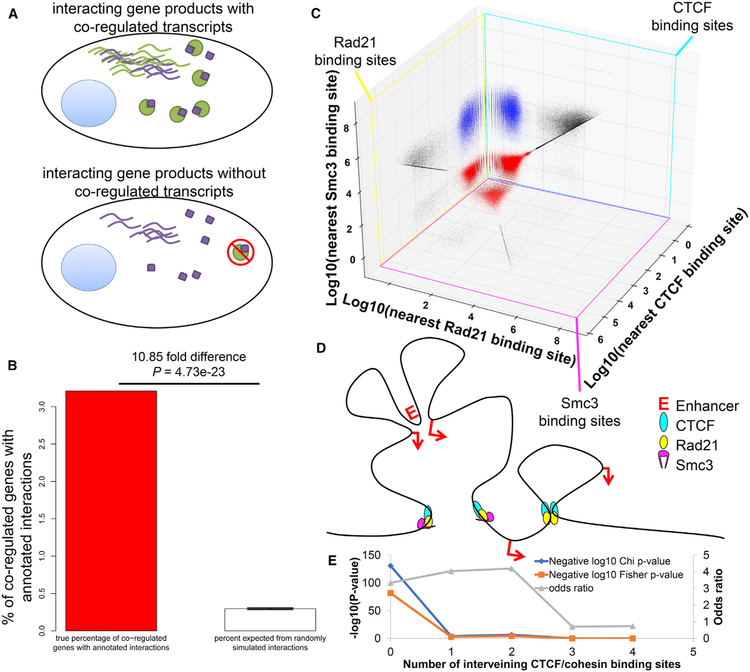
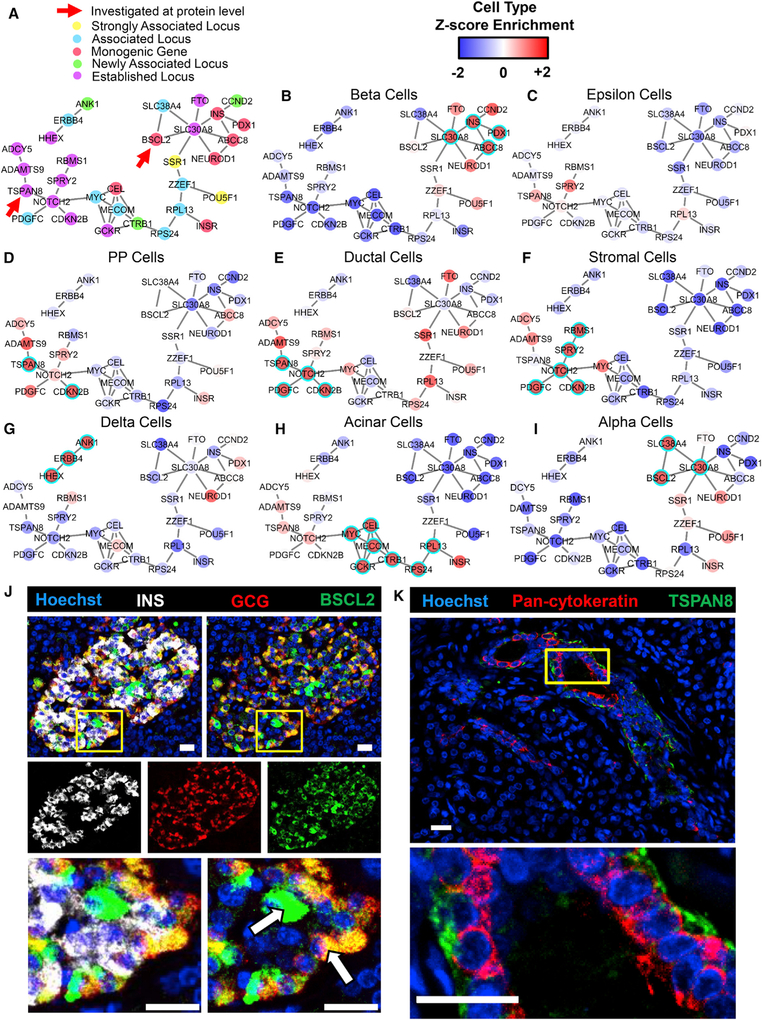
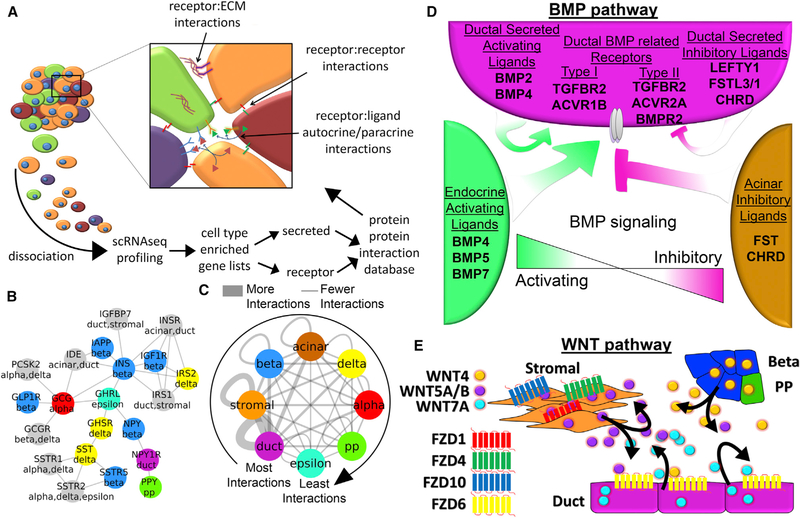
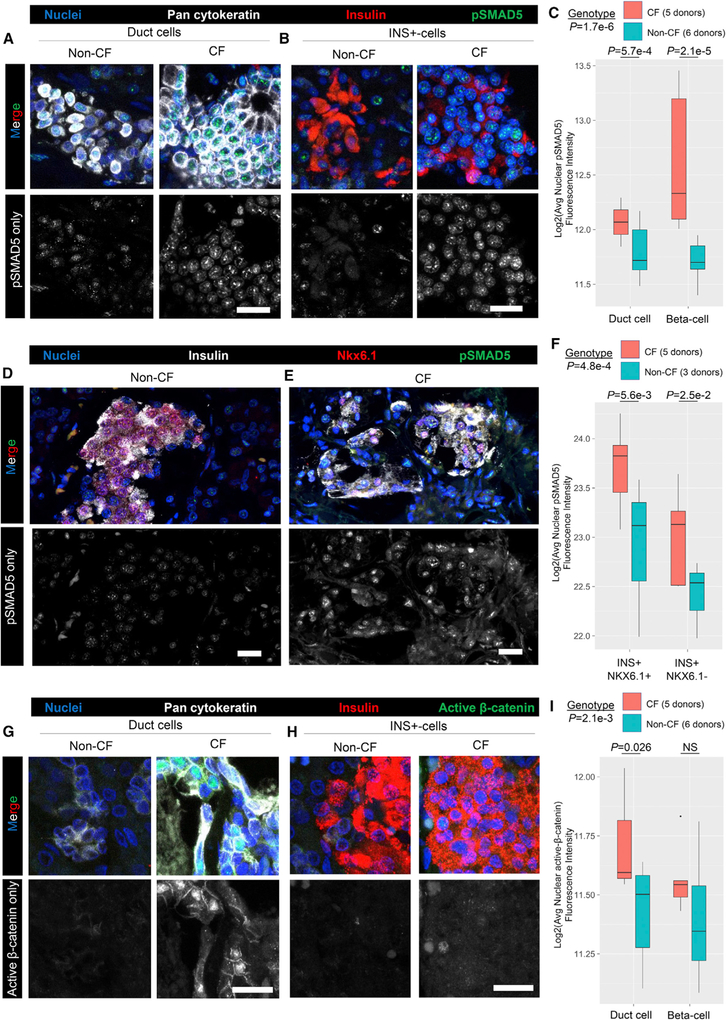
Toolsets available for in-depth analysis of scRNA-seq datasets by biologists with little informatics experience is limited. Here, we describe an informatics tool (PyMINEr) that fully automates cell type identification, cell type-specific pathway analyses, graph theory-based analysis of gene regulation, and detection of autocrine-paracrine signaling networks in silico. We applied PyMINEr to interrogate human pancreatic islet scRNA-seq datasets and discovered several features of co-expression graphs, including concordance of scRNA-seq-graph structure with both protein-protein interactions and 3D genomic architecture, association of high-connectivity and low-expression genes with cell type enrichment, and potential for the graph structure to clarify potential etiologies of enigmatic disease-associated variants. We further created a consensus co-expression network and autocrine-paracrine signaling networks within and across islet cell types from seven datasets. PyMINEr correctly identified changes in BMP-WNT signaling associated with cystic fibrosis pancreatic acinar cell loss. This proof-of-principle study demonstrates that the PyMINEr framework will be a valuable resource for scRNA-seq analyses.

Keywords: BMP; PyMINEr; WNT; autocrine-paracrine; cell type identification; cystic fibrosis; networks; pancreatic islets; single-cell RNA-seq; systems biology.


Conflict of interest statement

DECLARATION OF INTERESTS

The authors declare no conflicts of interest.

Figures

Figure 1.
Figure 1.. PyMINEr Pipeline and Implementation for scRNA-Seq
(A) An example command line input for running PyMINEr, for which the only required argument is the input file. If you have genes of interest however, this can also be provided. At the end of a PyMINEr run, an interactive html file organizing and describing the results is generated. (B) The PyMINEr analytic pipeline as utilized in this study. We used PyMINEr to analyze scRNA-seq, identify cell types, and generate expression graph networks integrated with Z score enrichment for each cell type. Integration of the graph structure and cell type enrichment analyses with GWAS data enabled the identification of several previously undescribed cell type-specific expression patterns for poorly described type 2 diabetes (T2D)-associated genes. The automated generation of autocrine and paracrine signaling networks through PyMINEr enabled confirmation of hypotheses predicted for the diseased human cystic fibrosis pancreas, where cellular compartments are remodeled. See STAR Methods and Figures S1–S3 for details regarding clustering methods and benchmarking.
Figure 2.
Figure 2.. Characterization of Human Pancreatic Islet scRNA-Seq Gene Enrichment and Network Graphs
(A) A heatmap of each cell type and an associated cell type marker. Cell types are color-coded along the top of the heatmap, with colors matching those in (C). (B) The top five Human Protein Atlas (HPA) pathways for beta cells (top, red) and acinar cells (bottom, brown). Importantly, integrated pathway analyses by PyMINEr correctly identified the human body part and sub-organ. (C) The number of genes enriched in each identified cell type as identified by PyMINEr. (D) Examples of expression relationships that give rise to the network model of transcription based on scRNA-seq data. Cell type-enriched genes (INS and MAFA in beta cells, CELA3A and AMY2A in acinar cells) are co-expressed in particular cell types. Points in the scatterplots correspond to the expression level of the indicated gene; the identity of the associated cell is indicated by the color of the point. Of particular note are beta cells (red) and acinar cells (brown); other cell types are color-coded as in (C). Black lines show locally estimated scatterplot smoothing (LOESS) of locally weighted regressions. Spearman correlation rho and p values are shown for gene-gene expression relationships for cell type-enriched genes. (E) Graphic representation of cell type Z score enrichment, illustrating differences in transcriptional networks across cell types. For most cell types, certain regions within the network showed transcriptional enrichment across the topology of the network.
Figure 3.
Figure 3.. Graph Structure Is Conserved across Human Islet scRNA-Seq Datasets from Different Laboratories
(A) A schematic example of the shortest path between two genes in a network. In this case, the shortest path between gene A and gene B is two, denoted by the red lines (i.e., A and B are 2 degrees of separation away from each other). (B) The correlation corresponding to overall network structure when comparing the network built by PyMINEr using our dataset and the dataset from Segerstolpe et al. (2016). The plot indicates the shortest path between all gene-gene pairs within each network. Linear regression is shown by the blue line. These results indicate that the overall structures of the two networks built by these two datasets are similar. Of note, our dataset contained fewer cells (185) sequenced at a higher depth (average reads per cell = 2,842,414; i.e., 1,421,207 paired-end fragments). This demonstrates that, with sufficient depth of sequence, network graphs can be generated with fewer cells. (C) Heatmaps of known and posited islet marker genes form the 6 additional datasets analyzed here. Full PyMINEr analyses for these datasets available at www.sciencescott.com/pancreatic-scrnaseq. See Figure S4 for notes regarding adjusting for variable power across datasets for constructing graph networks.
Figure 4.
Figure 4.. Graph Structure Is Related to Protein-Protein Interactions and CTCF-Cohesin Demarcations in the Genome
(A) Schematic illustration of the rationale for the experiment. Given that the two physically interacting proteins must be present within the same cell, it follows that the transcripts of these genes might be co-regulated. (B) Among co-regulated genes, the percentage of those known to interact (based on StringDB) is significantly higher than those in simulated random networks derived from a Monte Carlo random pairing of expressed genes to create equally long adjacency lists (p = 4.73e–23, n = 10 simulations, 2-sided 1-sample t test). This indicates that the co-regulatory network generated by PyMINEr can yield biologically meaningful results. (C) Log10 distances between the RAD21, CTCF, and SMC3 binding sites from each other. Each plane corresponds to the binding sites for the indicated transcription factor; the distance of that binding site from its nearest binding site for the other two factors is then noted in the scatterplot. Red points are positive for RAD21, CTCF, and SMC3, all within 150 bases of each other. Blue points represent loci that are bound by RAD21 and CTCF within 150 bases, but the nearest SMC3 binding site was over 150 bases away. Red and blue populations were used as insulator demarcations across the genome. (D) A schematic illustration of insulating CTCF-cohesin loci, which partition the genome into insulated domains. (E) We observed significant concordance between the co-expression graph from scRNA-seq and the graph representing the genes partitioned between n insulation sites (x axis). Interestingly, we also observed a modest enrichment for gene co-expression in gene-gene pairs separated by one or two insulating sites; however, this significance disappears in gene-gene pairs separated by three or four insulating sites. This evidence fits with the model of genome conformation manifest from CTCF-cohesin loop extrusion with optional stopping sites. This observation also indicates that, although the regulatory elements within a single insulated domain are strongest, there remains regulatory bleedover across insulation sites, likely because of stochastic CTCF binding site skipping during the process of loop extrusion (Sanborn et al., 2015). See Figure S5 and Table S4 for other notable properties of the graph structure as it pertains to cell type-specific gene expression patterns.
Figure 5.
Figure 5.. Cell Type-Specific Enrichment of T2D-Associated Genes
(A) A subset of the larger networks shown in Figure 2E focused on T2D-associated genes. The nature of the associations that were previously published is indicated by color (Morris et al., 2012). Gene associations newly discovered through the cited meta-analysis are denoted as “newly associated locus.” (B–I) The Z score enrichment of T2D-associated genes by cell type (from our dataset) are displayed over the two largest connected components of the T2D gene subset of the transcriptional network built by PyMINEr. As indicated, panels correspond to beta (B), epsilon (C), pancreatic polypeptide cells (D), ductal (E), stromal (F), delta (G), acinar (H), and alpha cells (I). Highly enriched genes are shown in red, whereas genes whose expression is low in the given cell type are shown in blue. If a gene passed the threshold for significant enrichment for the given cell type, then it is highlighted with a cyan ring. Table S2A lists cell type annotations for all T2D-associated genes, including those not shown here. (J) Immunofluorescence staining of a human pancreas section for glucagon (GCG; alpha cells, red), BSCL2 (green), and insulin (INS; beta cells, white) and counterstaining with Hoechst dye (nuclei, blue) (n = 5). Although many alpha cells were positive for BSCL2, we also observed expression in other islet cells (examples noted with arrows). (K) Representative immunofluorescence staining of a human pancreas section for pan-cytokeratin (highlights primarily the ductal epithelium, red) and TSPAN8 (green), with Hoechst counterstain of nuclei (blue) (n = 4). (J and K) Higher magnifications of the areas marked by yellow boxes are shown below the primary images. All scale bars represent 20 mm.
Figure 6.
Figure 6.. In silico Predicted Autocrine-Paracrine Signaling Networks Center around Developmental Pathways for Pancreatic Ductal Cells
(A) An overall schematic of the analytic pipeline incorporated in PyMINEr. Not shown but also included are gProfiler pathway analyses on all cell type interactions. The consensus 7 human pancreatic islet dataset was used for this analysis (available for download at https://www.sciencescott.com/pancreatic-scrnaseq). (B) A subset of the autocrine-paracrine signaling network found by PyMINEr containing pancreatic hormones and their receptors. Colors are indicative of the cell type producing the noted gene (gray indicates that it is produced by more than one cell type at appreciably high levels). (C) A network showing the number of predicted autocrine-paracrine interactions between all cell types from the human pancreatic islet datasets. (D) A schematic of the BMP pathway ligands and receptors as determined by PyMINEr. In brief, endocrine cell types tend to produce activating ligands, acinar cells tend to produce inhibitory ligands, and ductal cells produce a mixture of these proteins as well as activin and transforming growth factor (TGF) receptors (which can be activated by BMPs). (E) A schematic of the PyMINEr-predicted signaling by the WNT pathway ligands and receptors among ductal, stromal, beta, and PP cells. See Figure S6 for details regarding the pathway-ranking algorithm developed and implemented in PyMINEr.
Figure 7.
Figure 7.. Validation of Predicted Perturbations in Signaling Pathways within the Remodeled Cystic Fibrosis Pancreata
(A and B) Five cystic fibrosis (CF) and six non-CF human donors were evaluated by immunofluorescence for expression of phosphorylated-SMAD5 (pSMAD5) as an index for active BMP signaling. pSMAD5-only images are shown below the merged images. (A) Co-localization of pSMAD5 and pan-cytokeratin in ductal cells. (B) Co-localization of pSMAD5 and insulin in an islet. (C) Quantification of pSMAD5 expression in both pan-cytokeratin-positive ductal cells and insulin-positive islet cells (2-way ANOVA; genotype, p = 1.7e-6). pSMAD5 expression was significantly increased in both ductal and beta cells (Tukey HSD; ductal, p = 5.7e-4; beta, p = 2.1e-5). (D and E) Protein staining for insulin (white), Nkx6.1 (red), and pSMAD5 (green) verifies that there is elevated signaling in CF beta cells (E) relative to non-CF beta cells (D). (F) Quantification of cellular staining patterns in (D) and (E). (G and H) Staining for active beta-catenin in CF and non-CF pancreata. pSMAD5-only images are shown below the merged images. (G) Co-localization of active beta-catenin and pan-cytokeratin in ductal cells. (H) Co-localization of active beta-catenin and insulin in an islet. (I) Quantification of nuclear active beta-catenin expression in both pan-cytokeratin-positive ductal cells and insulin positive islet cells. Levels of active beta-catenin were significantly increased in ductal cells (Tukey HSD; ductal, p = 0.026) but not beta cells in the context of CF. All quantifications were performed using the Metamorph cellular scoring module. All scale bars represent 20 mm. The number of donors used in each experiment are noted in (C), (F), and (I). Each donor was tile-scanned and quantified, yielding the averages, which were used for analyses as noted in Table S6.

References

    1. Arthur D, and Vassilvitskii S (2007). k-means++: the advantages of careful seeding In Proceedings of the Eighteenth Annual ACM-SIAM Symposium on Discrete Algorithms (Society for Industrial and Applied Mathematics), pp. 1027–1035.
    1. Bader E, Migliorini A, Gegg M, Moruzzi N, Gerdes J, Roscioni SS, Bakhti M, Brandl E, Irmler M, Beckers J, et al. (2016). Identification of proliferative and mature b-cells in the islets of Langerhans. Nature 535, 430–434. - PubMed
    1. Ballouz S, Weber M, Pavlidis P, and Gillis J (2017). EGAD: ultra-fast functional analysis of gene networks. Bioinformatics 33, 612–614. - PMC - PubMed
    1. Behfar A, Zingman LV, Hodgson DM, Rauzier J-M, Kane GC, Terzic A, and Pucéat M (2002). Stem cell differentiation requires a paracrine pathway in the heart. FASEB J 16, 1558–1566. - PubMed
    1. Bogdani M, Blackman SM, Ridaura C, Bellocq J-P, Powers AC, and Aguilar-Bryan L (2017). Structural abnormalities in islets from very young children with cystic fibrosis may contribute to cystic fibrosis-related diabetes. Sci. Rep 7, 17231. - PMC - PubMed

Publication types

Substances