

MRI Relaxometry for Quantitative Analysis of USPIO Uptake in Cerebral Small Vessel Disease
- PMID: 30759756
- PMCID: PMC6387454
- DOI: 10.3390/ijms20030776
MRI Relaxometry for Quantitative Analysis of USPIO Uptake in Cerebral Small Vessel Disease
Abstract
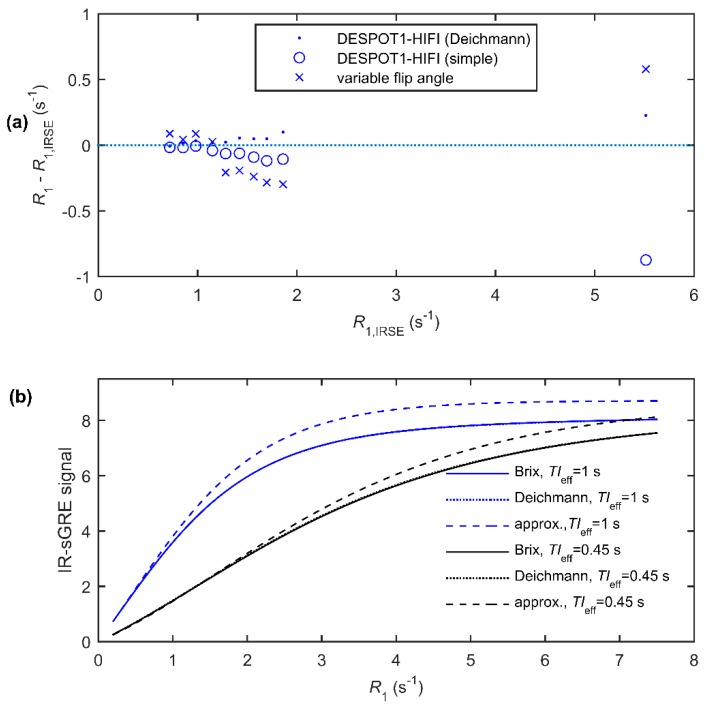
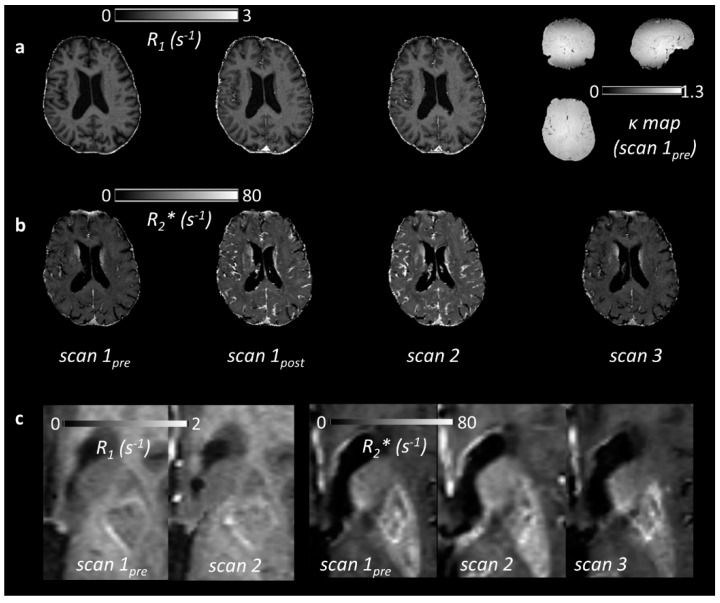
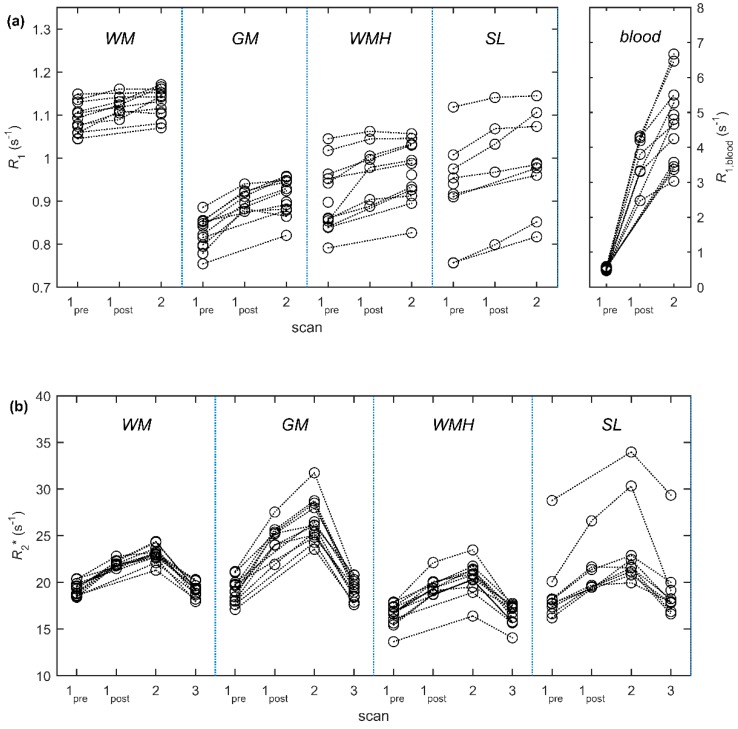
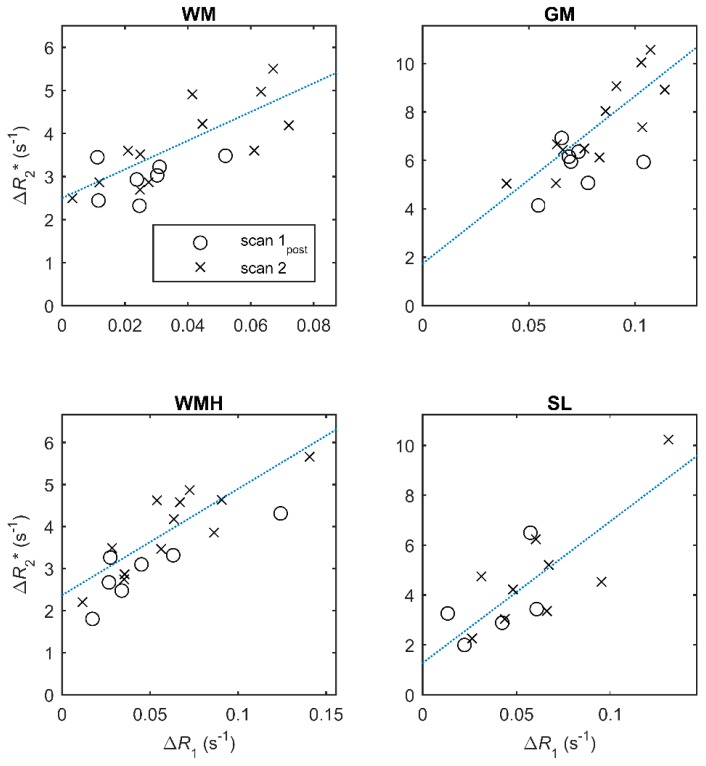
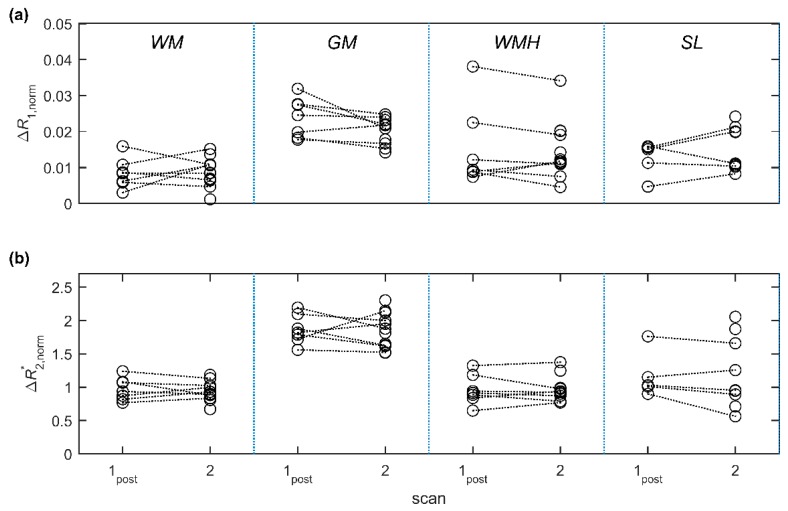
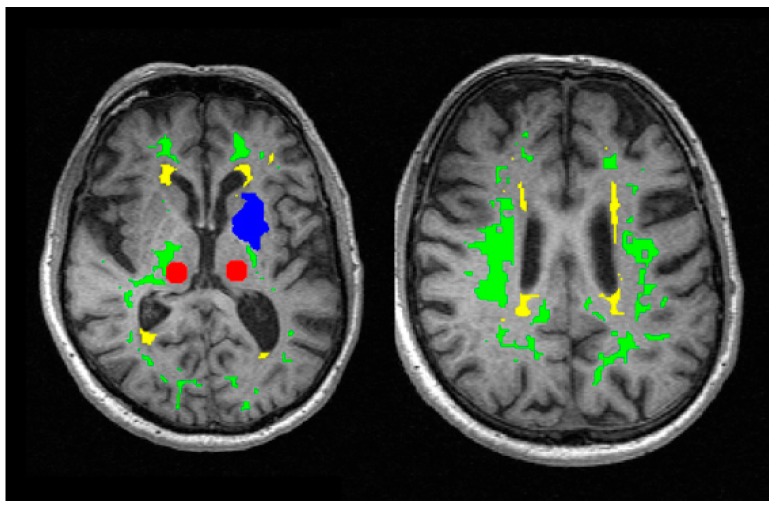
A protocol for evaluating ultrasmall superparamagnetic particles of iron oxide (USPIO) uptake and elimination in cerebral small vessel disease patients was developed and piloted. B₁-insensitive R₁ measurement was evaluated in vitro. Twelve participants with history of minor stroke were scanned at 3-T MRI including structural imaging, and R₁ and R₂* mapping. Participants were scanned (i) before and (ii) after USPIO (ferumoxytol) infusion, and again at (iii) 24⁻30 h and (iv) one month. Absolute and blood-normalised changes in R₁ and R₂* were measured in white matter (WM), deep grey matter (GM), white matter hyperintensity (WMH) and stroke lesion regions. R₁ measurements were accurate across a wide range of values. R₁ (p < 0.05) and R₂* (p < 0.01) mapping detected increases in relaxation rate in all tissues immediately post-USPIO and at 24⁻30 h. R₂* returned to baseline at one month. Blood-normalised R₁ and R₂* changes post-infusion and at 24⁻30 h were similar, and were greater in GM versus WM (p < 0.001). Narrower distributions were seen with R₂* than for R₁ mapping. R₁ and R₂* changes were correlated at 24⁻30 h (p < 0.01). MRI relaxometry permits quantitative evaluation of USPIO uptake; R₂* appears to be more sensitive to USPIO than R₁. Our data are explained by intravascular uptake alone, yielding estimates of cerebral blood volume, and did not support parenchymal uptake. Ferumoxytol appears to be eliminated at 1 month. The approach should be valuable in future studies to quantify both blood-pool USPIO and parenchymal uptake associated with inflammatory cells or blood-brain barrier leak.
Keywords: MRI; USPIO; cerebral small vessel disease; ferumoxytol; inflammation; relaxometry.
Conflict of interest statement
The authors have no conflict of interest to declare.
Figures
References
-
- Aribisala B.S., Wiseman S., Morris Z., Valdes-Hernandez M.C., Royle N.A., Maniega S.M., Gow A.J., Corley J., Bastin M.E., Starr J., et al. Circulating inflammatory markers are associated with magnetic resonance imaging-visible perivascular spaces but not directly with white matter hyperintensities. Stroke. 2014;45:605–607. doi: 10.1161/STROKEAHA.113.004059. - DOI - PMC - PubMed
-
- Wardlaw J.M., Makin S.J., Hernandez M.C.V., Armitage P.A., Heye A.K., Chappell F.M., Munoz-Maniega S., Sakka E., Shuler K., Dennis M.S., et al. Blood-brain barrier failure as a core mechanism in cerebral small vessel disease and dementia: Evidence from a cohort study. Alzheimers Dement. 2017;13:634–643. doi: 10.1016/j.jalz.2016.09.006. - DOI
-
- Munoz Maniega S., Chappell F.M., Valdes Hernandez M.C., Armitage P.A., Makin S.D., Heye A.K., Thrippleton M.J., Sakka E., Shuler K., Dennis M.S., et al. Integrity of normal-appearing white matter: Influence of age, visible lesion burden and hypertension in patients with small-vessel disease. J. Cereb. Blood Flow Metab. 2017;37:644–656. doi: 10.1177/0271678X16635657. - DOI - PMC - PubMed
-
- Thrippleton M.J., Shi Y.L., Blair G., Hamilton I., Waiter G., Schwarzbauer C., Pernet C., Andrews P.J.D., Marshall I., Doubal F., et al. Cerebrovascular reactivity measurement in cerebral small vessel disease: Rationale and reproducibility of a protocol for MRI acquisition and image processing. Int. J. Stroke. 2018;13:195–206. doi: 10.1177/1747493017730740. - DOI - PubMed
MeSH terms
Substances
Grants and funding
- MR/J006971/1/MRC_/Medical Research Council/United Kingdom
- ETM/326/CSO_/Chief Scientist Office/United Kingdom
- G0701127/MRC_/Medical Research Council/United Kingdom
- N/A/Wellcome Trust - University of Edinburgh Institutional Strategic Support Fund
- G0700704/84698/University of Edinburgh Centre of Cognitive Ageing and Cognitive Epidemiology
LinkOut - more resources
Full Text Sources
Medical
