. 2019 Feb 12;16(3):513.
doi: 10.3390/ijerph16030513.

Advanced Hepatitis C Virus Replication PDE Models within a Realistic Intracellular Geometric Environment

Affiliations

Advanced Hepatitis C Virus Replication PDE Models within a Realistic Intracellular Geometric Environment

Markus M Knodel et al. Int J Environ Res Public Health. .

Abstract

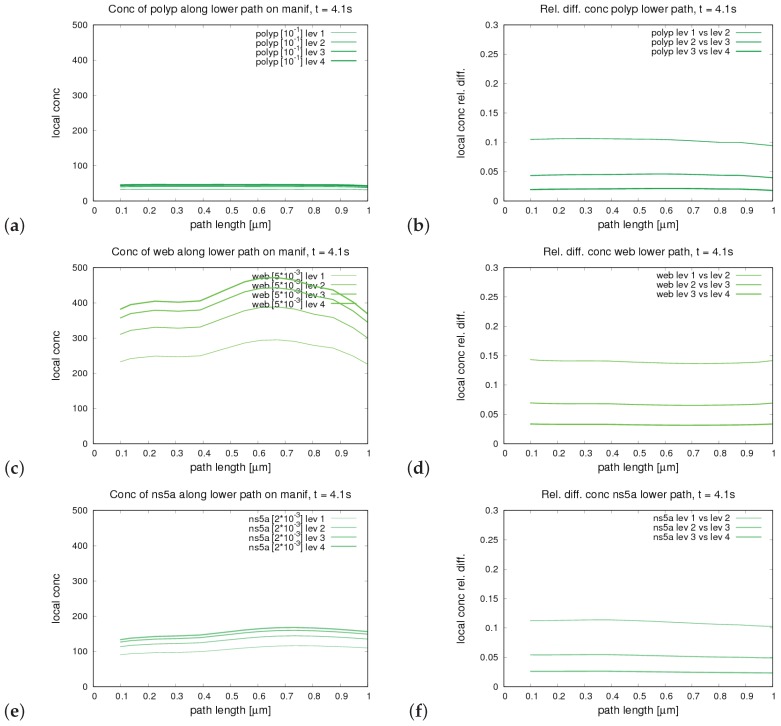
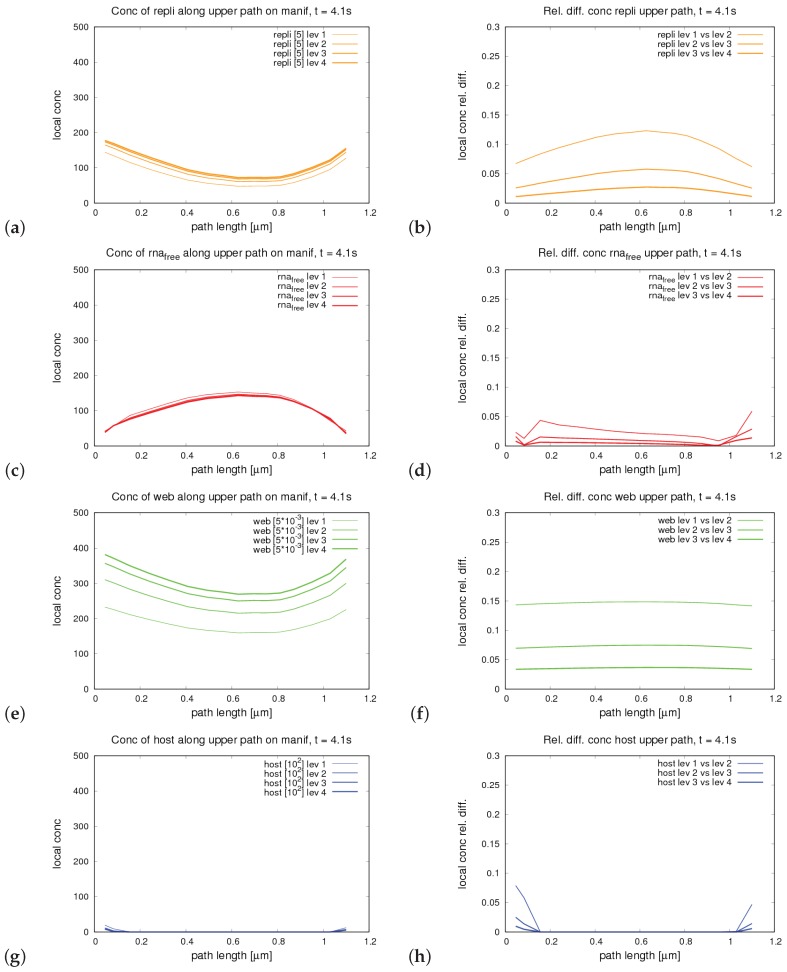
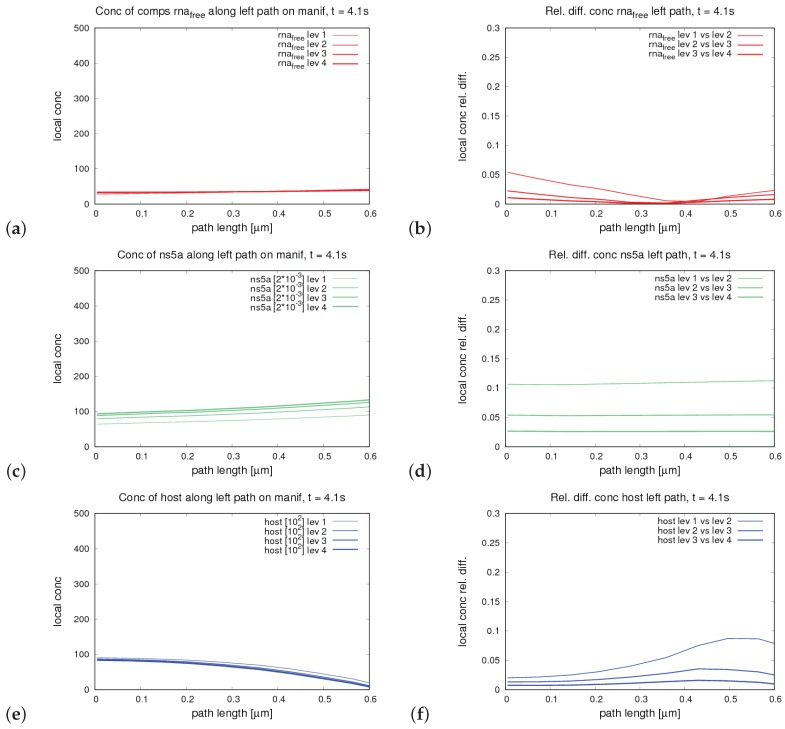
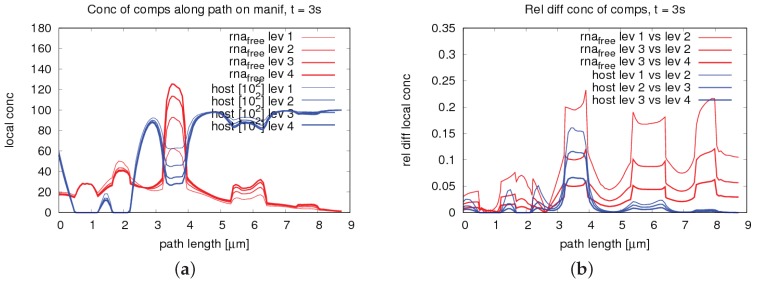
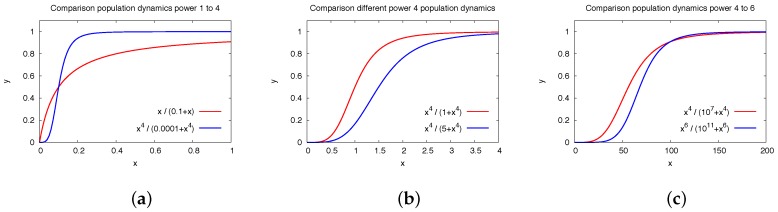
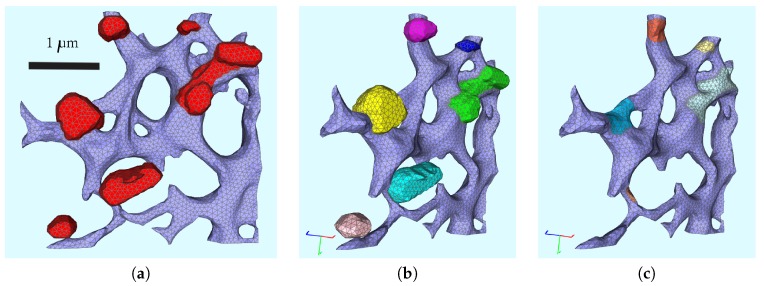
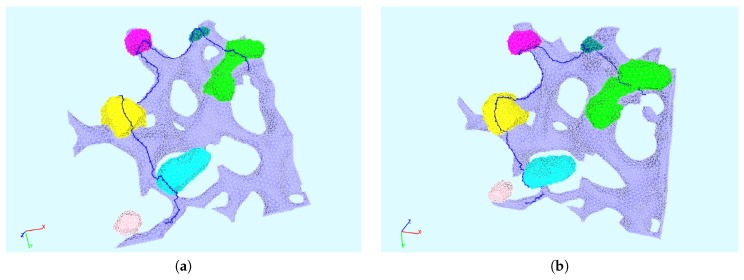
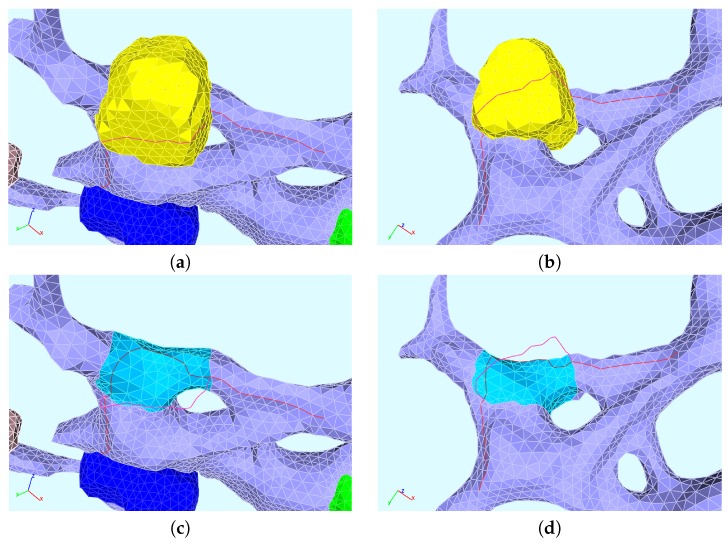
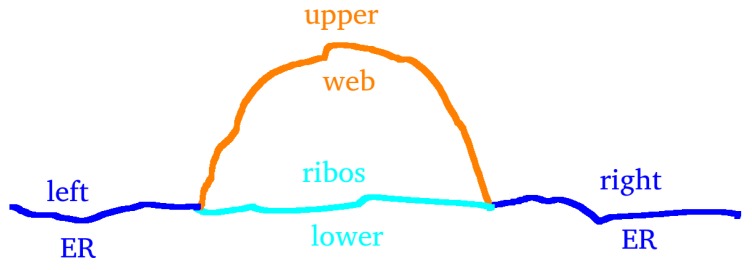
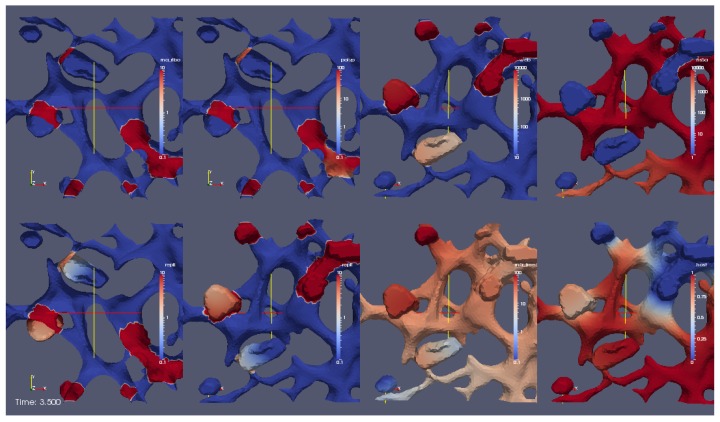
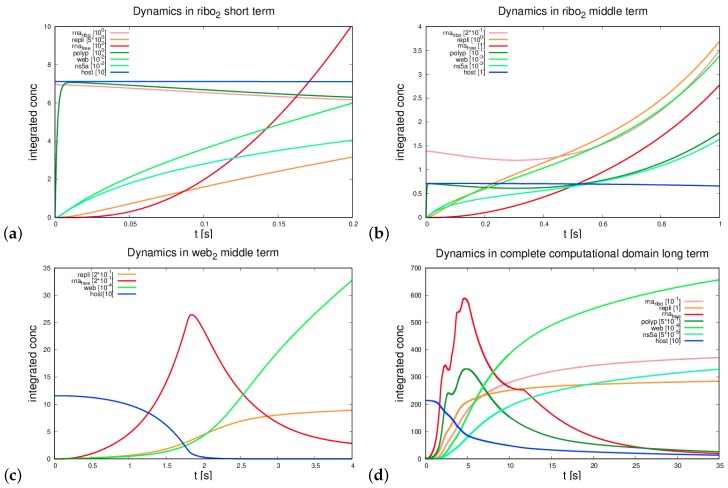
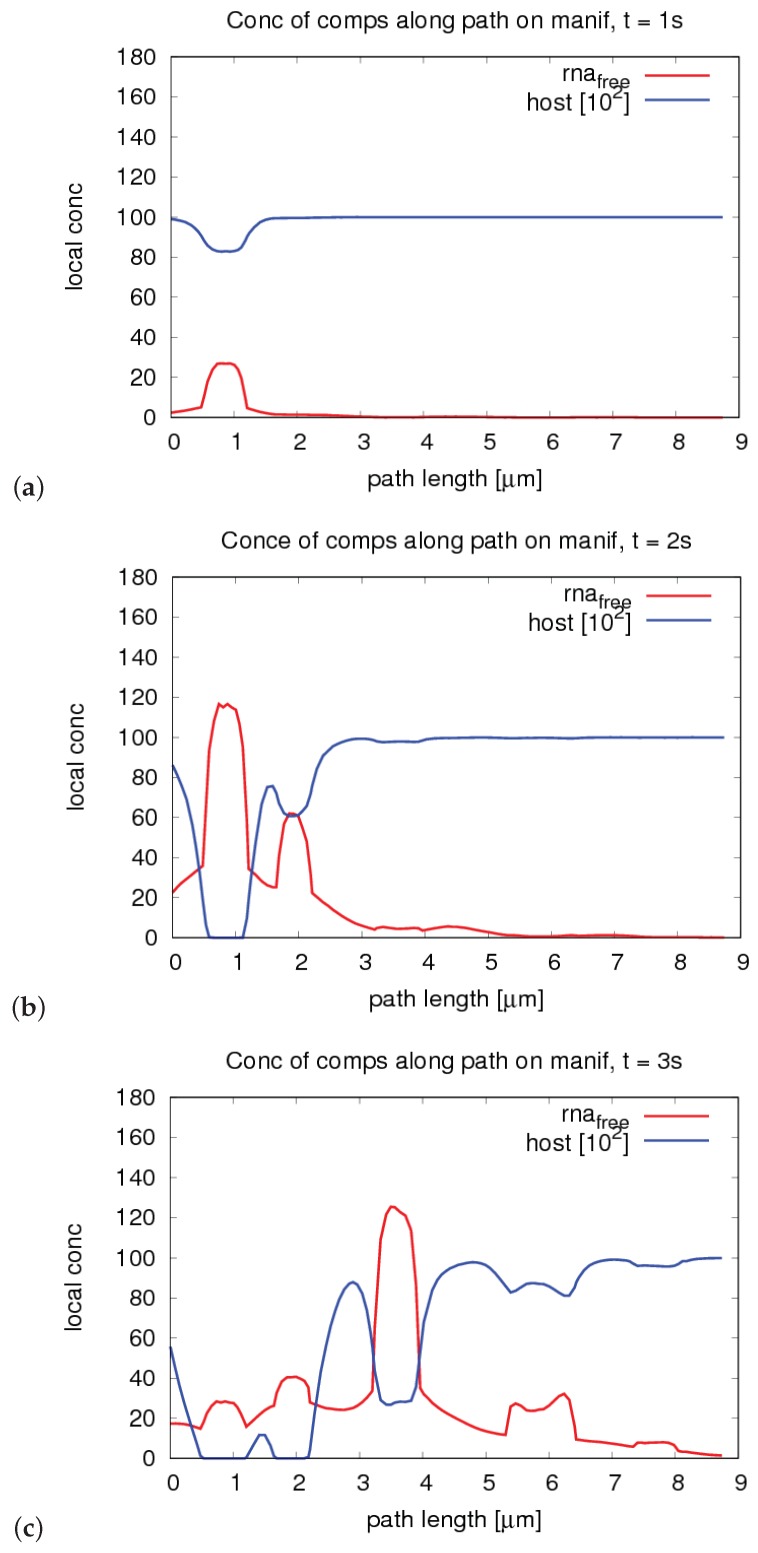
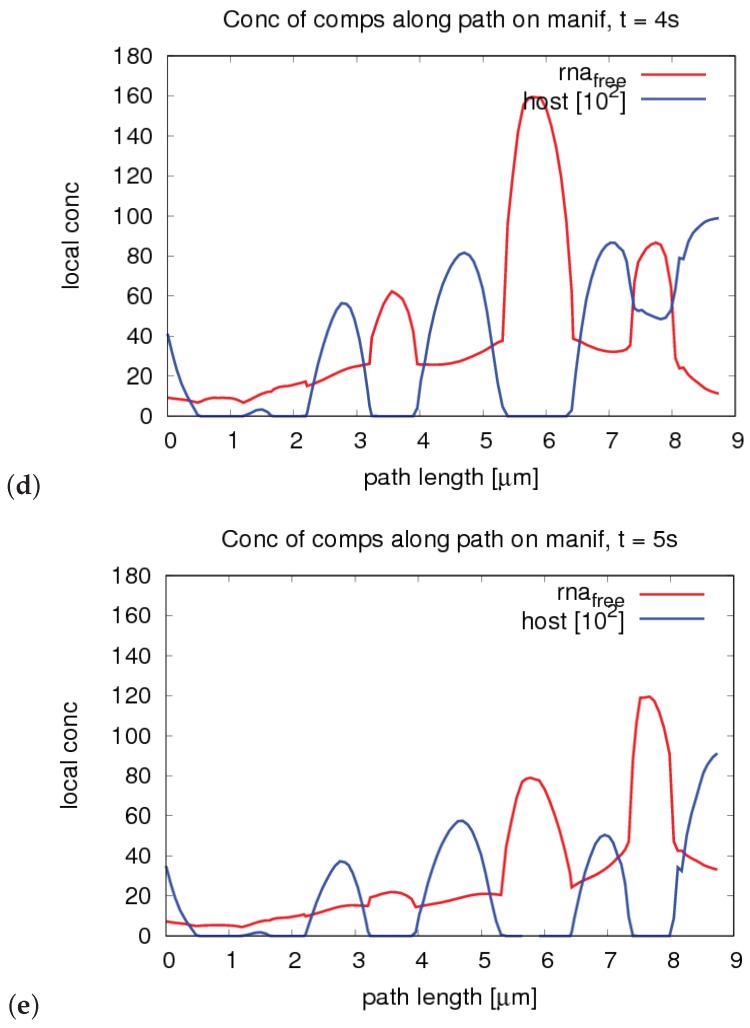
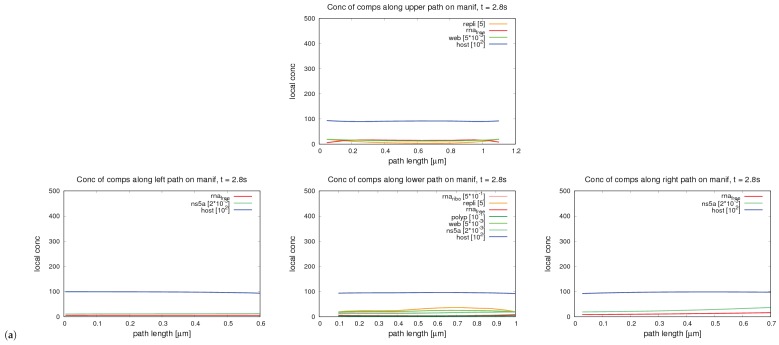
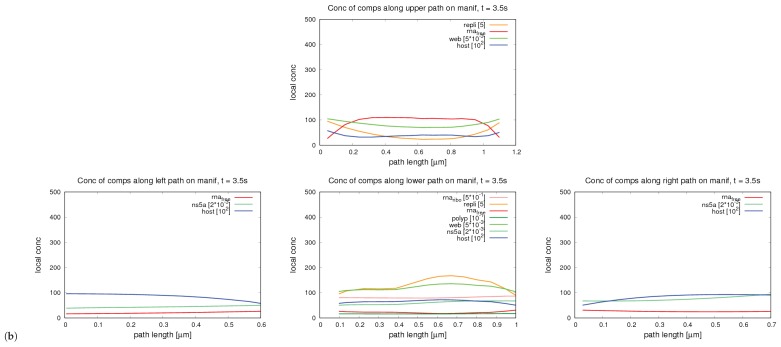
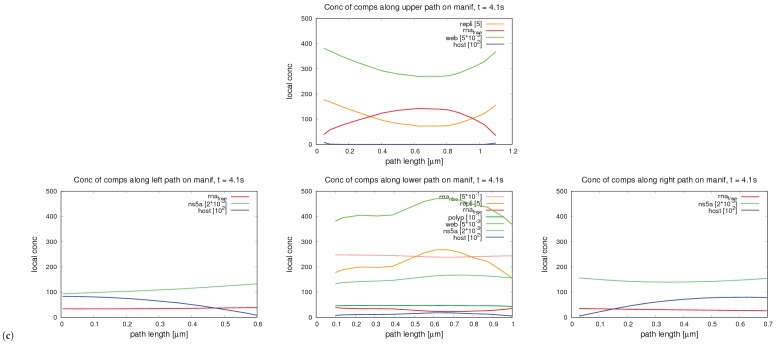
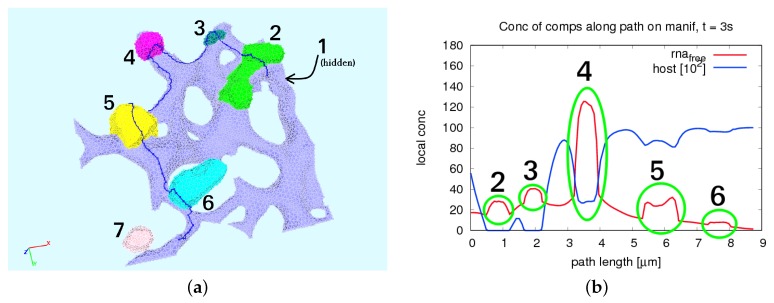
The hepatitis C virus (HCV) RNA replication cycle is a dynamic intracellular process occurring in three-dimensional space (3D), which is difficult both to capture experimentally and to visualize conceptually. HCV-generated replication factories are housed within virus-induced intracellular structures termed membranous webs (MW), which are derived from the Endoplasmatic Reticulum (ER). Recently, we published 3D spatiotemporal resolved diffusion⁻reaction models of the HCV RNA replication cycle by means of surface partial differential equation (sPDE) descriptions. We distinguished between the basic components of the HCV RNA replication cycle, namely HCV RNA, non-structural viral proteins (NSPs), and a host factor. In particular, we evaluated the sPDE models upon realistic reconstructed intracellular compartments (ER/MW). In this paper, we propose a significant extension of the model based upon two additional parameters: different aggregate states of HCV RNA and NSPs, and population dynamics inspired diffusion and reaction coefficients instead of multilinear ones. The combination of both aspects enables realistic modeling of viral replication at all scales. Specifically, we describe a replication complex state consisting of HCV RNA together with a defined amount of NSPs. As a result of the combination of spatial resolution and different aggregate states, the new model mimics a cis requirement for HCV RNA replication. We used heuristic parameters for our simulations, which were run only on a subsection of the ER. Nevertheless, this was sufficient to allow the fitting of core aspects of virus reproduction, at least qualitatively. Our findings should help stimulate new model approaches and experimental directions for virology.

Keywords: (surface) partial differential equations; 3D spatiotemporal resolved mathematical models; Finite Volumes; computational virology; hepatitis C virus (HCV); massively parallel multigrid solvers; mathematical models of viral RNA cycle; population dynamics; realistic geometries; viral dynamics; within-host viral modeling.


Conflict of interest statement

The authors declare no conflict of interest. The founding sponsors had no role in the design of the study; in the collection, analyses, or interpretation of data; in the writing of the manuscript, and in the decision to publish the results.

Figures

Figure A1
Figure A1
Development of integrated concentrations within complete computational domain under spatial refinement from level 0 (base level, direct reconstructed geometry) up to level 4 and relative differences respectively for concentrations of viral proteins. From top to down: Polyprotein, web protein, and NS5a. Left shows absolute values, while right shows relative differences. In detail: (a) Polyprotein absolute values for different grid refinement levevls, (b) Polyprotein relative differences for different grid refinement levels, (c) web protein absolute values, (d) web protein relative differences, (e) NS5a absolute values, (f) NS5a relative differences.
Figure A2
Figure A2
Development of integrated concentrations within complete computational domain under spatial refinement from level 0 (base level, direct reconstructed geometry) up to level 4 and relative differences, respectively, for concentrations of HCV RNA containing species and host factor. From top to down: Ribosomal bound HCV RNA, replication complex, free HCV RNA, and host factor. Left shows absolute values, while right shows relative differences. In detail: (a) Ribosomal bound RNA, absolute values for different grid levels, (b) ribosomal bound RNA relative differences for different grid levels, (c) replication complex, absolute values, (d) replication complex, relative differences, (e) free RNA, absolute values, (f) free RNA, relative differences, (g) host factor absolute values, (h) host factor relative differences.
Figure A3
Figure A3
Variation of spatial refinement level for the 1D profiles of the concentrations around a web region. Right sub path. (a) Free RNA absolute values for different grid levels, (b) Free RNA relative differences for different grid levels, (c) NS5a absolute values, (d) NS5a relative differences, (e) host factor absolute values, (f) host factor relative differences.
Figure A4
Figure A4
Variation of spatial refinement level for the 1D profiles of the concentrations around a web region. Lower sub path part one. Concentrations of HCV RNA containing components and of host factor. (a) Ribsomal bound RNA absolute values for different grid refinement levels, (b) ribsomal bound RNA relative differences for different grid levels, (c) Replication complex absolute values, (d) replication complex relative differences, (e) free RNA absolute values, (f) free RNA relative differences, (g) host factor absolute values, (h) host factor relative differences.
Figure A5
Figure A5
Variation of spatial refinement level for the 1D profiles of the concentrations around a web region. Lower sub path part two. Concentrations of viral protein components. (a) Polyprotein absolute values, (b) polyprotein relative differences, (c) web protein absolute values, (d) web protein relative differences, (e) NS5a absolute values, (f) NS5a relative differences.
Figure A6
Figure A6
Variation of spatial refinement level for the 1D profiles of the concentrations around a web region. Upper sub path. (a) Replication complex absolute values, (b) replication complex relative differences, (c) Free RNA absolute values, (d) free RNA relative differences, (e) web protein absolute values, (f) web protein relative differences, (g) host factor absolute values, (h) host factor relative differences. (Note that, where the host factor is effectively depleted, relative differences are replaced by absolute ones.)
Figure A7
Figure A7
Variation of spatial refinement level for the 1D profiles of the concentrations around a web region. Left sub path. (a) Free RNA absolute values, (b) free RNA relative differences, (c) NS5a absolute values, (d) NS5a relative differences, (e) host factor absolute values, (f) host factor relative differences.
Figure A8
Figure A8
Grid convergency behavior of the concentrations of free HCV RNA and host factor along the long path around the ER and web surface at time t=3 s: (a) concentrations at different levels; and (b) relative differences.
Figure A9
Figure A9
Population dynamics coefficient structure for the choice of different parameters. Plotting y=f(x)=xaxa+b for different choices of a,b. Model coefficient comparisons of possible factors: Comparison of functions with factor a = 1, 4 and 6 (cf. Appendix I). Obviously, power 4 enables sharper transitions then power 1, but power 6 does not cause further big changes. (a) Comparison of a=1 and a=4, (b) comparison for case a=4 using different values of b, (c) comparison case a=4 and a=6.
Figure 1
Figure 1
Small subsection of ER, surface grid. All surfaces together form the computation domain 𝒟. (a) ER surface and MW regions characteristics: ℰ in blue, and 𝒲 in red. (b) Subdomains of the surface model (geometry slightly rotated). Each web region represents its own subdomain. Ribosomes not visible because they are “hidden” behind the web regions. (c) Ribosomal regions visible due to undisclosed web regions. Note in (b,c): blue: ℰ; other colors: single MW regions Wi and ribosomal regions Ri, i=1,2,,7.
Figure 2
Figure 2
Evaluation of the concentrations along the shown pathways (two perspectives of the path: path indicated by lines in blue, starting from the upper right direction anti-clockwise). (a,b) show the geometry/the path from slightly changed perspectives.
Figure 3
Figure 3
Evaluation of the concentrations along the shown pathways (four perspectives of the path: path on ER and web surface, path on the ribosomes, with and without the web visible). Path from right to left. The sub paths are the four red lines, which start/end where another subdomain begins (besides the external beginnings on the ER, left and right). (a) path on ER and web surface, web visible, (b) path on ER and web surface, web visbile, slightly changed perspective, (c) path on ER and ribosomes, web invisible, (d) path on ER and ribosomes, slightly changed perspective.
Figure 4
Figure 4
Schematic description of the four different sub paths around the web, as shown in Figure 3 (cf. Section 2.10). The ordering of the sub paths shown in this figure corresponds to the perspective as shown in the realistic geometry screenshot in Figure 3b,d.
Figure 5
Figure 5
Screenshot of the simulation of the improved surface model as visualized in movie “Video S1—Population Dynamics Inspired sPDE Model Static View” (description cf. Section 3.1, movie attached as Supplemental S1). Each sector depicts one concentration. In part, different perspectives are used. Upper row, from left to right: Ribosomal-bound HCV RNA, polyprotein, web protein, and NS5a. Lower row, also left to right: Replication complex (ER disclosed by means of a cutting plane), replication complex (ER undisclosed), free HCV RNA, and host factor. For detailed description, see Section 3.1.1. In brief, the movie shows how ribosomal-bound HCV RNA translates polyprotein. The polyprotein splits into web protein and NS5a. The web protein accumulates at the geometrically defined web region to form the MW. NS5a diffuses away at the ER surface. One formerly ribosomal-bound HCV RNA and several web proteins cluster together to form the RC, which diffuses into the MW, where it polymerizes free HCV RNA. The newly synthesized free HCV RNA in part diffuses away and in other parts becomes bound again at the ribosomes on-site. When free HCV RNA reaches the next ribosomal region, the cycle starts there again. Step by step, the cell is filled with HCV RNA and viral proteins. The host factor is consumed where (free) HCV RNA gets polymerized by the RC.
Figure 6
Figure 6
Evaluation of the integrated concentrations (Equation (13)) of the components of the basic sPDEs (Equation (5a)–(5g) with initial conditions in Equation (7a)–(7c), using the test parameters, as indicated in Table 2 and Table 3) in different subdomains: (a) ribosomal region # 2 (R2) short term; (b) ribosomal region # 2 (R2) middle term; (c) MW region # 2 (W2) middle term; and (d) complete computational domain (𝒟) long term (cf. Section 2.9 and Section 3.4) Results are shown at grid refinement level 4. The graphs of this figure depict the evaluation of the integrals of the concentrations (Equation (13)) over time for different species. The time is shown at the x-axis. The integrals of the concentrations are shown at the y-axis. The integrals of the concentrations are the sum of each component within their respectively-defined region. The four graphs consider the integrals within different time scales and also within different geometric regions. The integrals are computed within the indicated regions. For example, the integral of (a) is computed over the ribosomal region #2, R2, therefore the integral reads as given for this special case in Equation (12). The other regions are also indicated within the title of the graphics (ad), cf. Equation (13). The consideration of different time scales allows for consideration of the processes at different temporal resolution, namely for considering the processes structure at special regions at the beginning of the cycle, for example how the HCV RNA translates polyprotein and how the polyprotein splits at the very beginning (cf. (a)). The split of the polyprotein causes the appearance of web (accumulating) protein and NS5a. In (b), we consider the process for a longer time scenario. In, (c) the consequences at the surrounding web region, i.e., the dynamics of the concentrations in the web #2, W2, which grows on top of the ribosomal region # 2, are considered. We observe the uprise of free RNA, which is produced by the RC, until when the host factor is depleted. Then, locally, free RNA decreases again. The decrease of ribosomal bound RNA at the beginning corresponds with RC creation, while ribosomal bound RNA rises up again once free RNA is produced substantially. We note that the integral of graph (d) is performed over the complete computational domain D. The last graph (d) shows the sum of each component within the complete part of the cell we consider. We see the uprise of free HCV RNA, and we also observe the staircase similar steps when the next web region is reached. Then, free RNA is sequestered by the ribosomes, and new polyprotein arises which splits again into NSPs to continue the cycle. The host factor depletes more and more.
Figure 7
Figure 7
1D profiles of concentrations along the long path, cf. Figure 2. (For details, cf. Section 3.5.) One sees clearly how the “peak” of free HCV RNA moves through the cell at different time points t=1,2,3,4,5s. ((a): t=1s, (b): t=2s, (c): t=3s, (d): t=4s, (e): t=5s). Note: The path length seems to be similar on the ER surface between two neighboring webs and from the (spatial) beginning of one webs until its end. However, this is because we cross the webs on their respective longest path “on the top”. The direct distance from the beginning of a web to its end is smaller compared to the distance between two webs. Results of grid refinement level 4. Consider also Figure 9, where we mark the peaks and relate them to their corresponding web “number”.
Figure 7
Figure 7
1D profiles of concentrations along the long path, cf. Figure 2. (For details, cf. Section 3.5.) One sees clearly how the “peak” of free HCV RNA moves through the cell at different time points t=1,2,3,4,5s. ((a): t=1s, (b): t=2s, (c): t=3s, (d): t=4s, (e): t=5s). Note: The path length seems to be similar on the ER surface between two neighboring webs and from the (spatial) beginning of one webs until its end. However, this is because we cross the webs on their respective longest path “on the top”. The direct distance from the beginning of a web to its end is smaller compared to the distance between two webs. Results of grid refinement level 4. Consider also Figure 9, where we mark the peaks and relate them to their corresponding web “number”.
Figure 8
Figure 8
1D profiles of concentrations along the short path (as shown in Figure 3) around a single web. (For details, cf. Section 3.5.) One sees clearly how the concentrations are strongly enhanced around and especially within the web: first time point of observation (a): t=2.8 s; second time point of observation (b): t=3.5 s; and third time point of observation (c): t=4.1 s. Note: Ordering of the figures corresponds to the spatial order of the sub paths as displayed in Figure 4. (Each single sub graphics of each sub figure corresponds to one sub path, i.e., the time evolution of the concentrations of each sub path is reflected by means of the values shown in the corresponding sub graphics of each sub figure. The ordering of the single graphics belonging to a certain time point of evaluation corresponds to the sub paths which are depicted in Figure 4. To this end, for example, the left sub graphics of sub figure (a),(b) and (c) belongs to the left sub path at the time points t=2.8 s, t=3.5 s, and t=4.1 s.) Note that the concentrations belong to one single web and its close environment in this case, since the geometrical space observed refers to a single web and its close environment. The peaks of concentration are hence related to special locations inside the web under consideration. (Results of grid refinement level 4.)
Figure 8
Figure 8
1D profiles of concentrations along the short path (as shown in Figure 3) around a single web. (For details, cf. Section 3.5.) One sees clearly how the concentrations are strongly enhanced around and especially within the web: first time point of observation (a): t=2.8 s; second time point of observation (b): t=3.5 s; and third time point of observation (c): t=4.1 s. Note: Ordering of the figures corresponds to the spatial order of the sub paths as displayed in Figure 4. (Each single sub graphics of each sub figure corresponds to one sub path, i.e., the time evolution of the concentrations of each sub path is reflected by means of the values shown in the corresponding sub graphics of each sub figure. The ordering of the single graphics belonging to a certain time point of evaluation corresponds to the sub paths which are depicted in Figure 4. To this end, for example, the left sub graphics of sub figure (a),(b) and (c) belongs to the left sub path at the time points t=2.8 s, t=3.5 s, and t=4.1 s.) Note that the concentrations belong to one single web and its close environment in this case, since the geometrical space observed refers to a single web and its close environment. The peaks of concentration are hence related to special locations inside the web under consideration. (Results of grid refinement level 4.)
Figure 9
Figure 9
Web regions and their reflection within the evaluation of the concentrations of free HCV RNA and host factor along the 1D trajectories as introduced in Figure 2. Web region #1 is not visible from the given perspective. Therefore, we also did not include it within the path of evaluation. In the left picture (a), we show the numbering of the web regions, whereas in the right picture (b), we see the reflection of the web regions along the trajectories by means of the changes of the concentration values. We choose the time point t=3 s to demonstrate the relation of free HCV RNA peaks within the webs (and host factor depletion), since, at this time point, all free HCV RNA peaks corresponding to its respective web region are at least somewhat visible. We mark the free HCV RNA peaks with a green circle. The host factor depletion centers are visible at the same locations of the path length (i.e., x) axis. Compare also Figure 7 for time evolution along this trajectory.

Similar articles

Cited by

References

    1. Moradpour D., Penin F., Rice C.M. Replication of hepatitis C virus. Nat. Rev. Microbiol. 2007;5:453–463. doi: 10.1038/nrmicro1645. - DOI - PubMed
    1. Tu T., Bühler S., Bartenschlager R. Chronic viral hepatitis and its association with liver cancer. Biol. Chem. 2017;26:817–837. doi: 10.1515/hsz-2017-0118. - DOI - PubMed
    1. Romero-Brey I., Merz A., Chiramel A., Lee J., Chlanda P., Haselman U., Santarella-Mellwig R., Habermann A., Hoppe S., Kallis S., et al. Three-dimensional architecture and biogenesis of membrane structures associated with hepatitis C virus replication. PLoS Path. 2012;8:e1003056. doi: 10.1371/journal.ppat.1003056. - DOI - PMC - PubMed
    1. Paul D., Bartenschlager R. Architecture and biogenesis of plus- strand RNA virus replication factories. World J. Virol. 2013;2:32–48. doi: 10.5501/wjv.v2.i2.32. - DOI - PMC - PubMed
    1. Kohli A., Shaffer A., Sherman A., Kottilil S. Treatment of hepatitis C: A systematic review. JAMA. 2014;312:631–640. doi: 10.1001/jama.2014.7085. - DOI - PubMed

Publication types

MeSH terms