

Personalized Nutrient Profiling of Food Patterns: Nestlé's Nutrition Algorithm Applied to Dietary Intakes from NHANES
- PMID: 30759867
- PMCID: PMC6412928
- DOI: 10.3390/nu11020379
Personalized Nutrient Profiling of Food Patterns: Nestlé's Nutrition Algorithm Applied to Dietary Intakes from NHANES
Abstract
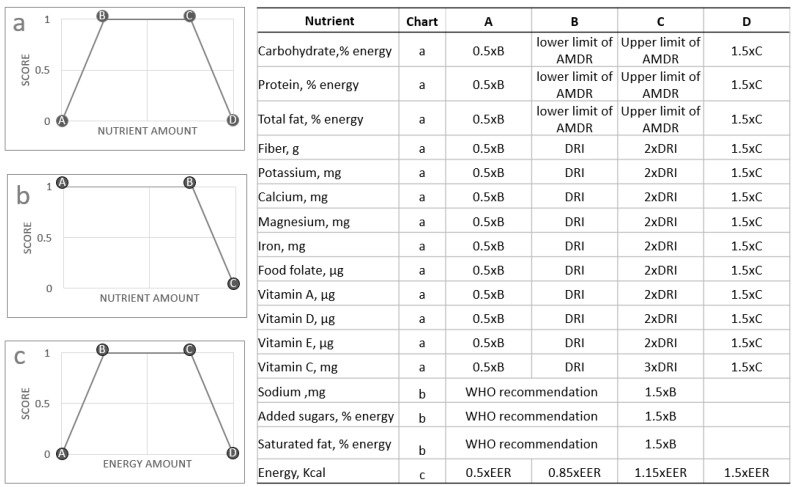
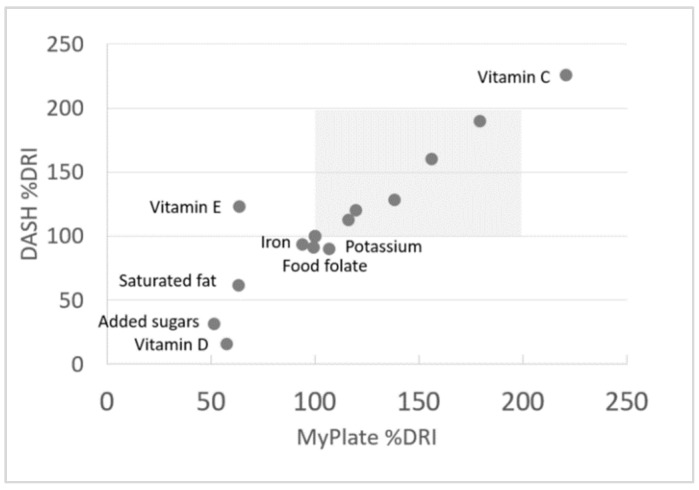
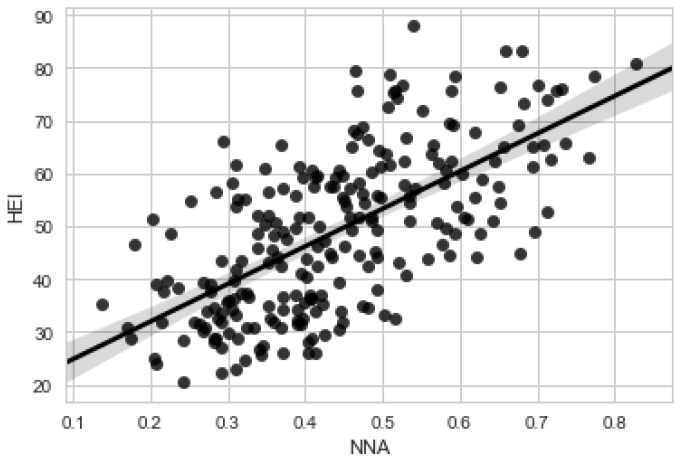
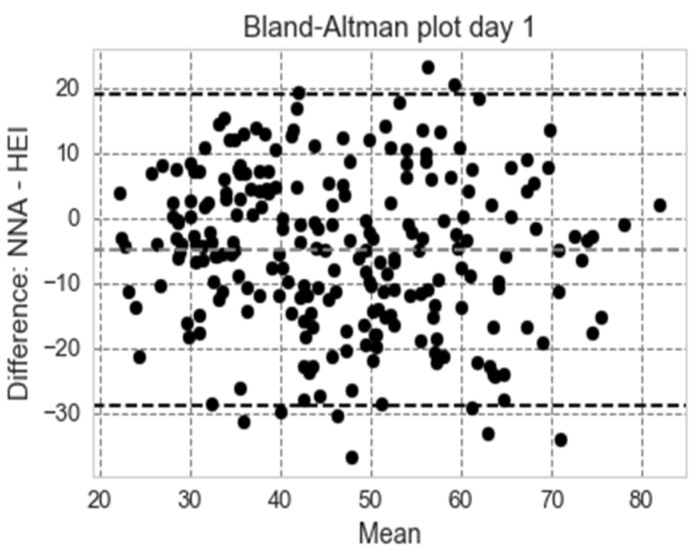
Nutrient profiling (NP) models have been used to assess the nutritional quality of single foods. NP methodologies can also serve to assess the quality of total food patterns. The objective of this study was to construct a personalized nutrient-based scoring system for diet quality and optimal calories. The new Nestlé Nutrition Algorithm (NNA) is based on age and gender-specific healthy ranges for energy and nutrient intakes over a 24 h period. To promote nutrient balance, energy and nutrient intakes either below or above pre-defined healthy ranges are assigned lower diet quality scores. NNA-generated diet quality scores for female 2007⁻2014 National Health and Nutrition Examination Survey (NHANES) participants were compared to their Healthy Eating Index (HEI) 2010 scores. Comparisons involved correlations, joint contingency tables, and Bland Altman plots. The NNA approach showed good correlations with the HEI 2010 scores. NNA mean scores for 7 days of two exemplary menu plans (MyPlate and DASH) were 0.88 ± 0.05 (SD) and 0.91 ± 0.02 (SD), respectively. By contrast, diets of NHANES participants scored 0.45 ± 0.14 (SD) and 0.48 ± 0.14 on first and second days, respectively. The NNA successfully captured the high quality of MyPlate and Dietary Approaches to Stop Hypertension (DASH) menu plans and the lower quality of diets actually consumed in the US.
Keywords: dietary pattern; energy density; nutrient density; nutrient profiling; nutritional quality.
Conflict of interest statement
F.M. and H.G are employed by Nestlé and A.D. is an advisor to the company. There was no corporate influence on the design of the study; in the collection, analyses, or interpretation of data; in the writing of the manuscript.
Figures

Similar articles
-
Food- and diet-based validations of a Nestlé Nutrient Profiling System for reformulation in two nationally representative surveys.Br J Nutr. 2018 Nov;120(9):1056-1064. doi: 10.1017/S0007114518002490. Br J Nutr. 2018. PMID: 30355394
-
A novel approach to selecting and weighting nutrients for nutrient profiling of foods and diets.J Acad Nutr Diet. 2012 Dec;112(12):1968-75. doi: 10.1016/j.jand.2012.08.032. J Acad Nutr Diet. 2012. PMID: 23174684
-
Breakfast in the United States: Food and Nutrient Intakes in Relation to Diet Quality in National Health and Examination Survey 2011⁻2014. A Study from the International Breakfast Research Initiative.Nutrients. 2018 Sep 1;10(9):1200. doi: 10.3390/nu10091200. Nutrients. 2018. PMID: 30200424 Free PMC article.
-
From the SAIN,LIM system to the SENS algorithm: a review of a French approach of nutrient profiling.Proc Nutr Soc. 2017 Aug;76(3):237-246. doi: 10.1017/S0029665117000817. Epub 2017 Jun 9. Proc Nutr Soc. 2017. PMID: 28595671 Review.
-
A proposed nutrient density score that includes food groups and nutrients to better align with dietary guidance.Nutr Rev. 2019 Jun 1;77(6):404-416. doi: 10.1093/nutrit/nuz002. Nutr Rev. 2019. PMID: 31222368 Free PMC article. Review.
Cited by
-
A Progressive Nutrient Profiling System to Guide Improvements in Nutrient Density of Foods and Beverages.Front Nutr. 2021 Dec 23;8:774409. doi: 10.3389/fnut.2021.774409. eCollection 2021. Front Nutr. 2021. PMID: 35004807 Free PMC article.
-
Development and validation of a meal quality index with applications to NHANES 2005-2014.PLoS One. 2020 Dec 22;15(12):e0244391. doi: 10.1371/journal.pone.0244391. eCollection 2020. PLoS One. 2020. PMID: 33351843 Free PMC article.
-
Development of Ferrero Nutrition Criteria: category-specific, progressive guidelines for product innovation.Front Nutr. 2025 Jul 14;12:1612183. doi: 10.3389/fnut.2025.1612183. eCollection 2025. Front Nutr. 2025. PMID: 40727694 Free PMC article.
-
Balanced Hybrid Nutrient Density Score Compared to Nutri-Score and Health Star Rating Using Receiver Operating Characteristic Curve Analyses.Front Nutr. 2022 May 2;9:867096. doi: 10.3389/fnut.2022.867096. eCollection 2022. Front Nutr. 2022. PMID: 35586737 Free PMC article.
-
Designing Optimal Breakfast for the United States Using Linear Programming and the NHANES 2011-2014 Database: A Study from the International Breakfast Research Initiative (IBRI).Nutrients. 2019 Jun 19;11(6):1374. doi: 10.3390/nu11061374. Nutrients. 2019. PMID: 31248096 Free PMC article.
References
-
- Sacks G., Rayner M., Stockley L., Scarborough P., Snowdon W., Swinburn B. Applications of nutrient profiling: Potential role in diet-related chronic disease prevention and the feasibility of a core nutrient-profiling system. Eur. J. Clin. Nutr. 2011;65:298–306. doi: 10.1038/ejcn.2010.269. - DOI - PubMed
MeSH terms
LinkOut - more resources
Full Text Sources
Miscellaneous
