. 2019 Feb 12;9(2):61.
doi: 10.3390/biom9020061.

Light-Induced Protein Clustering for Optogenetic Interference and Protein Interaction Analysis in Drosophila S2 Cells

Affiliations

Light-Induced Protein Clustering for Optogenetic Interference and Protein Interaction Analysis in Drosophila S2 Cells

Mariana Osswald et al. Biomolecules. .

Abstract

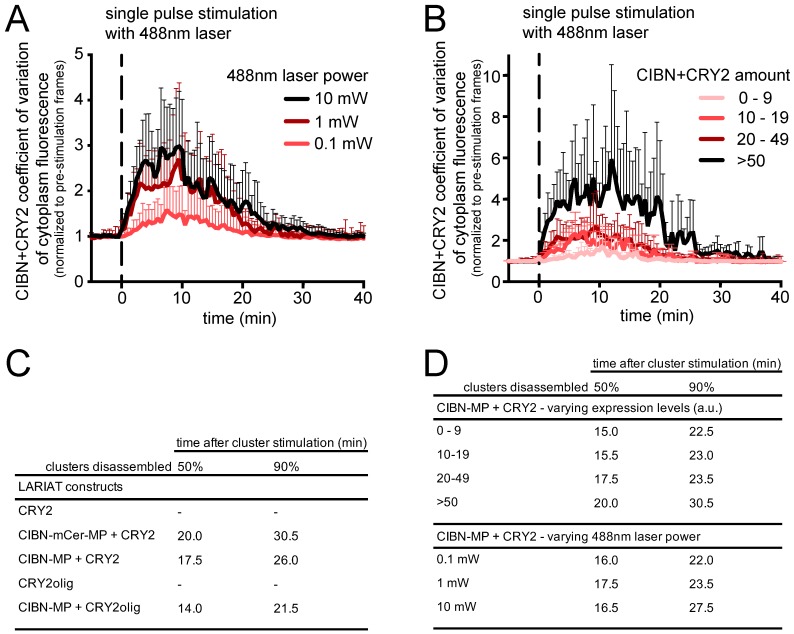
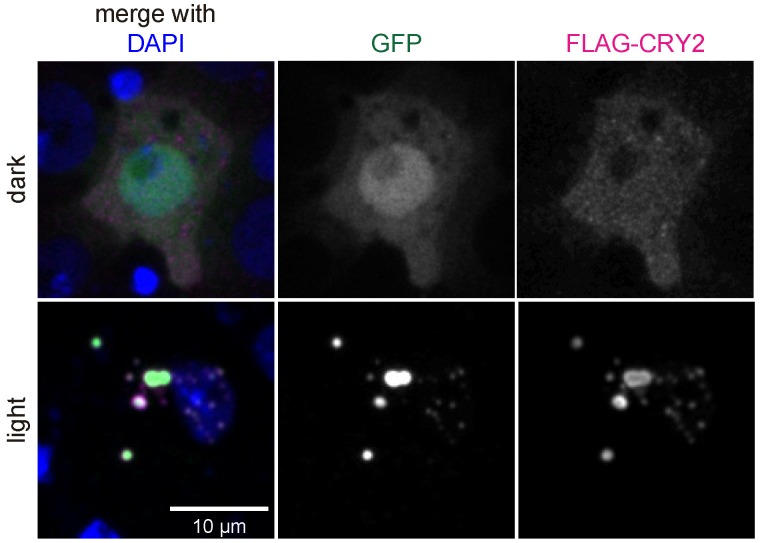
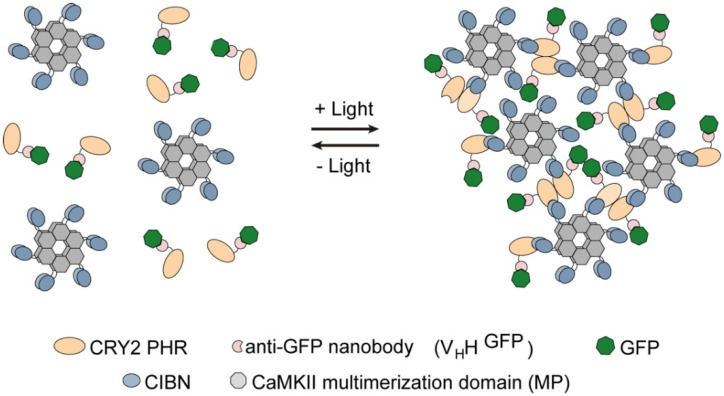
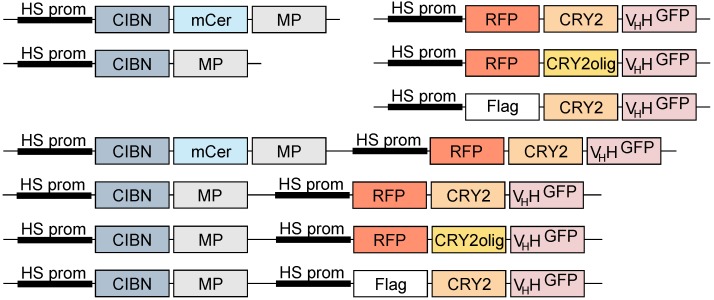
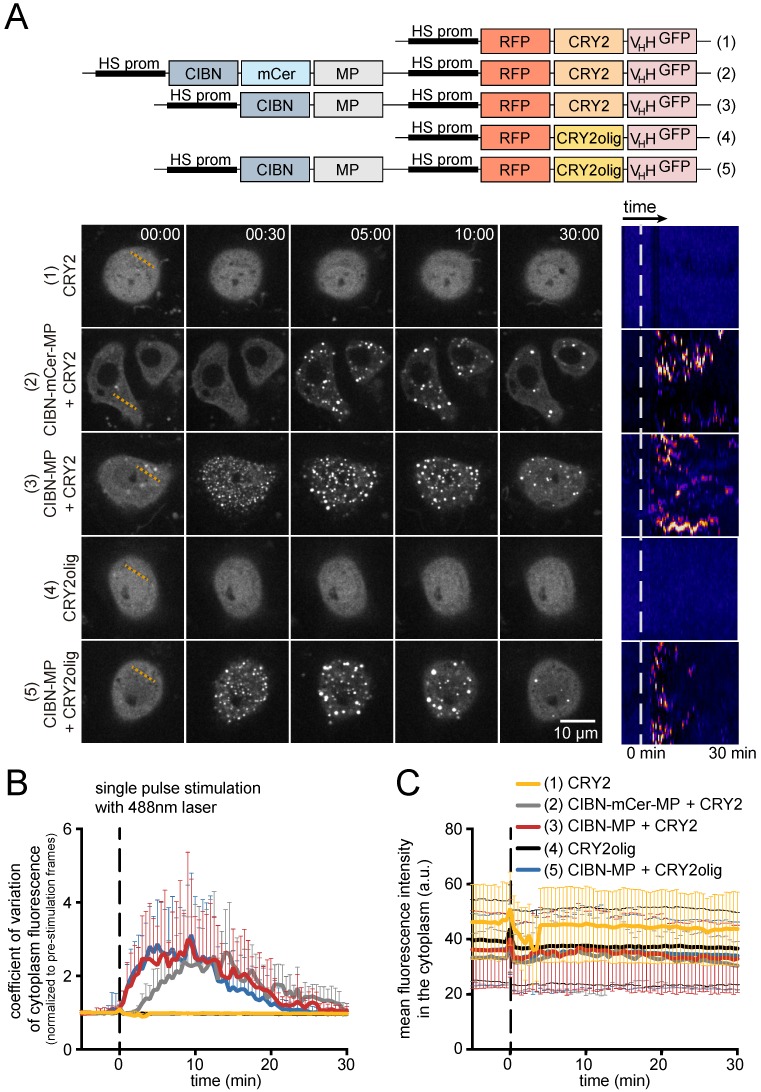
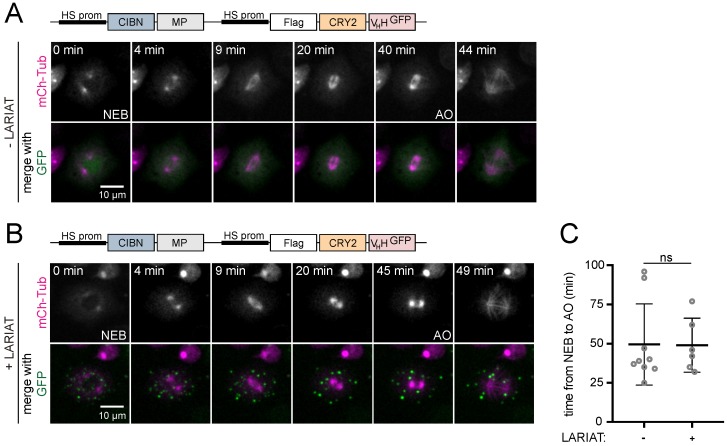
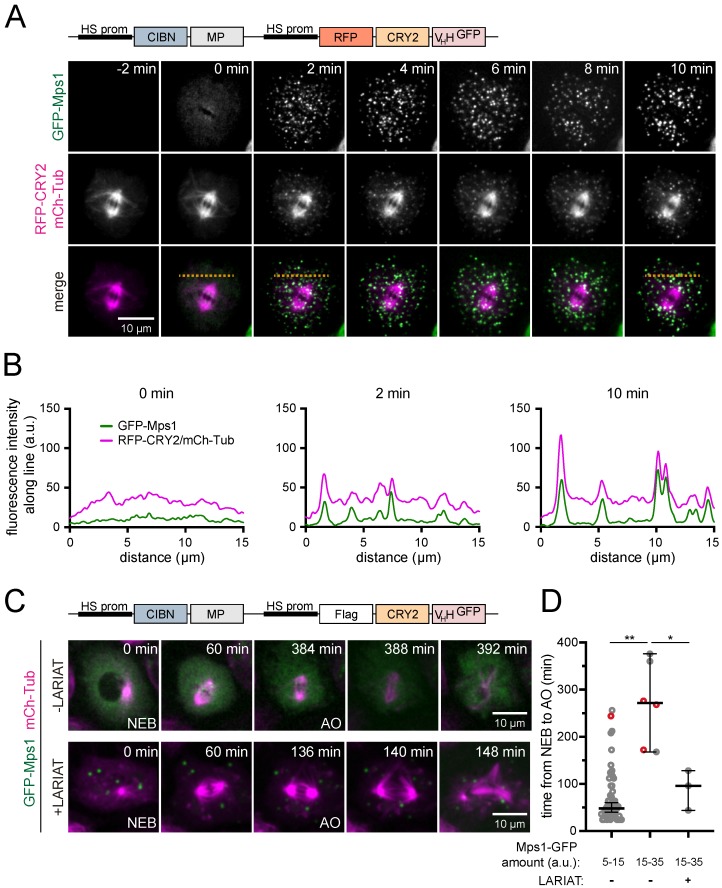
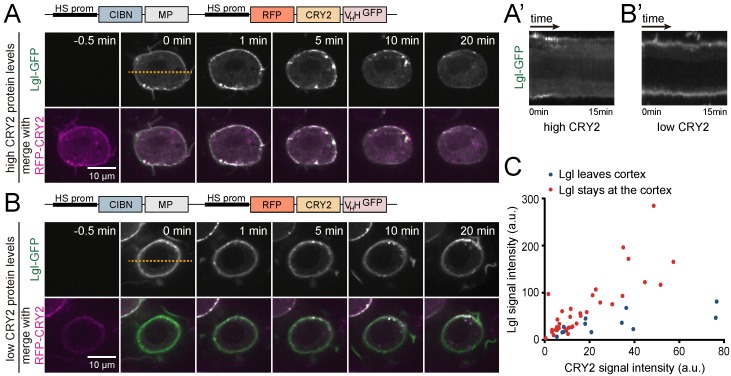
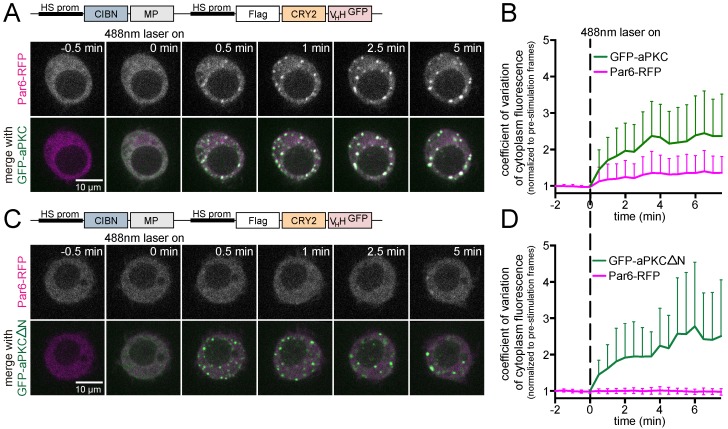
Drosophila Schneider 2 (S2) cells are a simple and powerful system commonly used in cell biology because they are well suited for high resolution microscopy and RNAi-mediated depletion. However, understanding dynamic processes, such as cell division, also requires methodology to interfere with protein function with high spatiotemporal control. In this research study, we report the adaptation of an optogenetic tool to Drosophila S2 cells. Light-activated reversible inhibition by assembled trap (LARIAT) relies on the rapid light-dependent heterodimerization between cryptochrome 2 (CRY2) and cryptochrome-interacting bHLH 1 (CIB1) to form large protein clusters. An anti-green fluorescent protein (GFP) nanobody fused with CRY2 allows this method to quickly trap any GFP-tagged protein in these light-induced protein clusters. We evaluated clustering kinetics in response to light for different LARIAT modules, and showed the ability of GFP-LARIAT to inactivate the mitotic protein Mps1 and to disrupt the membrane localization of the polarity regulator Lethal Giant Larvae (Lgl). Moreover, we validated light-induced co-clustering assays to assess protein-protein interactions in S2 cells. In conclusion, GFP-based LARIAT is a versatile tool to answer different biological questions, since it enables probing of dynamic processes and protein-protein interactions with high spatiotemporal resolution in Drosophila S2 cells.

Keywords: Drosophila; LARIAT; Mps1; Schneider 2 cells; aPKC; cell polarity; mitosis; optogenetics.


Conflict of interest statement

The authors declare no conflict of interest.

Figures

Figure A1
Figure A1
Laser intensity and LARIAT expression levels affect LARIAT clustering. Drosophila S2 cells expressing CIBN-MP and RFP-CRY2-VHH were analyzed through live-imaging as in Figure 3. (A) LARIAT clustering was stimulated with a 488 nm laser set to the indicated laser power for 300 ms at minute 0. Clustering was quantified with the coefficient of variation of cytoplasm fluorescence. Graph displays mean ± SD. n > 10 cells expressing between 20 and 49 relative amount of CIBN-MP + RFP-CRY2-VHH for each laser condition. (B) Cells exposed to 1 mW 488 nm laser power in (A) were grouped according to the CIBN-MP and RFP-CRY2-VHH expression level measured through average fluorescence intensity in the cytoplasm in the frames prior to the clustering stimulation. Graph displays mean ± SD. n(0–9) = 4 cells, n(10–19) = 4 cells, n(20–49) = 12 cells, n(50+) = 4 cells. Timepoint at which clustering reversal reaches 50% and 90% of maximum clustering, which was estimated after smoothing curves plotted in Figure 3B (C) and Figure A1A,B (D).
Figure A2
Figure A2
FLAG-tagged LARIAT clusters GFP. Drosophila S2 cells expressing GFP, CIBN-MP, and FLAG-CRY2-VHH incubated in the dark or exposed to a 472 nm LED light to stimulate clustering were stained for FLAG (magenta) to detect FLAG-CRY2.
Figure 1
Figure 1
Schematic representation of light-activated reversible inhibition by assembled trap (LARIAT)-mediated optogenetic clustering. It enables optogenetic clustering of target proteins to interfere with their function and to probe interactions. Cryptochrome-interacting bHLH N-terminal (CIBN) fused with the multimerization domain from CaMKIIα (MP) forms dodecamers in the cytoplasm. The cryptochrome 2 (CRY2) photolyase homology region (PHR) is fused with an anti-GFP nanobody that binds specifically to GFP-tagged proteins. Blue light triggers CRY2 oligomerization and binding to CIBN and consequently the formation of clusters to trap GFP-tagged proteins. In the dark, CRY2 reverts spontaneously to its ground state and the clusters disassemble.
Figure 2
Figure 2
Schematic representation of LARIAT plasmids for Drosophila Schneider 2 (S2) cells. LARIAT modules were cloned downstream of the Hsp70 promoter. Untagged and mCerulean-tagged CIBN are fused with the MP. Flag- or red fluorescence protein (RFP-) tagged CRY2 photolyase homology region are fused with an anti-GFP nanobody (VHHGFP). CRY2olig oligomerization ability is enhanced due to a single point mutation—E490G. Different CRY2 and CIBN expression cassettes were combined in the same vectors for efficient co-expression.
Figure 3
Figure 3
A Drosophila S2 cell LARIAT toolbox. (A) Representative timepoints and Z-sections of Drosophila S2 cells expressing the indicated LARIAT modules. Transfected cells were kept in the dark prior to live-imaging. Pseudo-colored kymographs made along the orange dashed lines represent cluster formation and disassembly after stimulation with a 488 nm laser set to 1 mW laser power for 300 msec at minute 0 (white dashed line). (B) Clustering was quantified with the coefficient of variation of cytoplasm fluorescence and (C) mean fluorescence intensity was plotted along time. Graphs display mean ± standard deviation (SD). n(CRY2) = 9 cells, n(CIBN-mCer-MP+CRY2) = 5 cells, n(CIBN-MP+CRY2) = 15 cells, n(CRY2olig) = 10 cells, n(CIBN-MP+CRY2olig) = 13 cells.
Figure 4
Figure 4
LARIAT clusters do not affect bipolar spindle assembly and mitotic progression. Clustering effect on mitotic progression was analyzed through live-imaging of Drosophila S2 cells expressing GFP, mCherry-α-Tubulin (A) alone, and co-transfected with CIBN-MP and Flag-CRY2-VHH (B). The 488 nm laser used to image GFP triggered clustering since the prophase stage. LARIAT expression was confirmed by measuring GFP coefficient of variation in the first three frames of each movie. (C) Graph shows average mitotic timing ± SD. Mitotic timing is defined as the time it takes for a cell to progress from nuclear envelope breakdown (NEB) to anaphase onset (AO). Not significant (ns) p = 0.2149 (Mann-Whitney test).
Figure 5
Figure 5
GFP-Mps1 is efficiently trapped in LARIAT clusters. Clustering was analyzed through live-imaging of Drosophila S2 cells expressing GFP-Mps1, mCherry-α-Tubulin, CIBN-MP, and RFP-CRY2-VHH. The 488 nm laser used to image GFP-Mps1 from timepoint 0 onwards triggered clustering. (A) Representative stills and (B) intensity profiles for GFP-Mps1 and RFP-CRY2-VHH/mCherry-α-Tubulin along the orange dashed line are shown. (C) Representative stills of GFP-Mps1, mCherry-α-Tubulin, CIBN-MP, and Flag-CRY2-VHH transfected cells analyzed through live imaging during cell division. (D) Graph shows median mitotic timing ± 95% confidence interval. Mitotic timing is defined as the time it takes for a cell to progress from nuclear envelope breakdown (NEB) to anaphase onset (AO). GFP-Mps1 levels were determined by measuring GFP fluorescence in the cell cytoplasm in the first frame and LARIAT clustering was confirmed by measuring the GFP-Mps1 coefficient of variation in the first three frames of each movie. Red circles in the graph represent cells that did not exit mitosis during the time they were imaged. ** p < 0.001, * p < 0.05 (Mann-Whitney test).
Figure 6
Figure 6
High levels of LARIAT delocalize membrane-associated Lgl-GFP. (A,B) Representative single z-sections and (A’,B’) respective kymographs of Drosophila S2 cells transiently transfected with Lgl-GFP, CIBN-MP, and RFP-CRY2-VHH expressing (A,A’) higher or (B,B’) lower levels of CRY2 relative to Lgl. (C) Dispersion plot for average Lgl-GFP and RFP-CRY2-VHH signal intensity in cells in which Lgl left (blue) or remained in (red) the cortex after clustering. Each dot represents a single cell.
Figure 7
Figure 7
LARIAT detects aPKC and Par6 interaction in single cells. Representative timepoints of Drosophila S2 cells expressing Par6-RFP, CIBN-MP, Flag-CRY2-VHH, and (A) GFP-aPKC or (C) GFP-aPKCΔN analyzed through live-imaging. (B,D) Par6-RFP and (B) GFP-aPKC or (D) GFP-aPKCΔN clustering is represented by the coefficient of variation of cytoplasm fluorescence. Graphs display mean ± SD. n ≥ 15 cells for each condition.

Similar articles

Cited by

References

    1. Bettencourt-Dias M., Giet R., Sinka R., Mazumdar A., Lock W.G., Balloux F., Zafiropoulos P.J., Yamaguchi S., Winter S., Carthew R.W., et al. Genome-wide survey of protein kinases required for cell cycle progression. Nature. 2004;432:980–987. doi: 10.1038/nature03160. - DOI - PubMed
    1. Goshima G., Wollman R., Goodwin S.S., Zhang N., Scholey J.M., Vale R.D., Stuurman N. Genes required for mitotic spindle assembly in Drosophila S2 cells. Science. 2007;316:417–421. doi: 10.1126/science.1141314. - DOI - PMC - PubMed
    1. Rogers S.L., Rogers G.C. Culture of Drosophila S2 cells and their use for RNAi-mediated loss-of-function studies and immunofluorescence microscopy. Nat. Protoc. 2008;3:606–611. doi: 10.1038/nprot.2008.18. - DOI - PubMed
    1. Moutinho-Pereira S., Matos I., Maiato H. Drosophila S2 cells as a model system to investigate mitotic spindle dynamics, architecture, and function. Methods Cell. Biol. 2010;97:243–257. doi: 10.1016/S0091-679X(10)97014-3. - DOI - PubMed
    1. Heigwer F., Port F., Boutros M. RNA Interference (RNAi) Screening in Drosophila. Genetics. 2018;208:853–874. doi: 10.1534/genetics.117.300077. - DOI - PMC - PubMed

Publication types

Substances

LinkOut - more resources