. 2019 Apr;244(6):471-483.
doi: 10.1177/1535370219828703. Epub 2019 Feb 13.

A mole rat's gut microbiota suggests selective influence of diet on microbial niche space and evolution

Affiliations

A mole rat's gut microbiota suggests selective influence of diet on microbial niche space and evolution

Linda Ren et al. Exp Biol Med (Maywood). 2019 Apr.

Abstract

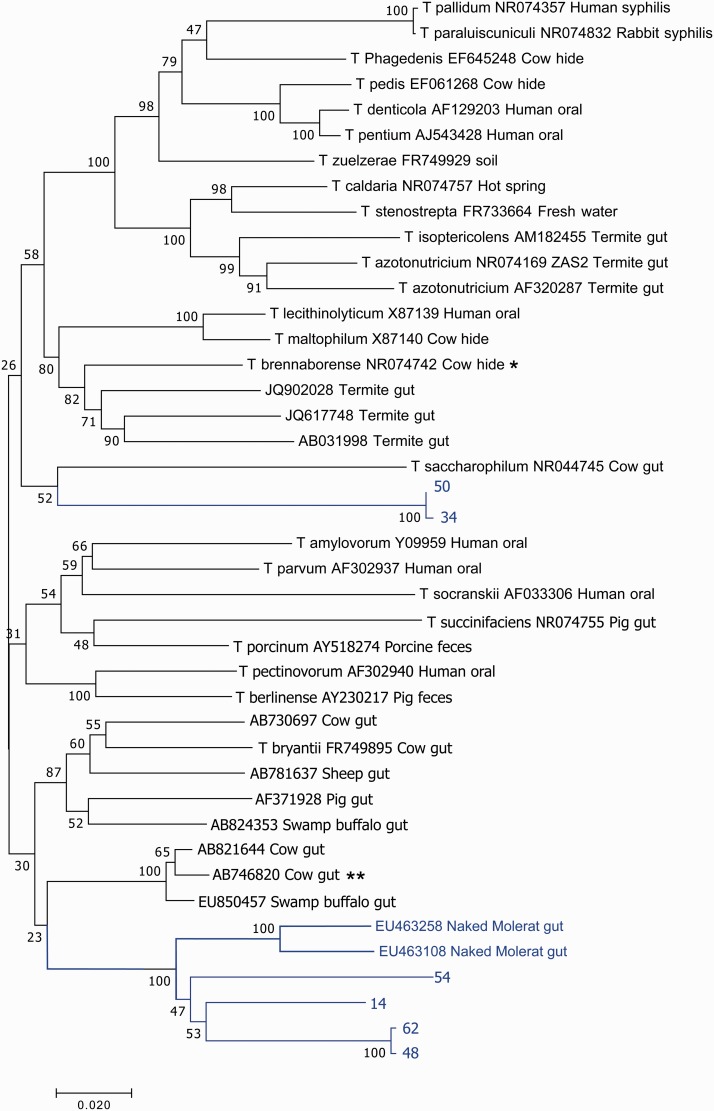
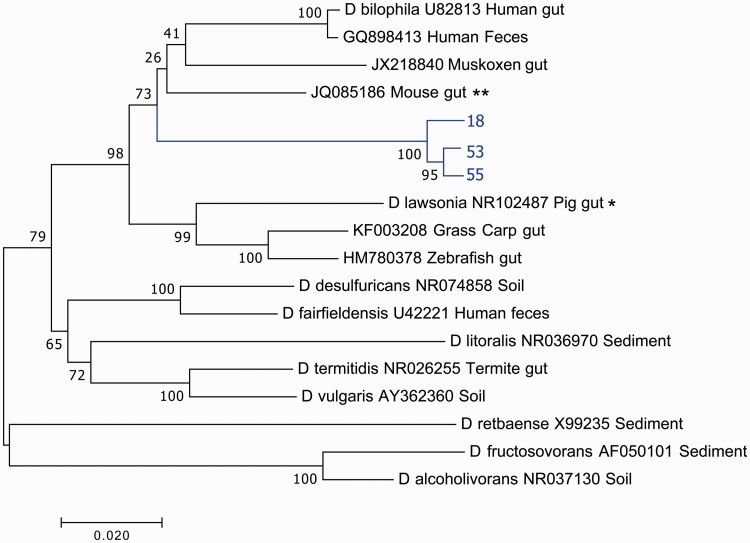
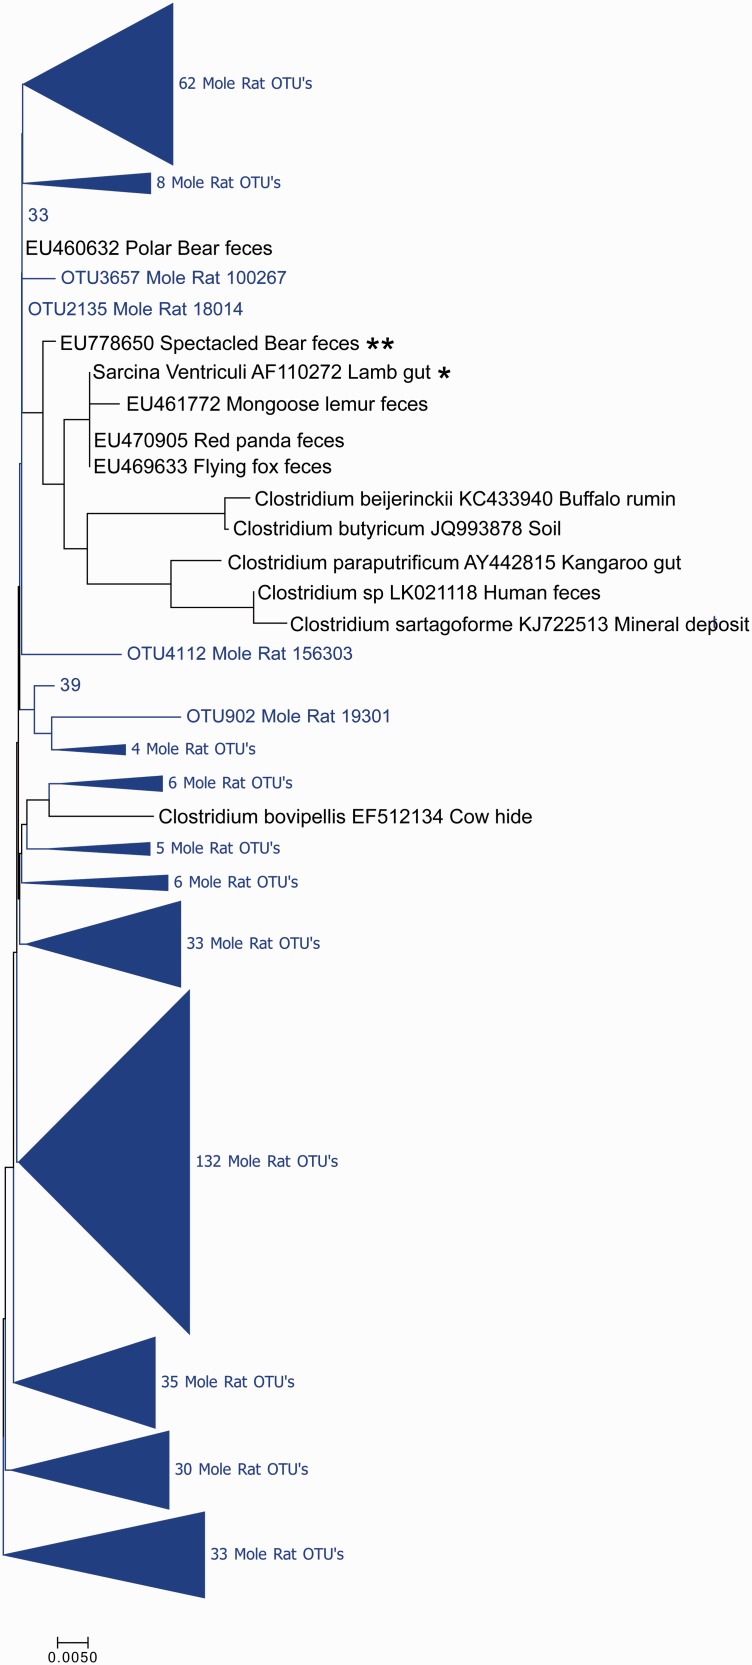
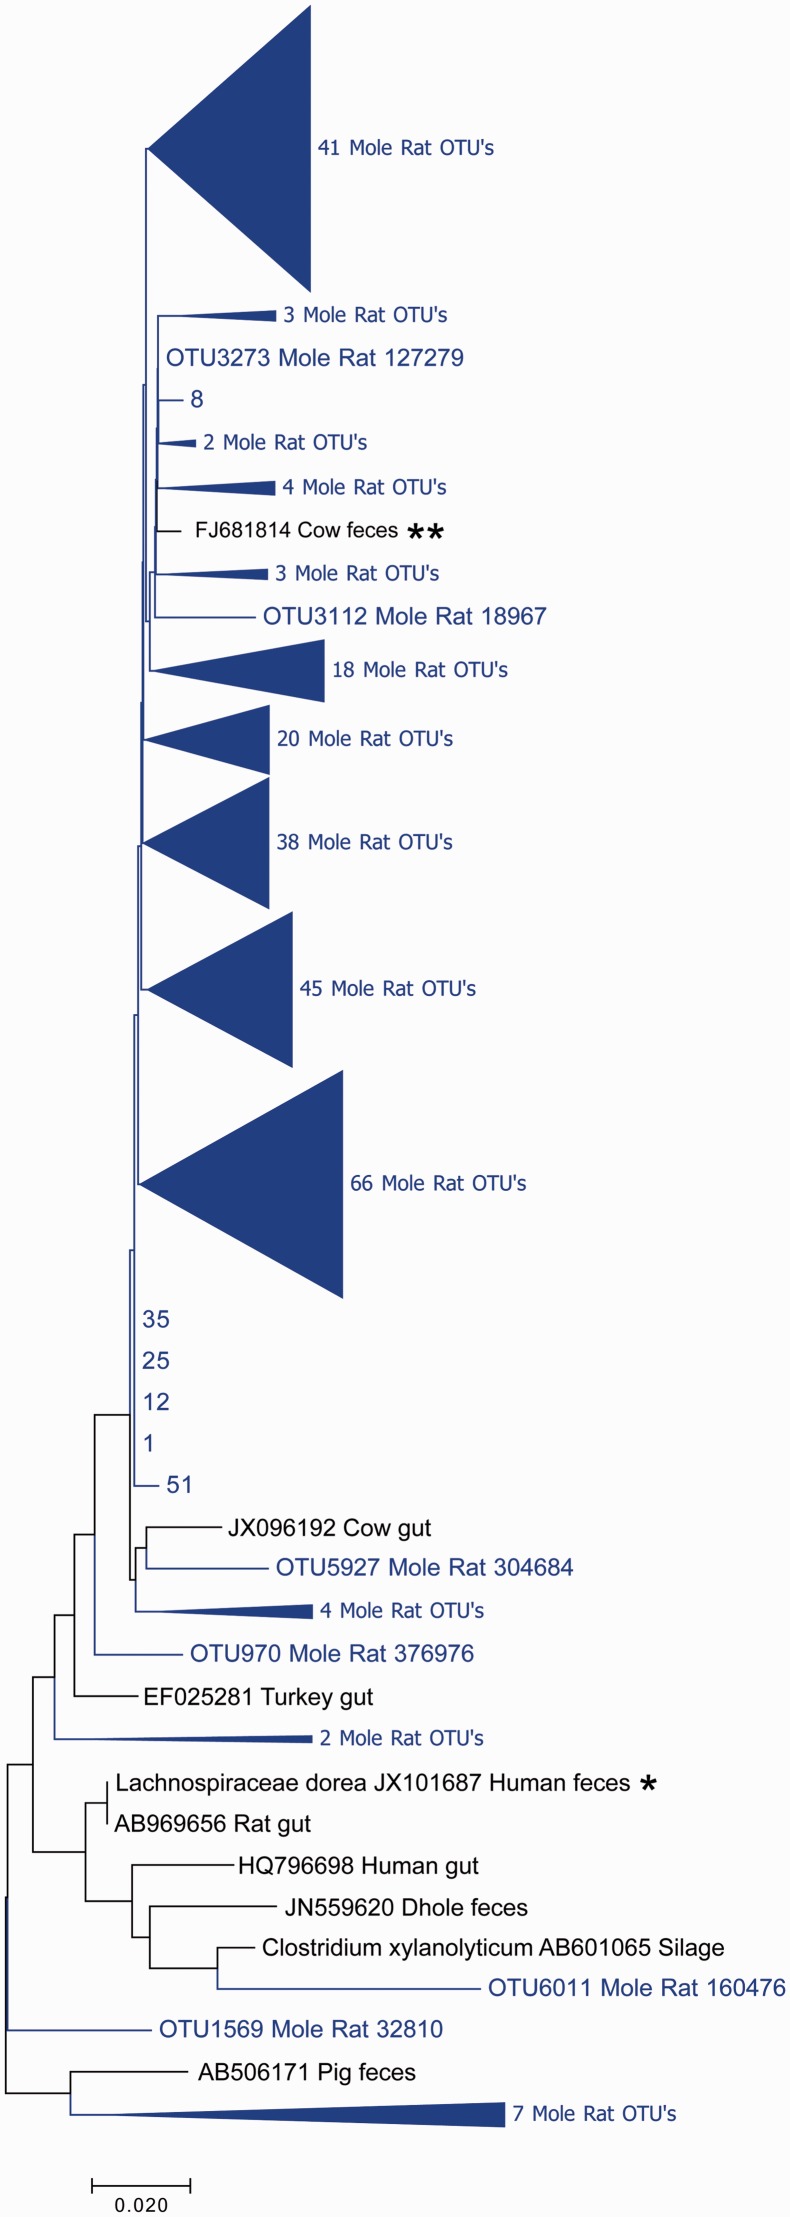
The composition of the microbiota is of critical importance for health and disease, and is receiving increased scientific and medical scrutiny. Of particular interest is the role of changing diets as a function of agriculture and, perhaps to an even greater extent, modern food processing. To probe the connection between diet and the gut's microbial community, the microbiota from a mole rat, a rodent with a relatively unusual diet, was analyzed in detail, and the microbes found were compared with previously identified organisms. The results show evidence of an adaptive radiation of some microbial clades, but relative stability in others. This suggests that the microbiota, like the genome, carries with it housekeeping components as well as other components which can evolve rapidly when the environment changes. This study provides a very broad view of the niche space in the gut and how factors such as diet might influence that niche space.

Keywords: Diet; evolution; fiber; microbiota; mole rat; niche.


Figures

Figure 1.
Figure 1.
Treponema phylogenetic tree constructed with full length 16S rRNA sequences. Sequences from the mole rat are shown in light color, with nearest neighbors in black. The evolutionary history was inferred using the Neighbor-Joining method. The optimal tree with the sum of branch length = 1.92483810 is shown. The percentage of replicate trees in which the associated taxa clustered together in the bootstrap test (1000 replicates) are shown next to the branches. The tree is drawn to scale, with branch lengths in the same units as those of the evolutionary distances used to infer the phylogenetic tree. The evolutionary distances were computed using the Maximum Composite Likelihood method and are in the units of the number of base substitutions per site. The analysis involved 42 nucleotide sequences. All positions containing gaps and missing data were eliminated. There were a total of 1231 positions in the final dataset. Evolutionary analyses were conducted in MEGA7. *Sequence with nearest identity to a sequence from mole rat gut, used for presumptive identification of clade. **Sequence with nearest identity to sequences from mole rat gut (from an unknown bacterial species and therefore not used for identification of clade). (A color version of this figure is available in the online journal.)
Figure 2.
Figure 2.
Treponema phylogenetic tree constructed with V4 16S rRNA sequences. Sequences from the mole rat are shown in light color. The evolutionary history was inferred using the Neighbor-Joining method. The optimal tree with the sum of branch length = 5.09844727 is shown. The tree is drawn to scale, with branch lengths in the same units as those of the evolutionary distances used to infer the phylogenetic tree. The evolutionary distances were computed using the Maximum Composite Likelihood method and are in the units of the number of base substitutions per site. The analysis involved 168 nucleotide sequences. All positions containing gaps and missing data were eliminated. There were a total of 203 positions in the final dataset. Evolutionary analyses were conducted in MEGA7. Bootstrap values were typically low (< 50) and are not shown. *Sequence with nearest identity to a sequence from mole rat gut, used for presumptive identification of clade. **Sequence with nearest identity to sequences from mole rat gut (from an unknown bacterial species and therefore not used for identification of clade). (A color version of this figure is available in the online journal.)
Figure 3.
Figure 3.
Desulfovibrio phylogenetic tree constructed with full length 16S rRNA sequences. Sequences from the mole rat are shown in light color, with nearest neighbors in black. The evolutionary history was inferred using the Neighbor-Joining method. The optimal tree with the sum of branch length = 0.69530967 is shown. The percentage of replicate trees in which the associated taxa clustered together in the bootstrap test (1000 replicates) are shown next to the branches. The tree is drawn to scale, with branch lengths in the same units as those of the evolutionary distances used to infer the phylogenetic tree. The evolutionary distances were computed using the Maximum Composite Likelihood method and are in the units of the number of base substitutions per site. The analysis involved 18 nucleotide sequences. All positions containing gaps and missing data were eliminated. There were a total of 1381 positions in the final dataset. Evolutionary analyses were conducted in MEGA7. *Sequence with nearest identity to a sequence from mole rat gut, used for presumptive identification of clade. **Sequence with nearest identity to sequences from mole rat gut (from an unknown bacterial species and therefore not used for identification of clade). (A color version of this figure is available in the online journal.)
Figure 4.
Figure 4.
Desulfovibrio phylogenetic tree constructed with V4 16S rRNA sequences. Sequences from the mole rat are shown in light color, with nearest neighbors in black. The evolutionary history was inferred using the Neighbor-Joining method. The optimal tree with the sum of branch length = 3.39524189 is shown. The tree is drawn to scale, with branch lengths in the same units as those of the evolutionary distances used to infer the phylogenetic tree. The evolutionary distances were computed using the Maximum Composite Likelihood method and are in the units of the number of base substitutions per site. The analysis involved 157 nucleotide sequences. All positions containing gaps and missing data were eliminated. There were a total of 224 positions in the final dataset. Evolutionary analyses were conducted in MEGA7 (19). Bootstrap values were typically low (< 50) and are not shown. *Sequence with nearest identity to a sequence from mole rat gut, used for presumptive identification of clade. **Sequence with nearest identity to sequences from mole rat gut (from an unknown bacterial species and therefore not used for identification of clade). (A color version of this figure is available in the online journal.)
Figure 5.
Figure 5.
Sarcina phylogenetic tree constructed with full length 16S rRNA sequences. Sequences from the mole rat are shown in light color, with nearest neighbors in black. The evolutionary history was inferred using the Neighbor-Joining method. The optimal tree with the sum of branch length = 0.17475581 is shown. The percentage of replicate trees in which the associated taxa clustered together in the bootstrap test (1000 replicates) are shown next to the branches. The tree is drawn to scale, with branch lengths in the same units as those of the evolutionary distances used to infer the phylogenetic tree. The evolutionary distances were computed using the Maximum Composite Likelihood method and are in the units of the number of base substitutions per site. The analysis involved 14 nucleotide sequences. All positions containing gaps and missing data were eliminated. There were a total of 1354 positions in the final dataset. Evolutionary analyses were conducted in MEGA7. *Sequence with nearest identity to a sequence from mole rat gut, used for presumptive identification of clade. **Sequence with nearest identity to sequences from mole rat gut (from an unknown bacterial species and therefore not used for identification of clade). (A color version of this figure is available in the online journal.)
Figure 6.
Figure 6.
Sarcina phylogenetic tree constructed with V4 16S rRNA sequences. Sequences from the mole rat are shown in light color, with nearest neighbors in black. The evolutionary history was inferred using the Neighbor-Joining method. The optimal tree with the sum of branch length = 6.23522357 is shown. The tree is drawn to scale, with branch lengths in the same units as those of the evolutionary distances used to infer the phylogenetic tree. The evolutionary distances were computed using the Maximum Composite Likelihood method and are in the units of the number of base substitutions per site. The analysis involved 372 nucleotide sequences. All positions containing gaps and missing data were eliminated. There were a total of 185 positions in the final dataset. Evolutionary analyses were conducted in MEGA7. Bootstrap values were typically low (< 50) and are not shown. *Sequence with nearest identity to a sequence from mole rat gut, used for presumptive identification of clade. **Sequence with nearest identity to sequences from mole rat gut (from an unknown bacterial species and therefore not used for identification of clade). (A color version of this figure is available in the online journal.)
Figure 7.
Figure 7.
Lachnospiraceae phylogenetic tree constructed with full length 16S rRNA sequences. Sequences from the mole rat are shown in light color, with nearest neighbors in black. The evolutionary history was inferred using the Neighbor-Joining method.The optimal tree with the sum of branch length = 0.25150654 is shown. The percentage of replicate trees in which the associated taxa clustered together in the bootstrap test (1000 replicates) are shown next to the branches. The tree is drawn to scale, with branch lengths in the same units as those of the evolutionary distances used to infer the phylogenetic tree. The evolutionary distances were computed using the Maximum Composite Likelihood method and are in the units of the number of base substitutions per site. The analysis involved 15 nucleotide sequences. All positions containing gaps and missing data were eliminated. There were a total of 1277 positions in the final dataset. Evolutionary analyses were conducted in MEGA7. *Sequence with nearest identity to a sequence from mole rat gut, used for presumptive identification of clade. **Sequence with nearest identity to sequences from mole rat gut (from an unknown bacterial species and therefore not used for identification of clade). (A color version of this figure is available in the online journal.)
Figure 8.
Figure 8.
Lachnospiraceae phylogenetic tree constructed with V4 16S rRNA sequences. Sequences from the mole rat are shown in light color, with nearest neighbors in black. The evolutionary history was inferred using the Neighbor-Joining method. The optimal tree with the sum of branch length = 6.81596946 is shown. The tree is drawn to scale, with branch lengths in the same units as those of the evolutionary distances used to infer the phylogenetic tree. The evolutionary distances were computed using the Maximum Composite Likelihood method and are in the units of the number of base substitutions per site. The analysis involved 316 nucleotide sequences. All positions containing gaps and missing data were eliminated. There were a total of 204 positions in the final dataset. Evolutionary analyses were conducted in MEGA7. Bootstrap values were typically low (<50) and are not shown. *Sequence with nearest identity to a sequence from mole rat gut, used for presumptive identification of clade. **Sequence with nearest identity to sequences from mole rat gut (from an unknown bacterial species and therefore not used for identification of clade). (A color version of this figure is available in the online journal.)

References

    1. David LA, Maurice CF, Carmody RN, Gootenberg DB, Button JE, Wolfe BE, Ling AV, Devlin AS, Varma Y, Fischbach MA, Biddinger SB, Dutton RJ, Turnbaugh PJ. Diet rapidly and reproducibly alters the human gut microbiome. Nature 2014; 505:559–63 - PMC - PubMed
    1. Muegge BD, Kuczynski J, Knights D, Clemente JC, Gonzalez A, Fontana L, Henrissat B, Knight R, Gordon JI. Diet drives convergence in gut microbiome functions across mammalian phylogeny and within humans. Science 2011; 332:970–4 - PMC - PubMed
    1. Ley RE, Hamady M, Lozupone C, Turnbaugh PJ, Ramey RR, Bircher JS, Schlegel ML, Tucker TA, Schrenzel MD, Knight R, Gordon JI. Evolution of mammals and their gut microbes. Science 2008; 320:1647–51 - PMC - PubMed
    1. McKenney EA, Rodrigo A, Yoder AD. Patterns of gut bacterial colonization in three primate species. PLoS One 2015; 10:e0124618. - PMC - PubMed
    1. Li T, Long M, Li H, Gatesoupe FJ, Zhang X, Zhang Q, Feng D, Li A. Multi-omics analysis reveals a correlation between the host phylogeny, gut microbiota and metabolite profiles in cyprinid fishes. Front Microbiol 2017; 8:454. - PMC - PubMed

Publication types

LinkOut - more resources