. 2019 May;16(5):661-674.
doi: 10.1080/15476286.2019.1581597. Epub 2019 Mar 5.

Time resolved gene expression analysis during tamoxifen adaption of MCF-7 cells identifies long non-coding RNAs with prognostic impact

Affiliations

Time resolved gene expression analysis during tamoxifen adaption of MCF-7 cells identifies long non-coding RNAs with prognostic impact

Martin Porsch et al. RNA Biol. 2019 May.

Abstract

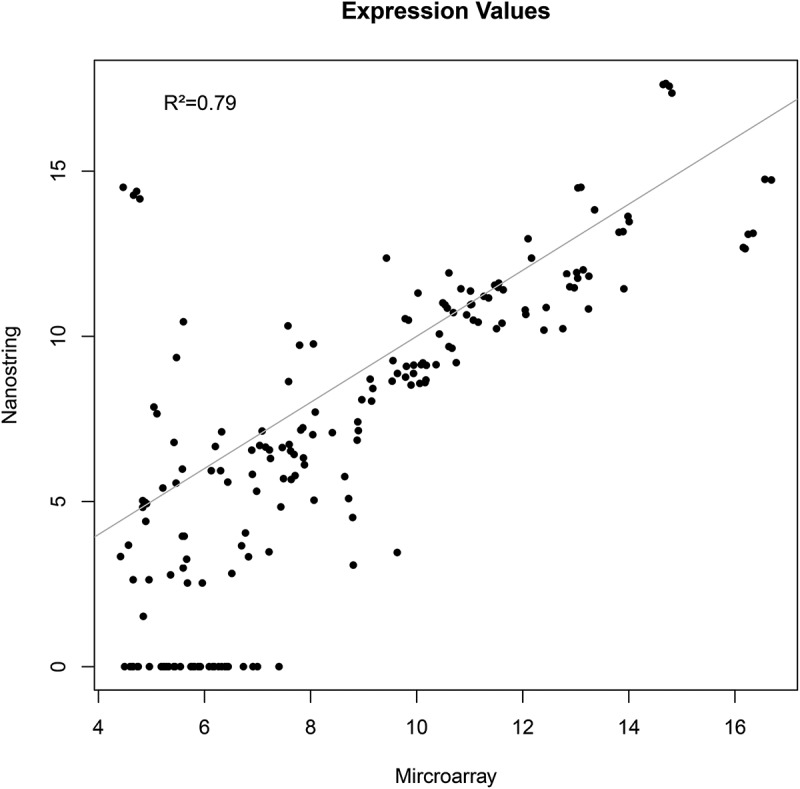
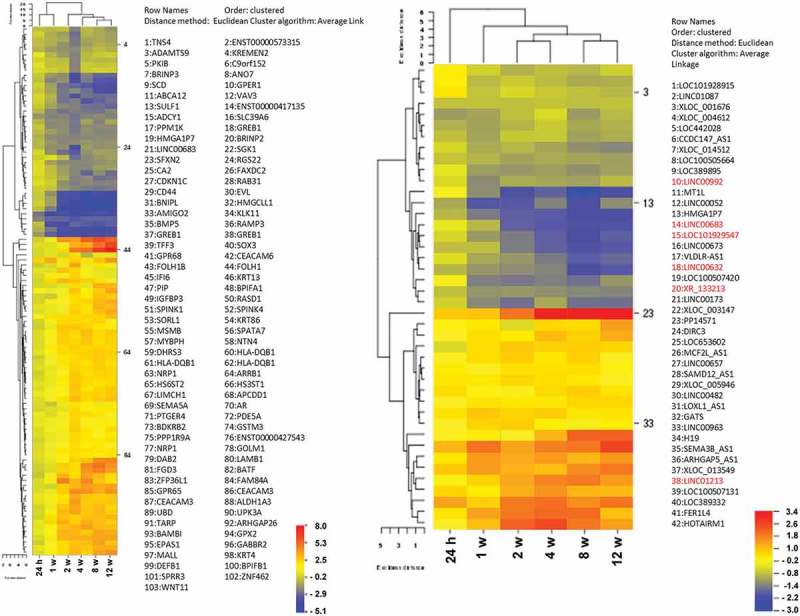
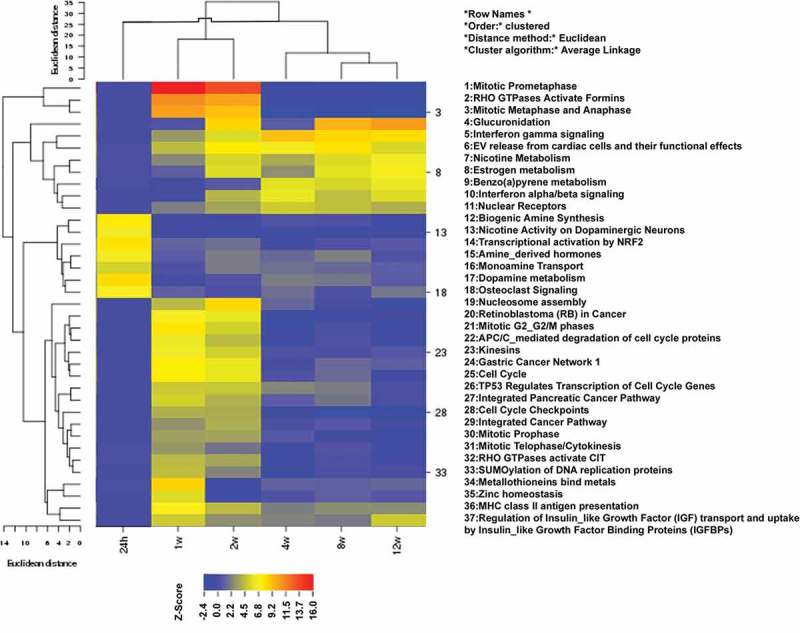
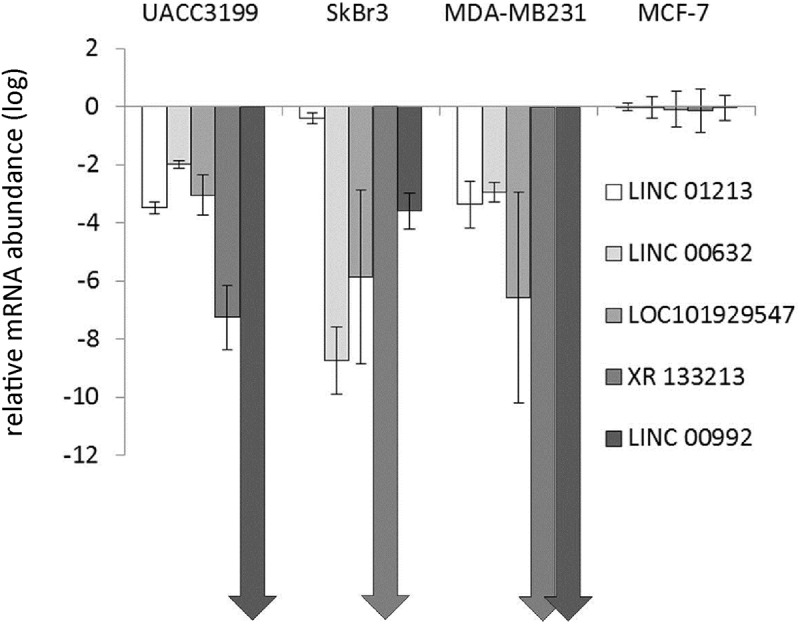
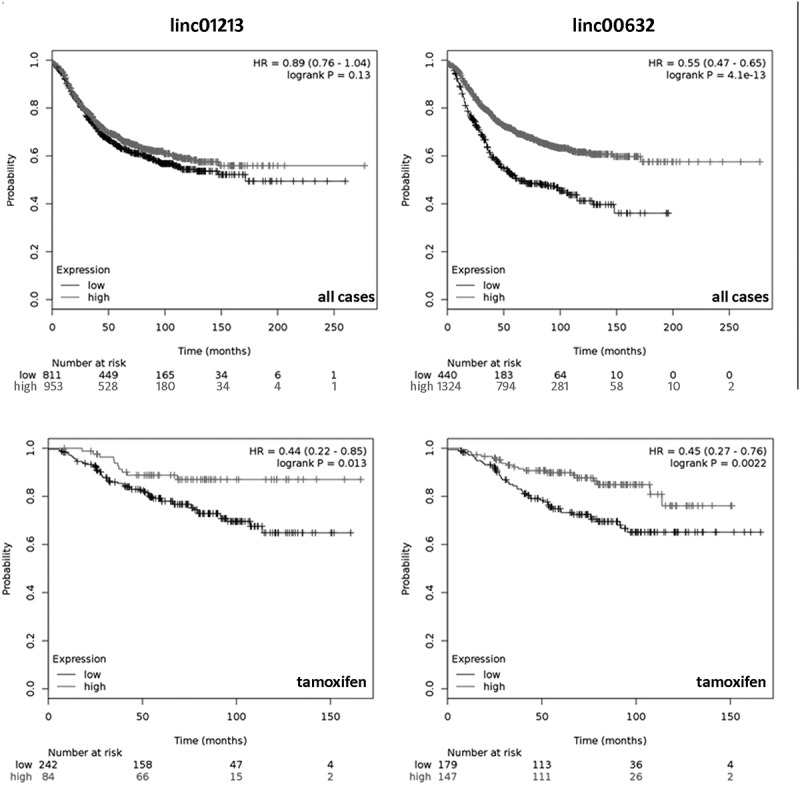
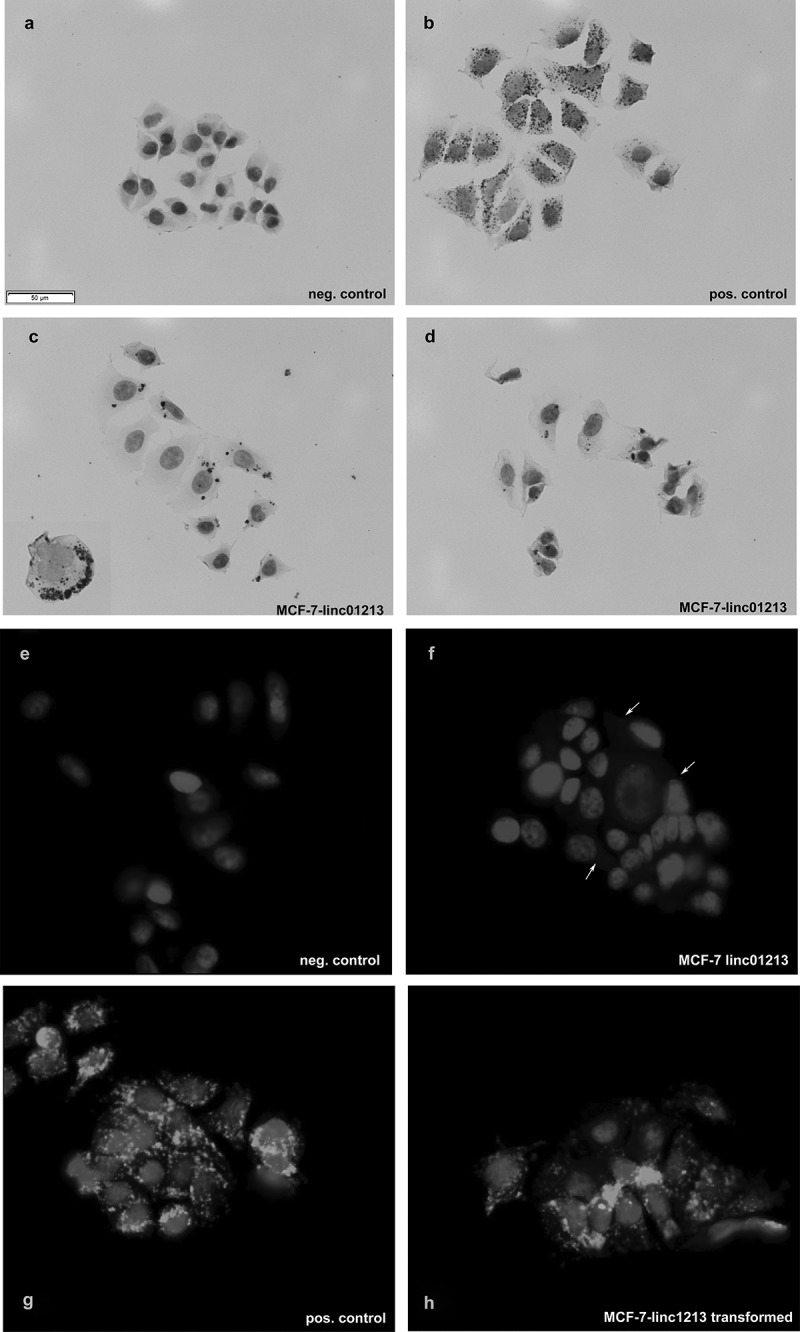
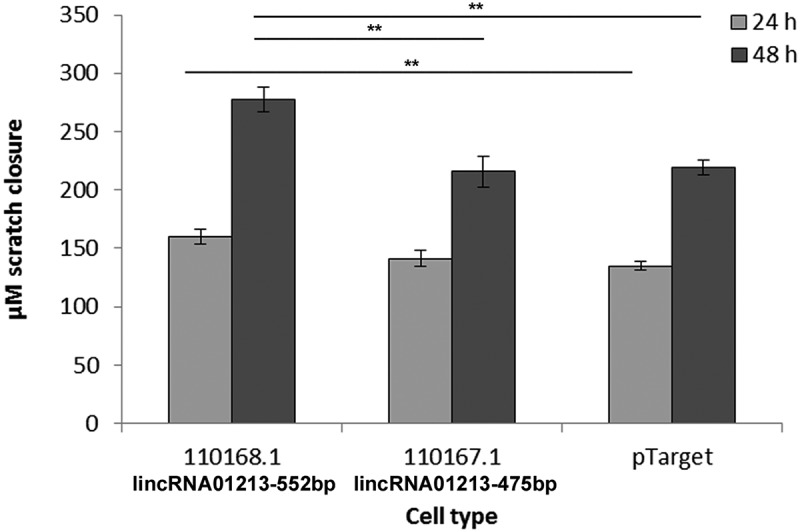
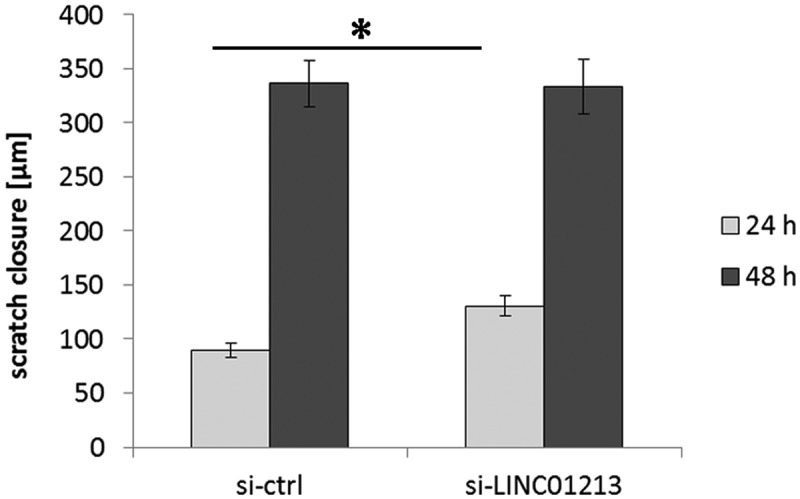
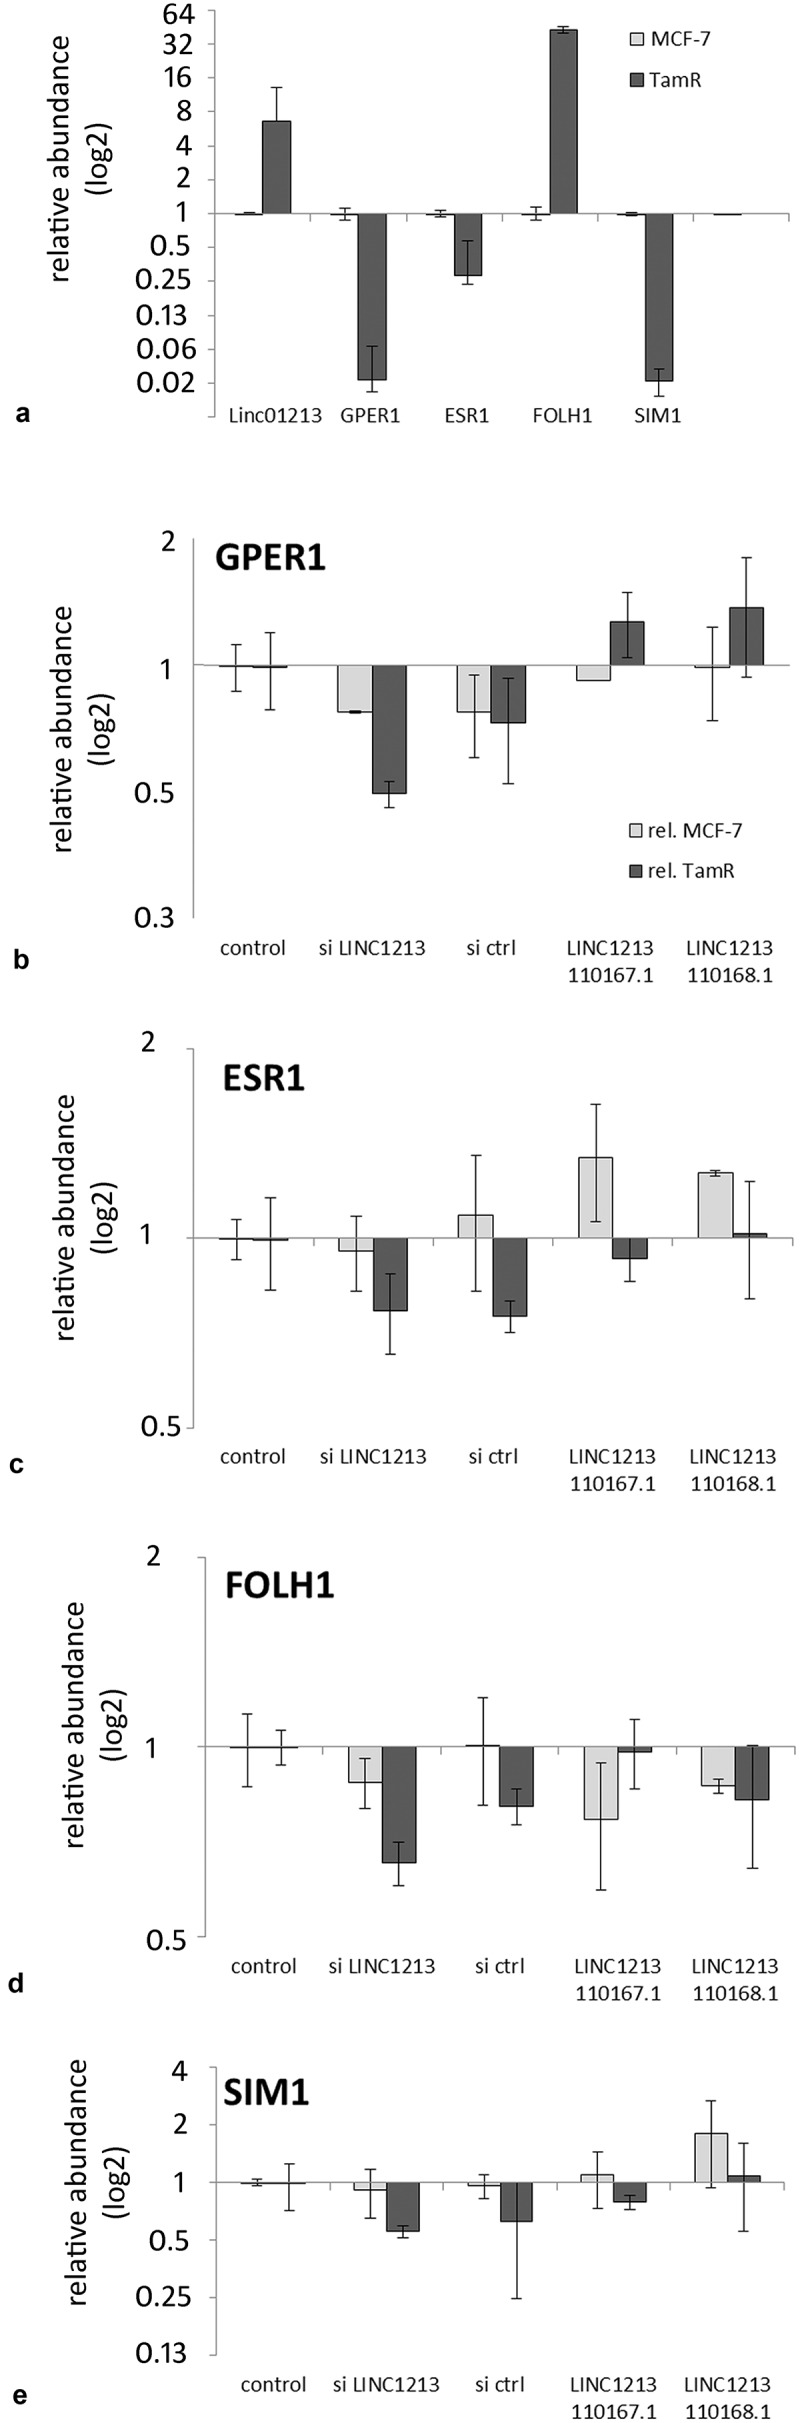
Acquired tamoxifen resistance is a persistent problem for the treatment of estrogen receptor positive, premenopausal breast cancer patients and predictive biomarkers are still elusive. We here analyzed gene expression changes in a cellular model to identify early and late changes upon tamoxifen exposure and thereby novel prognostic biomarkers. Estrogen receptor positive MCF-7 cells were incubated with 4OH-tamoxifen (10 nM) and gene expression analyzed by array hybridization during 12 weeks. Array results were confirmed by nCounter- and qRT-PCR technique. Pathway enrichment analysis revealed that early responses concerned mainly amine synthesis and NRF2-related signaling and evolved into a stable gene expression pattern within 4 weeks characterized by changes in glucuronidation-, estrogen metabolism-, nuclear receptor- and interferon signaling pathways. As a large number of long non coding RNAs was subject to regulation, we investigated 5 of these (linc01213, linc00632 linc0992, LOC101929547 and XR_133213) in more detail. From these, only linc01213 was upregulated but all were less abundant in estrogen-receptor negative cell lines (MDA-MB 231, SKBR-3 and UACC3199). In a web-based survival analysis linc01213 and linc00632 turned out to have prognostic impact. Linc01213 was investigated further by plasmid-mediated over-expression as well as siRNA down-regulation in MCF-7 cells. Nevertheless, this had no effect on proliferation or expression of tamoxifen regulated genes, but migration was increased. In conclusion, the cellular model identified a set of lincRNAs with prognostic relevance for breast cancer. One of these, linc01213 although regulated by 4OH-tamoxifen, is not a central regulator of tamoxifen adaption, but interferes with the regulation of migration.

Keywords: Breast cancer; biomarker; gene expression; long-non coding RNAs; tamoxifen.


Figures

Figure 1.
Figure 1.
Correlation of nCounter results with array hybridization data by using absolute expression values. 48 genes were selected on the basis of significant tamoxifen regulation in the array experiments. 12 RNA preparations used for array-experiments were then re-analyzed by using the nCounter elements chemistry.
Figure 2.
Figure 2.
GO analysis of ‘top 467’ 4OH-tamoxifen-regulated genes using ‘webgestalt’ demonstrating differences between early responses (24 h) and adapted cells (12 week exposure).
Figure 3.
Figure 3.
Cluster analysis. Left: 102 most regulated genes were selected from the combined ANOVA-lists and submitted to CIMMINER for Euclidian cluster analysis. Right: Euclidian cluster analysis of expression data for the 42 most significantly regulated lincRNAs (ANOVA). Red: lincRNA marked genes were re-analyzed by qRT-PCR.
Figure 4.
Figure 4.
Time-resolved pathway cluster analysis. Pathway enrichment analysis was done by using the pathvisio software for all transcripts at all time points and the obtained Z-Scores were clustered using CIMMINER. For clarity the 24 h time point was shifted to the beginning of the cluster although it clustered at a different position. Only the most significant 37 pathways are shown.
Figure 5.
Figure 5.
Relative abundance of lincRNAs in representative breast cancer cell lines as determined by qRT-PCR relative to RPL13. Data for MCF-7 were set to 1 and data shown as log2Fc values with standard deviation of 4 independent determinations. Arrows are shown when the lincRNA was below detection limit of the technique.
Figure 6.
Figure 6.
Kaplan Meier analysis of linc01213 (left panel) and linc00632 (right panel) performed by the KM-plotter online tool [32]. Upper panel shows all available cases, the lower panel depicts cases treated by endocrine therapy.
Figure 7.
Figure 7.
Overexpression of linc01213 in MCF-7 cells as shown by RNA in-situ hybridization detected either by DAB (a–d) or enhanced fluorescent detection (e–h). (a,e) negative control, (b,g) positive control, (f) linc01213 hybridization in control MCF-7 cells, C,D,H: linc01213 hybridization results in linc01213 over-expressing cells. In F some positive signals are marked by arrows for clarity. Scale bar represents 50 µm.
Figure 8.
Figure 8.
Analysis of cell migration of stably transformed MCF-7 cells by scratch assay. Cells were grown to confluence and then serum-starved for 24 h to stop cell divisions. After applying the scratches, cells were washed with serum-free medium and photographed every 24 h. Distance of the scratch margins was measured and difference to the time point 0 hours determined. Graph shows average of three independent experiments with 8 independent scratches each and standard error. **p < 0.01.
Figure 9.
Figure 9.
Scratch assay using siRNA treated MCF-7 cells. Data are average of 3 independent experiments. *p < 0.05.
Figure 10.
Figure 10.
Effect of transient over-expression and siRNA-mediated downregulation of the linc01213 in MCF-7 cells on the expression of 4OH-tamoxifen regulated genes. A: relative expression in MCF-7 and 4OH-tamoxifen adapted MCF-7 cells. Experiments were performed three times and average as well as standard deviation is shown in log2-scale.
Figure 11.
Figure 11.
Detection of linc01213 expression by RNA in-situ hybridization in breast cancer samples using a TSA-fluorescent dye. Some positive signals are marked by arrows for illustration. Scale bar represents 50 µm. (a) invasive carcinoma, no special type (NST), G2, ER-positive. (b); invasive carcinoma, no special type (NST), G2, ER-positive, after chemotherapy, regression grade (Sinn):1. (c) invasive carcinoma, no special type (NST), G3, triple negative. (d) invasive carcinoma, no special type (NST), G2, ER-positive. (e) lobular carcinoma, G2, ER-positive, (f) invasive carcinoma, no special type (NST), G1, ER-positive.

Similar articles

Cited by

References

    1. Servick K. Breast cancer: a world of differences. Science. 2014;343:1452–1453. - PubMed
    1. Rakha EA, Green AR. Molecular classification of breast cancer: what the pathologist needs to know. Pathology. 2017;49:111–119. - PubMed
    1. Kuroda H, Muroi N, Hayashi M, et al. Oestrogen receptor-negative/progesterone receptor-positive phenotype of invasive breast carcinoma in Japan: re-evaluated using immunohistochemical staining. Breast Cancer. 2018. - PMC - PubMed
    1. Anders C, Carey LA. Understanding and treating triple-negative breast cancer. Oncology. 2008;22:1233–1239; discussion 1239–1240, 1243. - PMC - PubMed
    1. Chia SK, Wolff AC. With maturity comes confidence: EBCTCG tamoxifen update. Lancet. 2011;378:747–749. - PubMed

Publication types