

Cerebral Autoregulation-Guided Optimal Blood Pressure in Sepsis-Associated Encephalopathy: A Case Series
- PMID: 30760173
- PMCID: PMC6692246
- DOI: 10.1177/0885066619828293
Cerebral Autoregulation-Guided Optimal Blood Pressure in Sepsis-Associated Encephalopathy: A Case Series
Abstract
Background: Impaired cerebral autoregulation and cerebral hypoperfusion may play a critical role in the high morbidity and mortality in patients with sepsis-associated encephalopathy (SAE). Bedside assessment of cerebral autoregulation may help individualize hemodynamic targets that optimize brain perfusion. We hypothesize that near-infrared spectroscopy (NIRS)-derived cerebral oximetry can identify blood pressure ranges that enhance autoregulation in patients with SAE and that disturbances in autoregulation are associated with severity of encephalopathy.
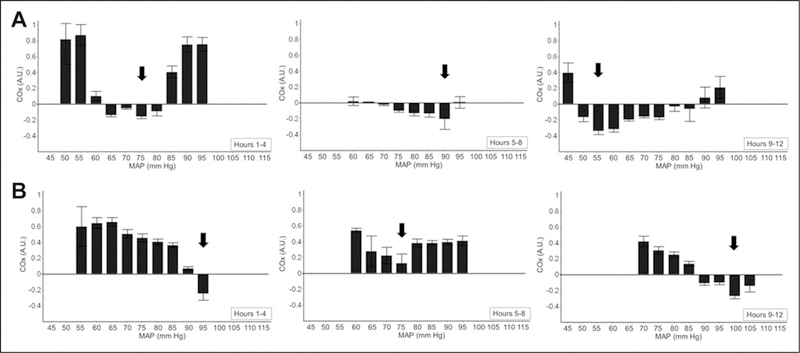
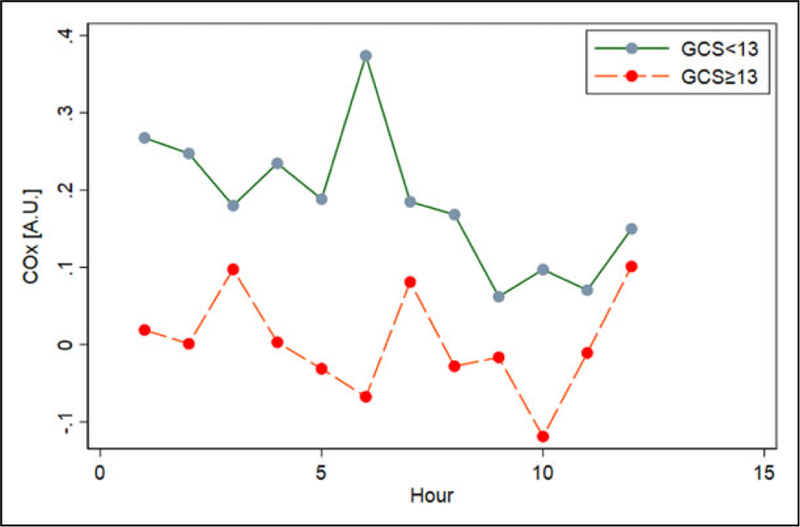
Methods: Adult patients with acute encephalopathy directly attributable to sepsis were followed using NIRS-based multimodal monitoring for 12 consecutive hours. We used the correlation in time between regional cerebral oxygen saturation and mean arterial pressure (MAP) to determine the cerebral oximetry index (COx) as a measure of cerebral autoregulation. Autoregulation curves were constructed for each patient with averaged COx values sorted by MAP in 3 sequential 4-hour periods; the optimal pressure (MAPOPT), defined as the MAP associated with most robust autoregulation (lowest COx), was identified in each period. Severity of encephalopathy was measured with Glasgow coma scale (GCS).
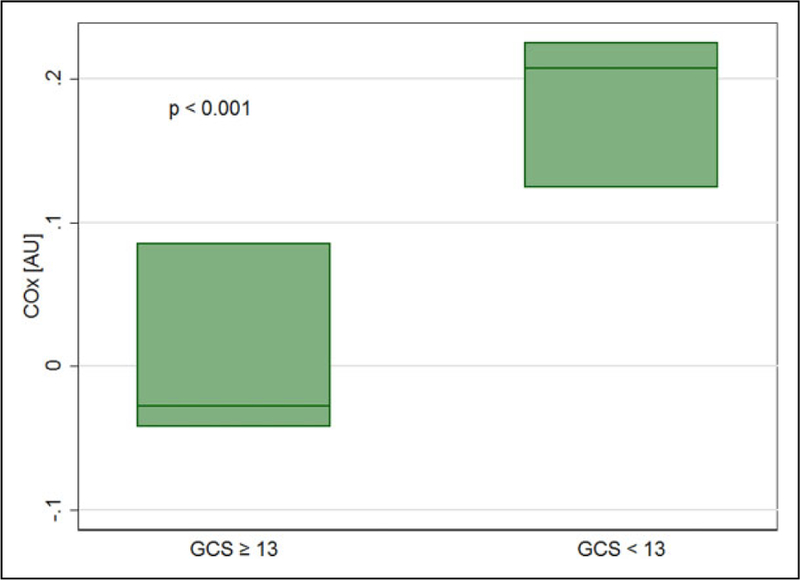
Results: Six patients with extracranial sepsis met the stringent criteria specified, including no pharmacological sedation or neurologic premorbidity. Optimal MAP was identified in all patients and ranged from 55 to 115 mmHg. Additionally, MAPOPT varied within individual patients over time during monitoring. Disturbed autoregulation, based on COx, was associated with worse neurologic status (GCS < 13) both with and without controlling for age and severity of sepsis (adjusted odds ratio [OR]: 2.11; 95% confidence interval [CI]: 1.77-2.52; P < .001; OR: 2.97; 95% CI: 1.63-5.43; P < .001).
Conclusions: In this high-fidelity group of patients with SAE, continuous, NIRS-based monitoring can identify blood pressure ranges that improve autoregulation. This is important given the association between cerebral autoregulatory function and severity of encephalopathy. Individualizing blood pressure goals using bedside autoregulation monitoring may better preserve cerebral perfusion in SAE than current practice.
Keywords: cerebral autoregulation; critical care; hemodynamics; multimodal monitoring; near-infrared spectroscopy; oximetry; sepsis; sepsis-associated encephalopathy.
Conflict of interest statement
Declaration of Conflicting Interests
The author(s) declared no potential conflicts of interest with respect to the research, authorship, and/or publication of this article.
Figures


Similar articles
-
Cerebrovascular autoregulation in pediatric moyamoya disease.Paediatr Anaesth. 2013 Jun;23(6):547-56. doi: 10.1111/pan.12140. Epub 2013 Mar 18. Paediatr Anaesth. 2013. PMID: 23506446 Free PMC article.
-
Validation of a stand-alone near-infrared spectroscopy system for monitoring cerebral autoregulation during cardiac surgery.Anesth Analg. 2013 Jan;116(1):198-204. doi: 10.1213/ANE.0b013e318271fb10. Epub 2012 Dec 7. Anesth Analg. 2013. PMID: 23223100 Free PMC article.
-
Validation of Near-Infrared Spectroscopy for Monitoring Cerebral Autoregulation in Comatose Patients.Neurocrit Care. 2017 Dec;27(3):362-369. doi: 10.1007/s12028-017-0421-8. Neurocrit Care. 2017. PMID: 28664392 Free PMC article.
-
Cerebral Blood Flow Autoregulation in Sepsis for the Intensivist: Why Its Monitoring May Be the Future of Individualized Care.J Intensive Care Med. 2018 Feb;33(2):63-73. doi: 10.1177/0885066616673973. Epub 2016 Oct 25. J Intensive Care Med. 2018. PMID: 27798314 Free PMC article. Review.
-
Journal of clinical monitoring and computing 2016 end of year summary: monitoring cerebral oxygenation and autoregulation.J Clin Monit Comput. 2017 Apr;31(2):241-246. doi: 10.1007/s10877-017-9980-7. Epub 2017 Jan 24. J Clin Monit Comput. 2017. PMID: 28120178 Free PMC article. Review.
Cited by
-
New Strategies to Optimize Hemodynamics for Sepsis-Associated Encephalopathy.J Pers Med. 2022 Nov 28;12(12):1967. doi: 10.3390/jpm12121967. J Pers Med. 2022. PMID: 36556188 Free PMC article.
-
The role of the peripheral system dysfunction in the pathogenesis of sepsis-associated encephalopathy.Front Microbiol. 2024 Jan 17;15:1337994. doi: 10.3389/fmicb.2024.1337994. eCollection 2024. Front Microbiol. 2024. PMID: 38298892 Free PMC article. Review.
-
L-valine derived from the gut microbiota protects sepsis-induced intestinal injury and negatively correlates with the severity of sepsis.Front Immunol. 2024 Jul 4;15:1424332. doi: 10.3389/fimmu.2024.1424332. eCollection 2024. Front Immunol. 2024. PMID: 39026673 Free PMC article.
-
Optimal target mean arterial pressure for patients with sepsis-associated encephalopathy: a retrospective cohort study.BMC Infect Dis. 2024 Sep 2;24(1):902. doi: 10.1186/s12879-024-09789-w. BMC Infect Dis. 2024. PMID: 39223467 Free PMC article.
-
Automated Pupillometry as an Assessment Tool for Intracranial Hemodynamics in Septic Patients.Cells. 2022 Jul 15;11(14):2206. doi: 10.3390/cells11142206. Cells. 2022. PMID: 35883649 Free PMC article.
References
MeSH terms
Grants and funding
LinkOut - more resources
Full Text Sources
Miscellaneous
