. 2019 Feb 13;20(1):132.
doi: 10.1186/s12864-019-5444-4.

The plastid and mitochondrial genomes of Eucalyptus grandis

Affiliations

The plastid and mitochondrial genomes of Eucalyptus grandis

Desre Pinard et al. BMC Genomics. .

Abstract

Background: Land plant organellar genomes have significant impact on metabolism and adaptation, and as such, accurate assembly and annotation of plant organellar genomes is an important tool in understanding the evolutionary history and interactions between these genomes. Intracellular DNA transfer is ongoing between the nuclear and organellar genomes, and can lead to significant genomic variation between, and within, species that impacts downstream analysis of genomes and transcriptomes.

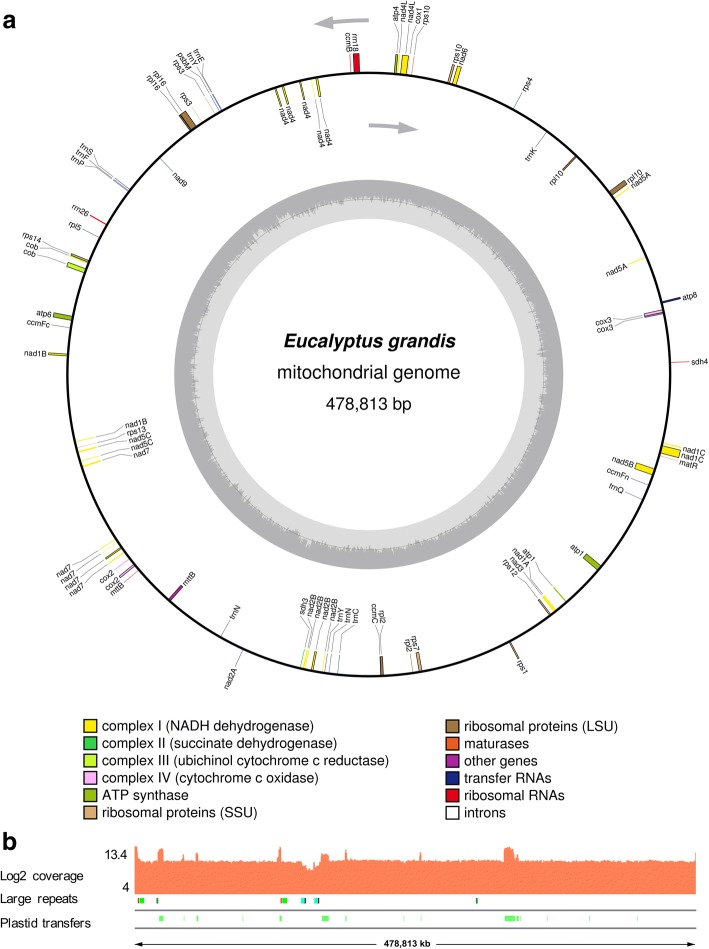
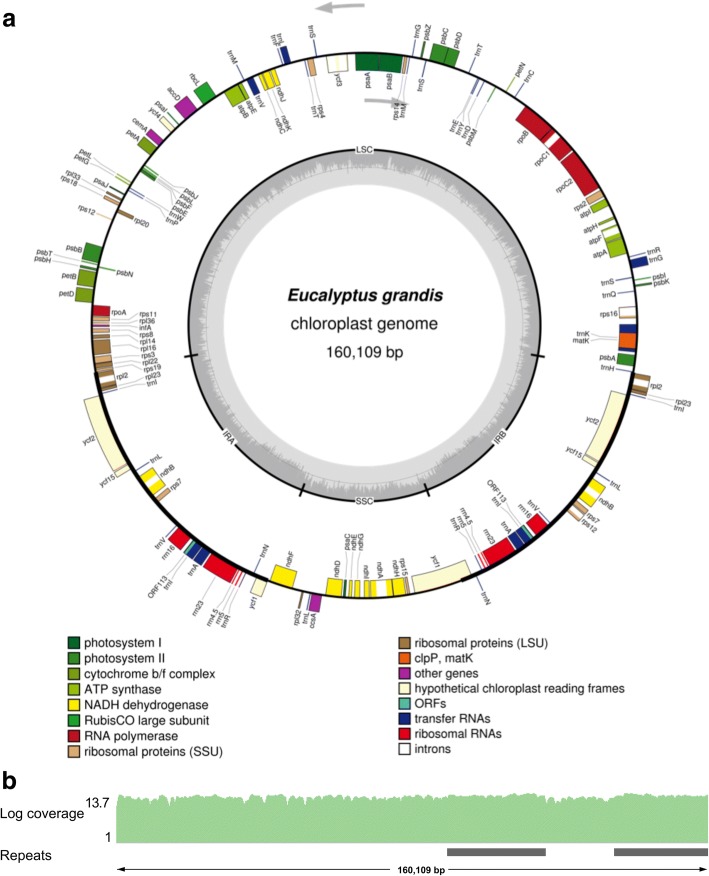
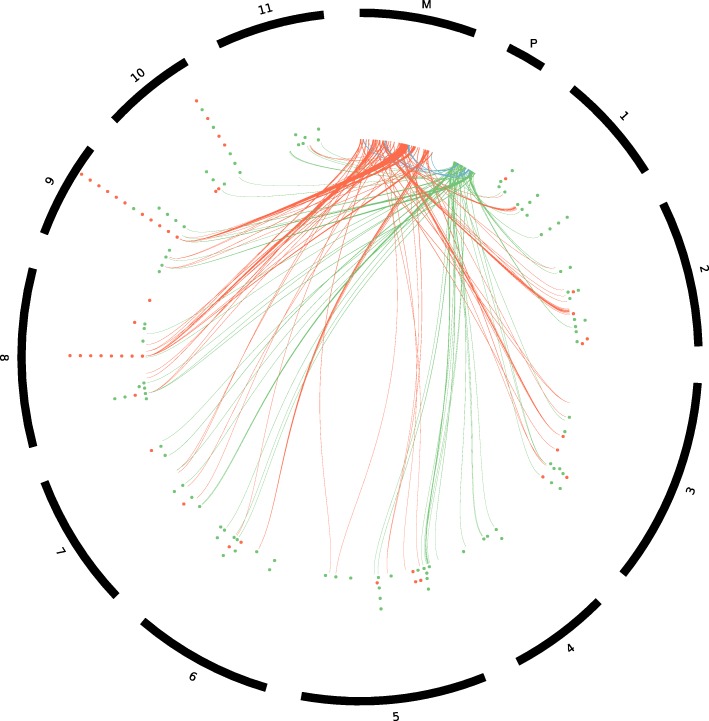
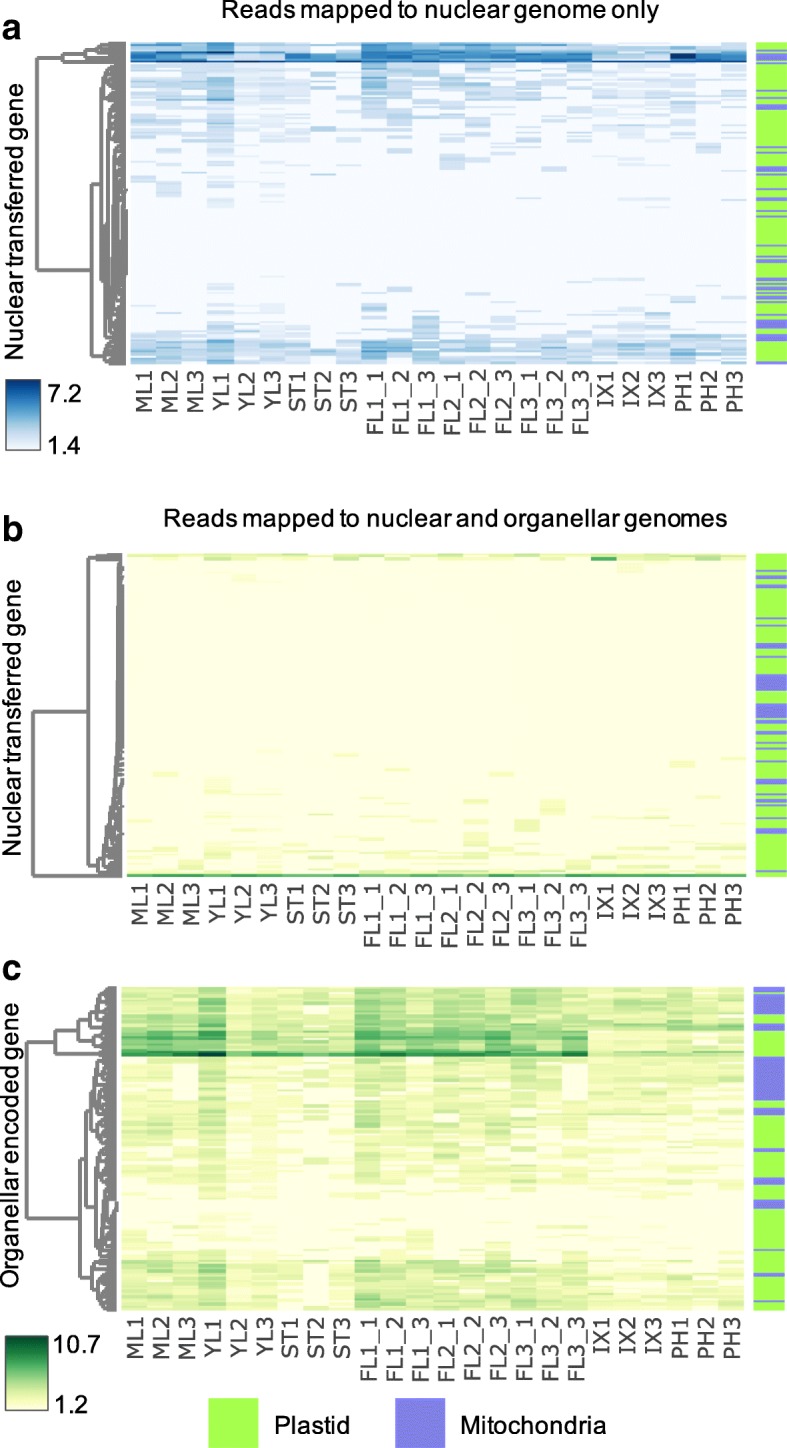
Results: In order to facilitate further studies of cytonuclear interactions in Eucalyptus, we report an updated annotation of the E. grandis plastid genome, and the second sequenced and annotated mitochondrial genome of the Myrtales, that of E. grandis. The 478,813 bp mitochondrial genome shows the conserved protein coding regions and gene order rearrangements typical of land plants. There have been widespread insertions of organellar DNA into the E. grandis nuclear genome, which span 141 annotated nuclear genes. Further, we identify predicted editing sites to allow for the discrimination of RNA-sequencing reads between nuclear and organellar gene copies, finding that nuclear copies of organellar genes are not expressed in E. grandis.

Conclusions: The implications of organellar DNA transfer to the nucleus are often ignored, despite the insight they can give into the ongoing evolution of plant genomes, and the problems they can cause in many applications of genomics. Future comparisons of the transcription and regulation of organellar genes between Eucalyptus genotypes may provide insight to the cytonuclear interactions that impact economically important traits in this widely grown lignocellulosic crop species.

Keywords: Chloroplast; Eucalyptus grandis; Mitochondria; Organelle genome; Plastid.


Conflict of interest statement

Ethics approval and consent to participate

Not applicable.

Consent for publication

Not applicable.

Competing interests

The authors declare that they have no competing interests.

Publisher’s Note

Springer Nature remains neutral with regard to jurisdictional claims in published maps and institutional affiliations.

Figures

Fig. 1
Fig. 1
Mitochondrial genome of E. grandis. a. Genomic features are shown facing outward (positive strand) and inward (negative strand) of the E. grandis mitochondrial genome represented as a circular molecule. The colour key shows the functional class of the mitochondrial genes, and introns are shown in white. The GC content is represented in the innermost circle. The figure was generated in OGDraw [86]. b. Genome coverage of E. grandis WGS reads in log2 scale (Log coverage) across the mitochondrial genome. WGS reads were mapped with Bowtie 2 [77] and visualized in IGV [78]. The second track (Large repeats) shows mitochondrial repeat regions > 1000 bp in length, with pairs in matching colours, all repeat pairs are direct repeats, with the exception of the repeat pair shown in teal. The third track (Plastid transfers) shows plastid to mitochondrial DNA transfers longer than 100 bp, with e-value > 1 × 10− 5 in green
Fig. 2
Fig. 2
Plastid genome of E. grandis. a. Genomic features are shown facing outward (positive strand) and inward (negative strand) of the circular E. grandis plastid genome. The colour key shows the functional class of the plastid genes, and introns are shown in white. The GC content is represented in the innermost circle with the inverted repeat (IR) and single copy (SC) regions indicated. The figure was generated in OGDraw [77]. b. Genome coverage of E. grandis WGS reads in log2 scale (Log coverage) across the plastid genome. WGS reads were mapped with Bowtie 2 [78] and visualized in IGV [79]. The position of the plastid inverted repeat regions are shown below (Repeats) in grey
Fig. 3
Fig. 3
DNA and gene transfer between nuclear and organellar genomes in E. grandis. The outer track shows the relevant chromosomes of E. grandis, the inner track shows complete coding regions of NUMTs and NUPTs in red and green respectively. The red (mitochondria) and green (plastid) dots indicate full length gene transfers from the organelles to the nuclear genome. The ribbons represent DNA transfers identified by BLAST analysis greater than 500 nt, with percentage identity greater than 75%. Red ribbons indicate mitochondrial to nuclear DNA transfer, green ribbons indicate plastid to nuclear DNA transfer, and blue ribbons represent plastid to mitochondrial DNA transfer. For clarity, the scale of the plastid and mitochondrial genome size has been increased by 100x
Fig. 4
Fig. 4
Poly-A selected RNA read abundance of nuclear genes with homology or annotation suggesting organellar transfer (a. and b.), and organellar encoded genes (c.) aligned to the nuclear genome only (blue) and the nuclear and organellar genomes of E. grandis (green). a. Variance stabilizing transformation (VST) counts of 141 organellar transferred genes in the nuclear genome of polyA selected RNA sequencing data aligned to the nuclear genome of E. grandis only. b. VST counts of full-length transferred genes in the nuclear genome of polyA selected RNA sequencing data aligned to the nuclear and organellar genomes of E. grandis simultaneously. c. VST counts of organellar encoded genes of polyA selected RNA sequencing data aligned to the nuclear and organellar genomes of E. grandis simultaneously. Row dendrograms on the left-hand side of all three heat maps show clustering of genes based on expression variation between tissues. Tissue samples are shown at the bottom edge of each heatmap, three biological replicates per tissue. Tissues are abbreviated as follows: Mature leaf (ML), young leaf (YL), shoot tips (ST), flowers stage 1 (FL_1), flowers stage 2 (FL_2), flowers stage 3 (FL_3), immature xylem (IX), and phloem (PH). The range of VST count values per heatmap are represented from low (white) to high (blue) for the polyA selected RNA mapping to the nuclear genome only, and from low (yellow) to high (green) for the polyA selected RNA mapping to the nuclear and organellar genomes. The bar on the right of the heatmaps shows the organellar origin of each gene, either plastid (transferred or encoded- green) or mitochondrial (transferred or encoded- blue)

References

    1. Benson DA, Cavanaugh M, Clark K, Karsch-Mizrachi I, Ostell J, Pruitt KD, et al. GenBank. Nucleic Acids Res. 2018;46:D41–D47. - PMC - PubMed
    1. Stiller JW. Plastid endosymbiosis, genome evolution and the origin of green plants. Trends Plant Sci. 2007;12:391–396. - PubMed
    1. Gualberto JM, Mileshina D, Wallet C, Niazi AK, Weber-lot F, Dietrich A. The plant mitochondrial genome : dynamics and maintenance. BMC Genomics. 2014;100:107–120. - PubMed
    1. Kleine T, Maier UG, Leister D. DNA transfer from organelles to the nucleus: the idiosyncratic genetics of endosymbiosis. Annu Rev Plant Biol. 2009;60:115–138. - PubMed
    1. Joseph B, Corwin JA, Züst T, Li B, Iravani M, Schaepman-Strub G, et al. Hierarchical nuclear and cytoplasmic genetic architectures for plant growth and defence within Arabidopsis. Plant Cell. 2013;25:1929–1945. - PMC - PubMed

LinkOut - more resources