. 2019 Feb 13;20(1):33.
doi: 10.1186/s13059-019-1647-x.

Dynamic inosinome profiles reveal novel patient stratification and gender-specific differences in glioblastoma

Affiliations

Dynamic inosinome profiles reveal novel patient stratification and gender-specific differences in glioblastoma

Domenico Alessandro Silvestris et al. Genome Biol. .

Abstract

Background: Adenosine-to-inosine (A-to-I) RNA editing is an essential post-transcriptional mechanism mediated by ADAR enzymes that have been recently associated with cancer.

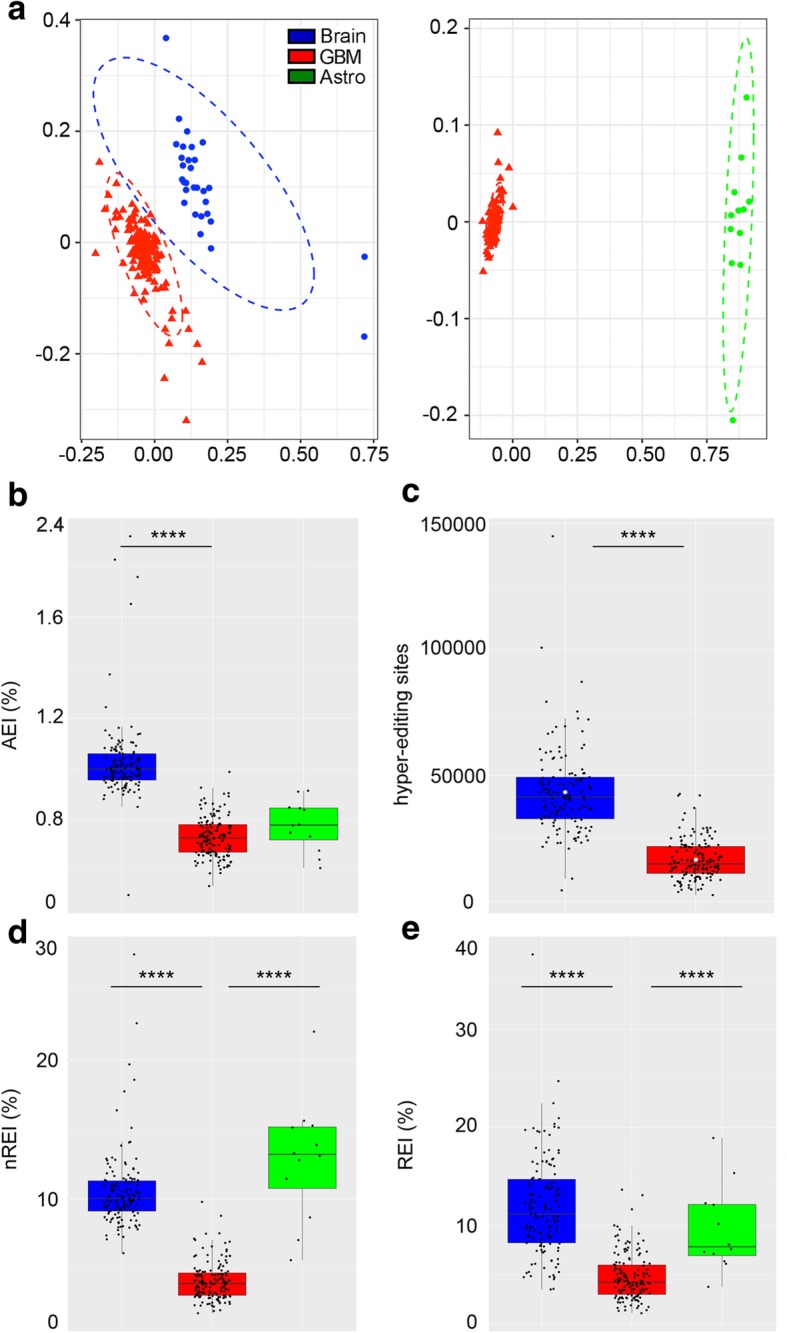
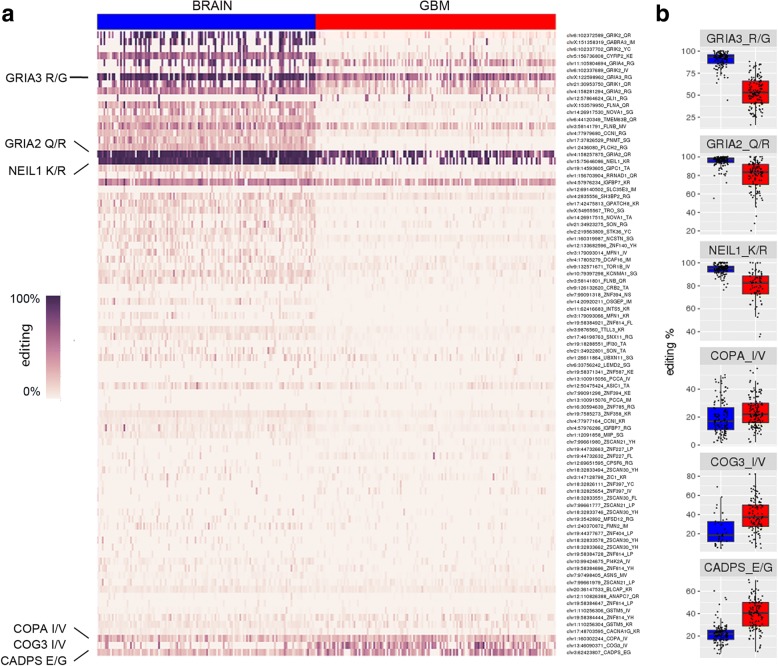
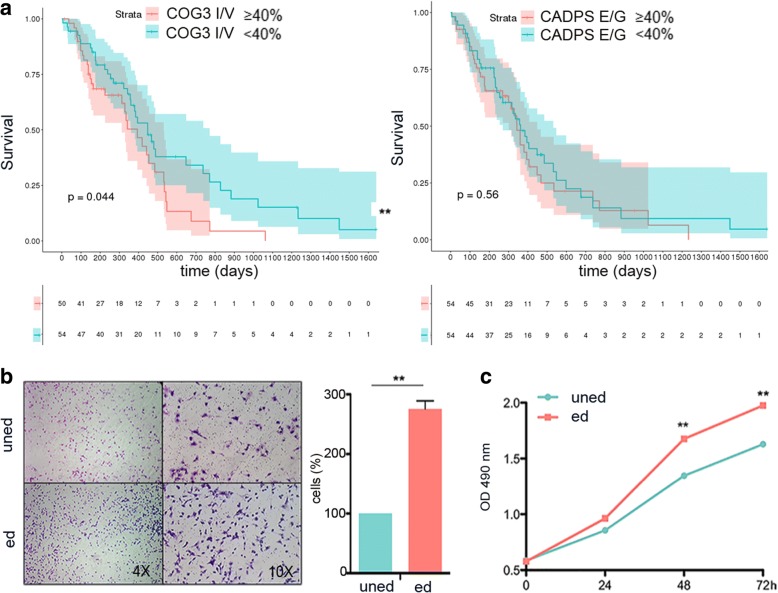
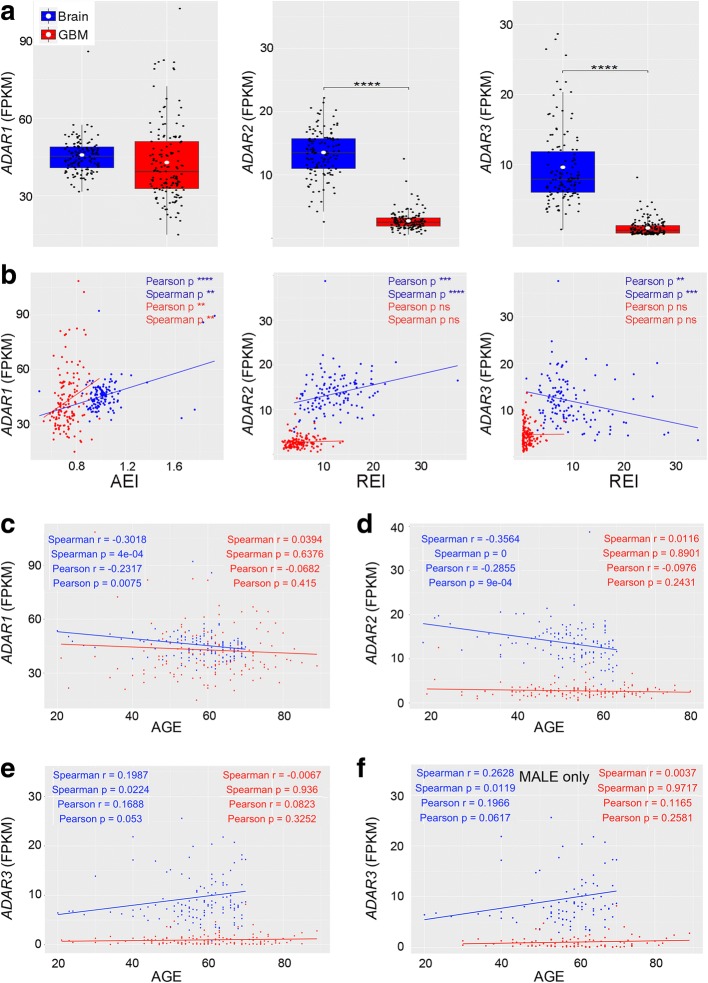
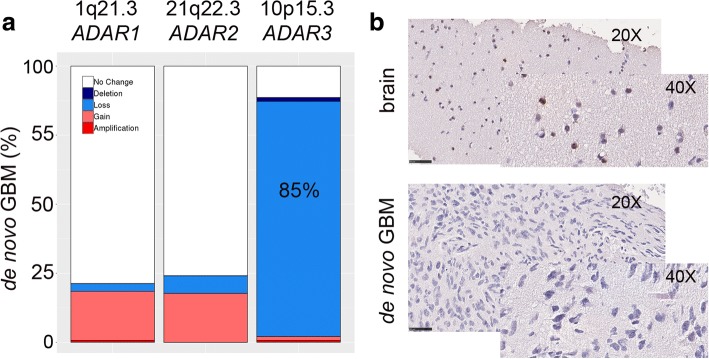
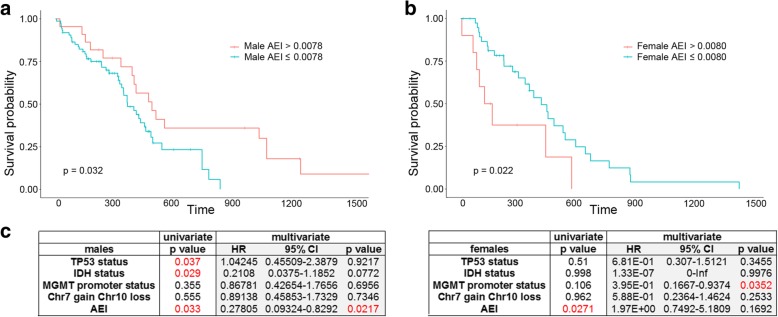
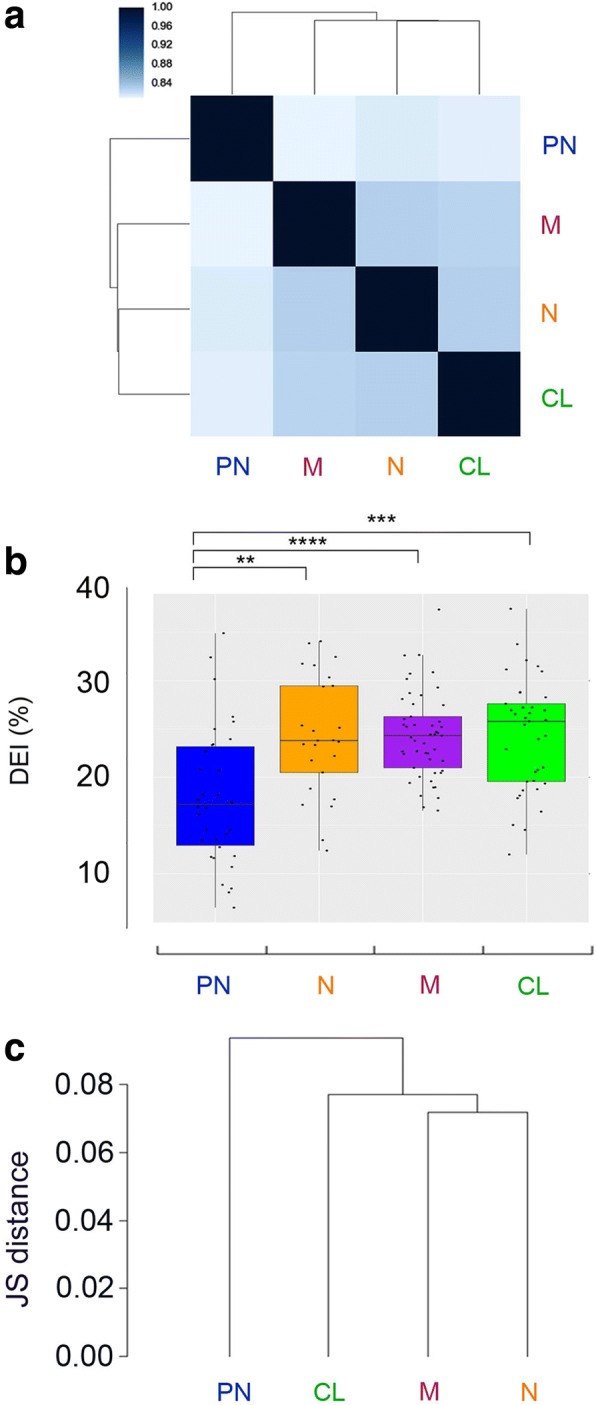
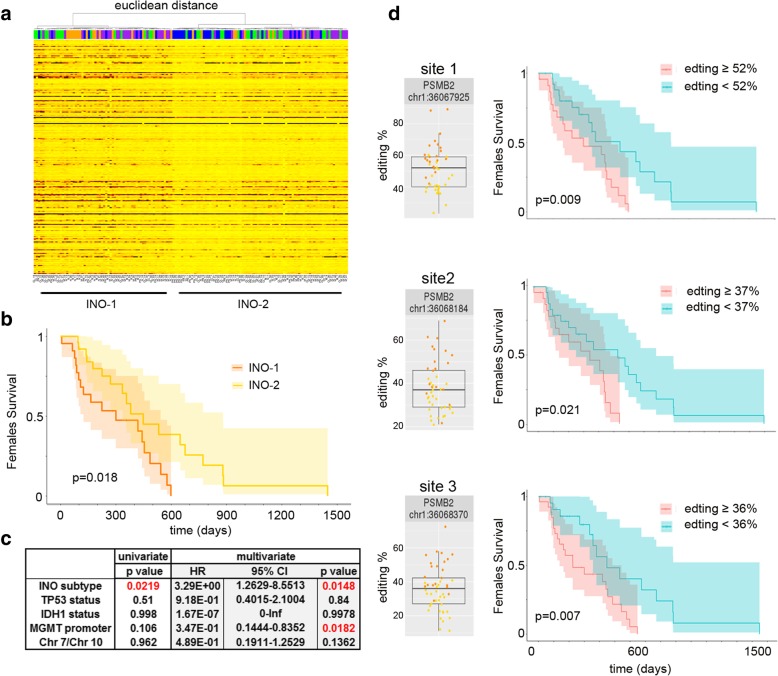
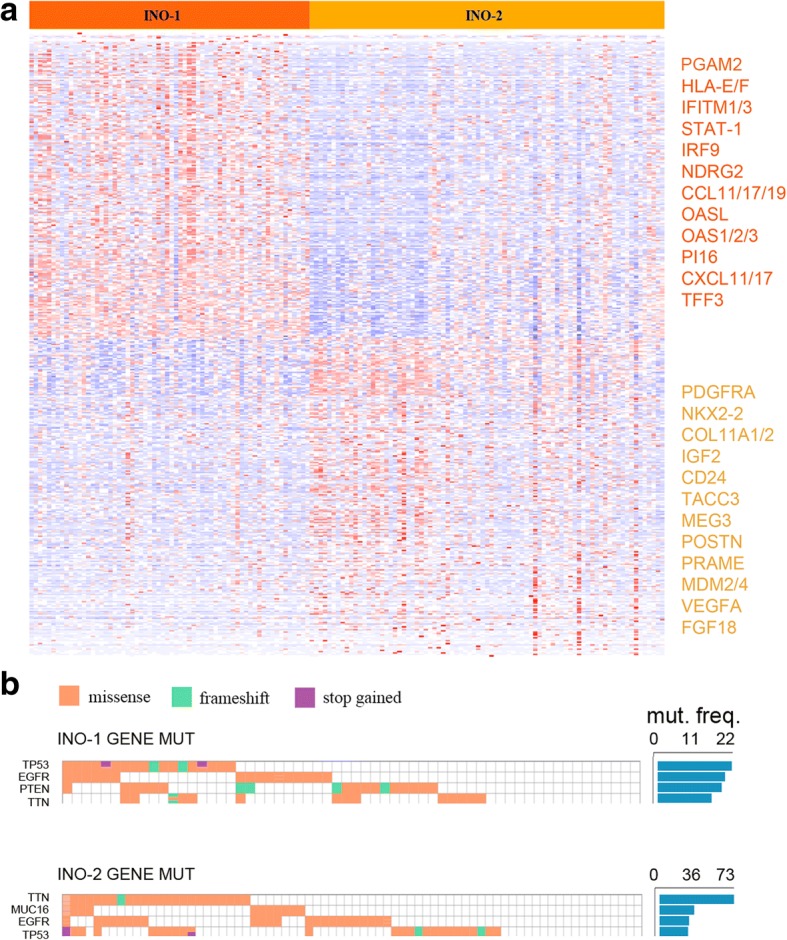
Results: Here, we characterize the inosinome signature in normal brain and de novo glioblastoma (GBM) using new metrics that re-stratify GBM patients according to their editing profiles and indicate this post-transcriptional event as a possible molecular mechanism for sexual dimorphism in GBM. We find that over 85% of de novo GBMs carry a deletion involving the genomic locus of ADAR3, which is specifically expressed in the brain. By analyzing RNA editing and patient outcomes, an intriguing gender-dependent link appears, with high editing of Alus shown to be beneficial only in male patients. We propose an inosinome-based molecular stratification of GBM patients that identifies two different GBM subgroups, INO-1 and INO-2, which can identify novel high-risk gender-specific patient groups for which more aggressive treatments may be necessary.

Conclusions: Our data provide a detailed picture of RNA editing landscape in normal brain and GBM, exploring A-to-I RNA editing regulation, disclosing unexpected editing implications for GBM patient stratification and identification of gender-dependent high-risk patients, and suggesting COG3 I/V as an eligible site for future personalized targeted gene therapy.

Keywords: ADAR; COG3; GBM; RNA editing; RNA-Seq.


Conflict of interest statement

Ethics approval and consent to participate

The study was approved by the local committee on the use of human samples for experimental studies of the Catholic University School of Medicine, Rome, Italy (Prot. 12045/15). Written informed consents were provided by the participants prior to enrollment. All experimental methods abided by the Helsinki Declaration.

Consent for publication

Not applicable.

Competing interests

The authors declare that they have no competing interests.

Publisher’s Note

Springer Nature remains neutral with regard to jurisdictional claims in published maps and institutional affiliations.

Figures

Fig. 1
Fig. 1
Inosinome signature in de novo GBM compared to the normal brain and astrocytes. a Two-dimensional non-metric multi-dimensional scaling (N-MDS) ordination plots of GBM (145 samples, shown in red), cerebral cortex (132 samples, shown in blue), and normal astrocytes (12 different pools, shown in green). b Alu editing index (AEI) distributions (box plot, median). c Distributions of hyper-editing sites (box plot, median and mean values indicated as a black bar and white dots, respectively). d Non-repetitive editing index (nREI) value distributions (box plot, median). e Recoding editing index (REI) values distributions (box plot, median). Two-tailed Mann-Whitney U test was applied. ****p ≤ 0.0001
Fig. 2
Fig. 2
Editing fluctuation in de novo GBM and normal brain at coding sites. a Heatmap of RNA editing levels at recoding sites in GBM compared to the normal cerebral cortex. Each column represents one of the 145 de novo GBMs (TCGA) and 132 brain cortex (GTEx) samples, rows show the 89 differentially edited non-repetitive recoding sites. Only the statistically significant sites (two-tailed Mann-Whitney U test, with Benjamini-Hochberg-corrected p value ≤ 0.05) are shown. The heatmap was generated with Pandas and Seaborn Python libraries, and the list of the editing sites was also reported in the same order in Additional file 3: Table S2. b Box plots representing editing frequencies (%) distributions in GBM and brain cortex at selected sites (two-tailed Mann-Whitney test, with Benjamini-Hochberg correction): GRIA3 R/G q value = 6.44E−33, GRIA2 Q/R q value = 8.63E−20, NEIL1 K/R q value = 1.01E−16, COPA I/V q value = 0.0022, COG3 I/V q value = 0.0002, and CADPS E/G q value = 2.58E−18. In red GBM and in blue normal brain cortex samples are shown. Medians are indicated by black bars
Fig. 3
Fig. 3
Clinical relevance of editing at COG3 I/V recoding site. a Kaplan-Meier curves representing the survival probability of GBM patients stratified by COG3 I/V (104 samples) and CADPS E/G (108 samples) editing levels respectively. Log-rank test, COG3 p value = 0.044, CADPS p value = 0.56. The red line represents high editing frequency (≥ 40%), the green line represents low editing frequency (< 40%). b Migration assay of glioblastoma cells (A172) expressing unedited COG3 (uned) and edited (ed) COG3 was performed 24 h post-seeding. Representative photographs of migrated cells are shown (× 4 and × 10 magnifications). Migrated cells were stained with Diff-Quick and counted. Histograms show the migration ability of ed. COG3 expressing cells relative to the uned COG3 (fold increase ± SD, n = 3) **p ≤ 0.01 (two-sided t test). c Proliferation (MTS assay) of glioblastoma cells (A172) infected with unedited or edited COG3 (mean ± SD, n = 3) **p ≤ 0.01 (two-sided t test)
Fig. 4
Fig. 4
ADAR expression correlates with editing indexes, age, and gender. a ADAR1, ADAR2, and ADAR3 expression levels were calculated by using Cufflinks (FPKM distributions), ****p ≤ 0.0001. b Correlations between ADAR expressions and editing indexes (AEI and REI) in TCGA GBM cohorts and the normal brain. ce Correlations between ADAR expression (FPKM) and age (in blue healthy individuals in red GBM patients). f Correlation between ADAR3 expression (FPKM) and male’s age. **p ≤ 0.01, ***p ≤ 0.001, ****p ≤ 0.0001
Fig. 5
Fig. 5
ADARs copy number variation in de novo GBMs. a ADAR genes copy number variation plot (cBioPortal, GISTIC2.0 algorithm). b Two representative pictures of six GBMs and two normal brains stained with ADAR3 by IHC (× 20 and × 40 magnifications are shown)
Fig. 6
Fig. 6
AEI associated with GBM patients overall survival in a gender-specific manner. a, b Gender-dependent association between Alu editing and OS in male and female GBM patients. Females and males exhibit an opposite trend when stratified using AEI. c Prognostic factors associated with OS in the Cox hazard regression analysis for de novo GBM patients from TCGA, univariate, and multivariate analyses are shown for male (left) and female (right), respectively
Fig. 7
Fig. 7
Inosinome signature did not overlay the previously proposed GBM subclassification. a Heatmap of clustered correlation matrix based on Spearman’s coefficients considering all the editing positions detected in proneural (PN, shown in blue), mesenchymal (M, shown in purple), neural (N, shown in orange), and classical (CL, shown in green) GBM subtypes. b Distributions of editing index (DEI) calculated at the differentially edited sites identified among GBM subtypes (see Additional file 4: Table S3). c Dendrogram plot representing Jensen-Shannon distances based on gene expression levels (cummeRbund software). ****p ≤ 0.0001, ***p ≤ 0.001, **p ≤ 0.01
Fig. 8
Fig. 8
GBM patient stratification based on inosinome signature identifies two subgroups. a Unsupervised hierarchical clustering (based on Euclidean samples distance matrix) and heatmap (editing levels) calculated on the editing positions detected in at least 140 GBMs. b Kaplan-Meier curves representing the OS of GBM female patients stratified by INO-1 and INO-2. c Prognostic factors associated with the OS of de novo GBM female patients (TCGA) are analyzed with the Cox hazard regression, both univariate and multivariate analysis are shown. d Editing frequency distributions within 3′-UTR of PSMB2 in female GBM patients and Kaplan-Meier curves based on high/low editing at the PSMB2 sites in female GBM patients
Fig. 9
Fig. 9
Gene expression profiles of INO-1 and INO-2 subtypes. a Heatmap showing the top differentially expressed genes between INO-1 and INO-2 GBM subtypes (Additional file 7: Table S6) in dark yellow listed some highly expressed genes in INO-1 and in light yellow the highly expressed genes in INO-2. b Mutational analysis of the most frequently altered genes in INO-1 and INO-2 GBM subgroups

References

    1. Bishop JM. Molecular themes in oncogenesis. Cell. 1991;64:235–248. doi: 10.1016/0092-8674(91)90636-D. - DOI - PubMed
    1. Weinberg RA. How cancer arises. Sci Am. 1996;275:62–70. doi: 10.1038/scientificamerican0996-62. - DOI - PubMed
    1. Gallo A, Vukic D, Michalik D, O’Connell MA, Keegan LP. ADAR RNA editing in human disease; more to it than meets the I. Hum Genet. 2017;136(9):1265–1278. doi: 10.1007/s00439-017-1837-0. - DOI - PubMed
    1. Xu X, Wang Y, Liang H. The role of A-to-I RNA editing in cancer development. Curr Opin Genet Dev. 2017;48:51–56. doi: 10.1016/j.gde.2017.10.009. - DOI - PMC - PubMed
    1. Nishikura K. Functions and regulation of RNA editing by ADAR deaminases. Annu Rev Biochem. 2010;79:321–349. doi: 10.1146/annurev-biochem-060208-105251. - DOI - PMC - PubMed

Publication types