. 2019 Feb 13;51(2):1-14.
doi: 10.1038/s12276-019-0210-x.

Kynurenine 3-monooxygenase is a critical regulator of renal ischemia-reperfusion injury

Affiliations

Kynurenine 3-monooxygenase is a critical regulator of renal ischemia-reperfusion injury

Xiaozhong Zheng et al. Exp Mol Med. .

Abstract

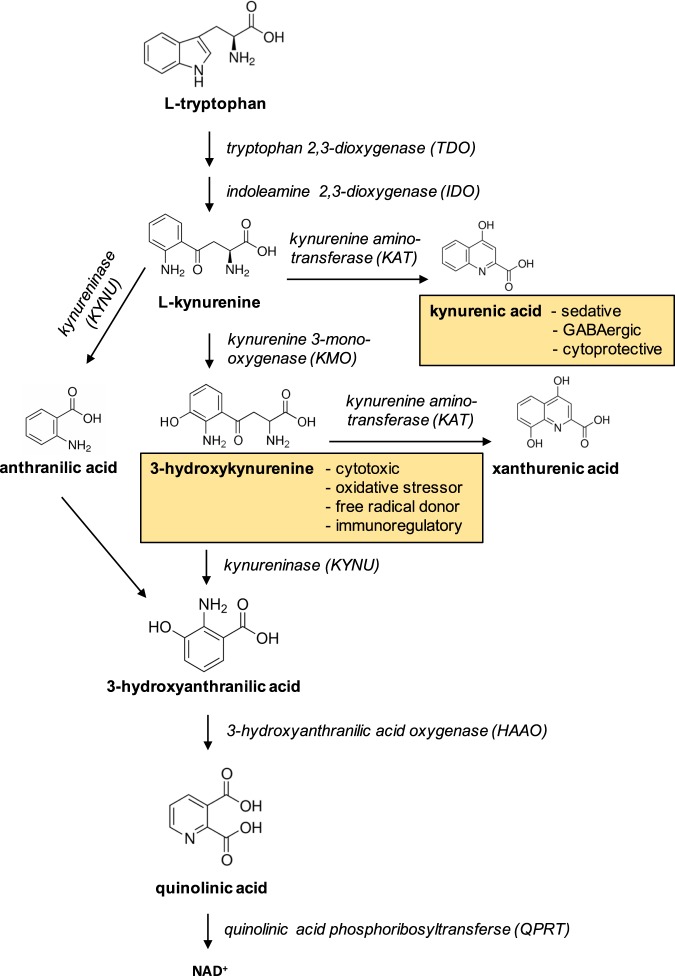
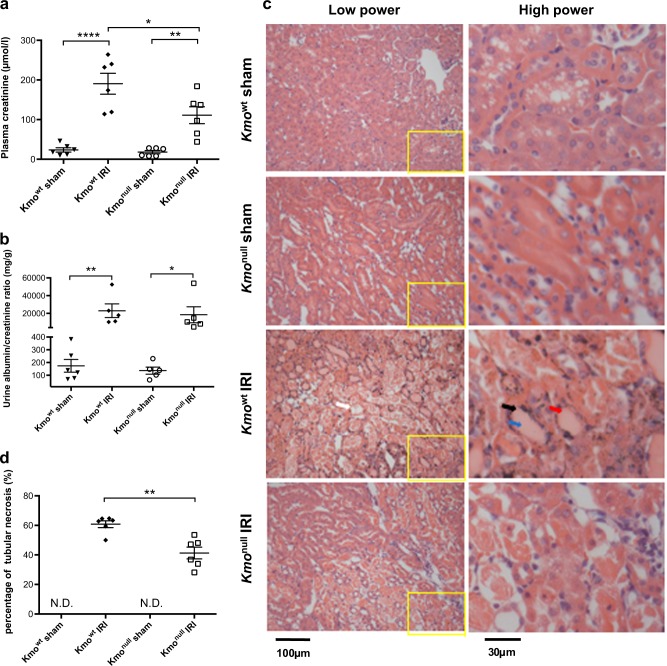
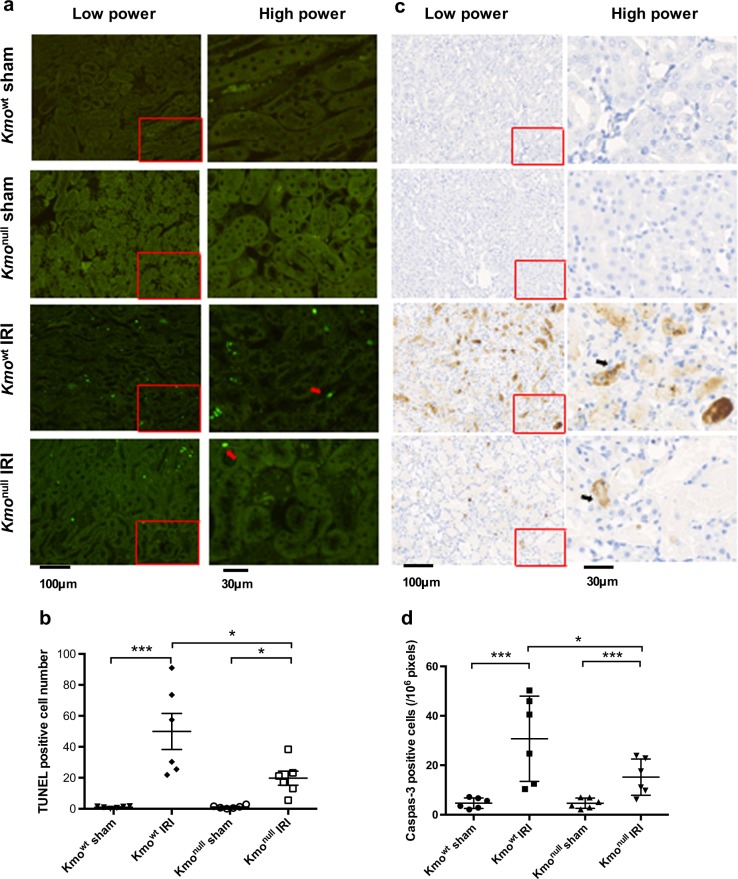
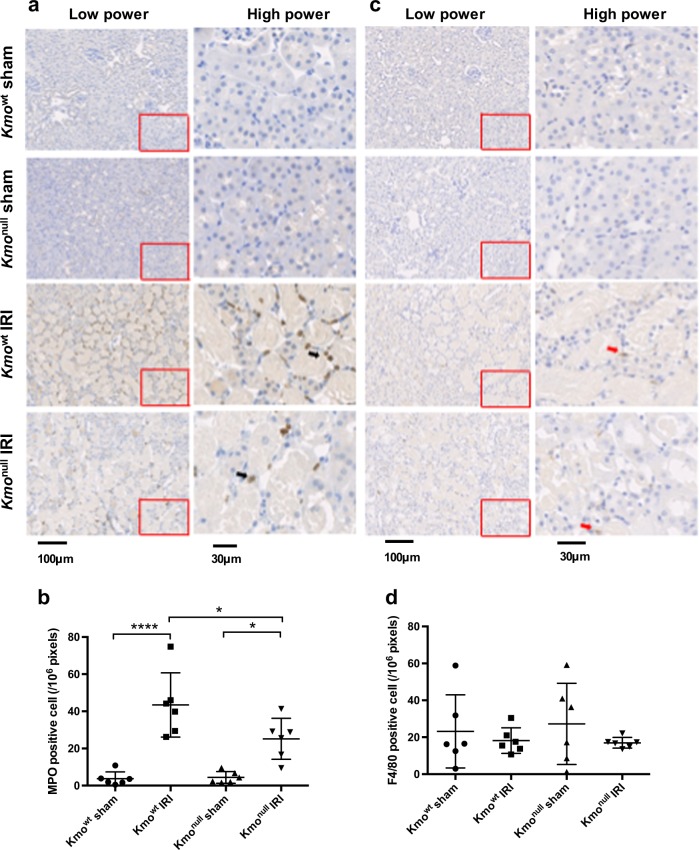
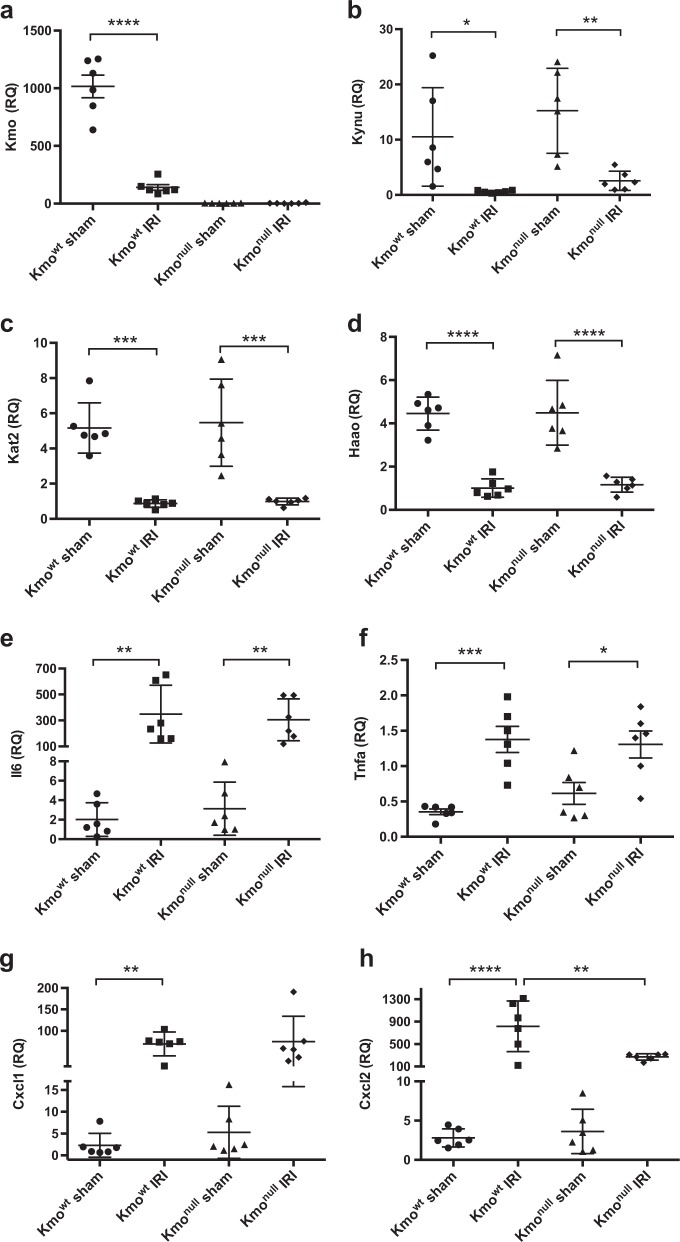
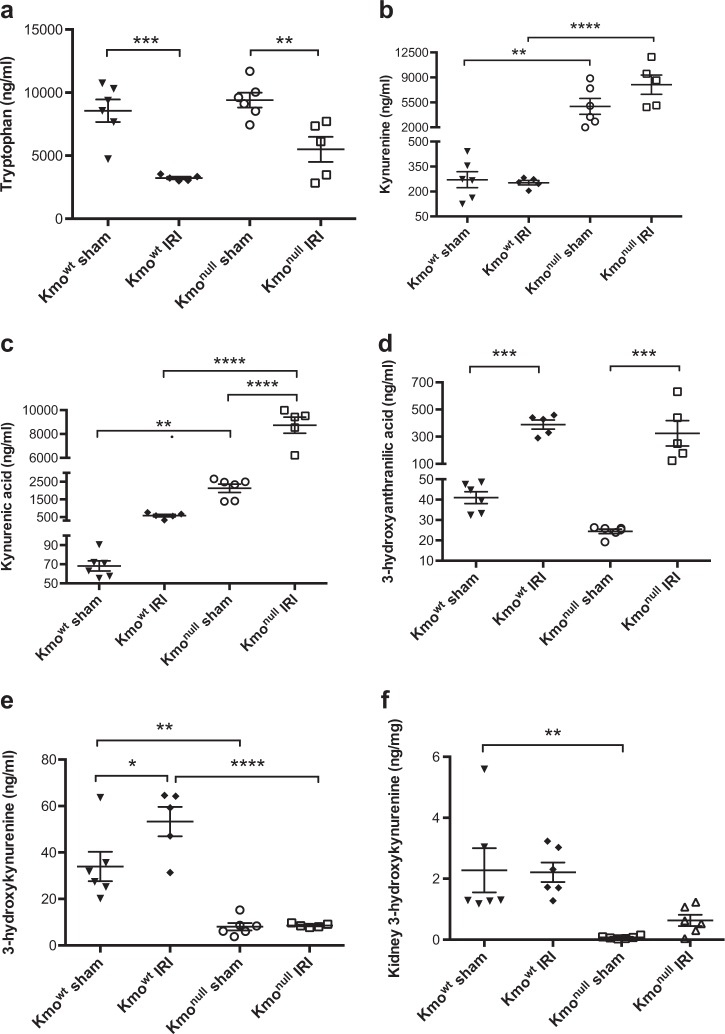
Acute kidney injury (AKI) following ischemia-reperfusion injury (IRI) has a high mortality and lacks specific therapies. Here, we report that mice lacking kynurenine 3-monooxygenase (KMO) activity (Kmonull mice) are protected against AKI after renal IRI. We show that KMO is highly expressed in the kidney and exerts major metabolic control over the biologically active kynurenine metabolites 3-hydroxykynurenine, kynurenic acid, and downstream metabolites. In experimental AKI induced by kidney IRI, Kmonull mice had preserved renal function, reduced renal tubular cell injury, and fewer infiltrating neutrophils compared with wild-type (Kmowt) control mice. Together, these data confirm that flux through KMO contributes to AKI after IRI, and supports the rationale for KMO inhibition as a therapeutic strategy to protect against AKI during critical illness.


Conflict of interest statement

The authors declare that they have no conflict of interest.

Figures

Fig. 1
Fig. 1. Overview of the kynurenine pathway of tryptophan metabolism.
3-Hydroxykynurenine, the product of the gate-keeper enzyme kynurenine 3-monooxygenase (KMO), and kynurenic acid, one of the other branch metabolite are highlighted
Fig. 2
Fig. 2. Biochemical indices of renal function and histological assessment of renal tubule injury after ischemia–reperfusion injury (IRI) in Kmowt and Kmonull mice.
a Plasma creatinine. b Urine albumin/creatinine ratio. c Representative digital micrographs of histological sections of formalin-fixed paraffin-embedded kidney tissue from Kmowt and Kmonull mice after IRI or sham operation, stained with haematoxylin and eosin and visualized by light microscopy at × 200 original magnification. Low-power images are showed on the left panel. The relative image of selected area are showed in high power on the right panel. Tubular necrosis (white arrow), loss of the brush border (black arrow), cast formation (blue arrow), and tubular dilatation (red arrow) are indicated within the outer stripe of the renal medulla. d Enumeration of necrotic renal tubules expressed as a percentage of all tubules. N.D not detected. For all panels, mice were subjected to unilateral nephrectomy and contralateral IRI, or sham operation, under general anesthesia as described. Twenty-four hours after IRI or sham operation, mice were euthanased and blood, urine, and kidney sampled for analysis. All graphs show data from individual mice (one data point per mouse), with lines showing mean ± SEM. Group sizes were n = 6 mice per group, except for panel b, where urine was only successfully obtained from n = 5 mice per group (individual data shown). Statistically significant differences between groups were analyzed by one-way analysis of variance (ANOVA) with post hoc Tukey’s test; *P < 0.05, **P < 0.01 and ****P < 0.0001
Fig. 3
Fig. 3. Detection of tubular epithelial cell apoptosis in kidney tissue after ischemia–reperfusion injury (IRI).
a Representative digital micrographs of TdT-mediated dUTP nick-end labeling (TUNEL)-stained kidney sections at × 100 original magnification. Red arrows indicate TUNEL-positive apoptotic cells. Low-power images are showed on the left panel. The relative image of selected area are showed in high power on the right panel. b Number of TUNEL-positive cells per low-power field. c Representative digital micrographs selected from scanned caspase-3 stained entire kidney images. Black arrows indicate caspase-3-positive cells. Low-power images are showed on the left panel. The relative image of selected area are showed in high power on the right panel. d Cell apoptosis expressed as caspase-3-positive cells per 106 pixels. For all panels, Kmowt and Kmonull mice were subjected to IRI or sham operation as described and euthanased 24 h afterwards. Kidneys were sampled for analysis. Apoptotic cells were labeled by TUNEL assay and enumerated from digitally scanned micrographs using ImageJ. Apoptotic cells were also labeled by immunohistochemistry using antibodies to cleaved caspase-3, visualized by diaminobenzoate and enumerated. All graphs show data from individual mice (one data point per mouse), with lines showing mean ± SEM. Group sizes were n = 6 mice per group. Statistically significant differences between groups were analyzed by one-way analysis of variance (ANOVA) with post hoc Tukey’s test; *P < 0.05 and ***P < 0.001
Fig. 4
Fig. 4. Neutrophil infiltration and monocyte-derived macrophage accumulation in kidney tissue after ischemia–reperfusion injury (IRI).
a Representative digital micrographs selected from scanned myeloperoxidase (MPO)-stained entire kidney images. Black arrows indicate MPO+ cells. Low-power images are showed on the left panel. The relative image of selected area are showed in high power on the right panel. b MPO+ neutrophil infiltration, expressed as MPO+ cells per 106 pixels. c Representative digital micrographs selected from scanned F4/80-stained entire kidney images. Red arrows indicate MPO+ cells. Low-power images are showed on the left panel. The relative image of selected area are showed in high power on the right panel. d F4/80+ monocyte-derived macrophage accumulation, expressed as F4/80+ cells per 106 pixels. For all panels, Kmowt and Kmonull mice were subjected to IRI or sham operation as described and euthanased 24 h afterwards. Kidneys were sampled for analysis. Neutrophils and monocyte-derived macrophages were labeled by immunohistochemistry using antibodies to myeloperoxidase (MPO) and F4/80, respectively, visualized by diaminobenzoate and enumerated. All graphs show data from individual mice (one data point per mouse), with lines showing mean ± SEM. Group sizes were n = 6 mice per group. Statistically significant differences between groups were analyzed by one-way analysis of variance (ANOVA) with post hoc Tukey’s test; *P < 0.05 and ****P < 0.0001
Fig. 5
Fig. 5. mRNA expression of kynurenine pathway enzymes and pro-inflammatory cytokines in kidney tissue after ischemia–reperfusion injury (IRI).
a Kynurenine 3-monoxygenase, Kmo; b kynureninase, Kynu; c kynurenine aminotransferase, Kat2; d 3-hydroxyanthranilic acid oxidase, Haao; e interleukin-6, Il6; f tumor necrosis factor α, Tnfa. g chemokine (C-X-C motif) ligand 1, Cxcl1; h chemokine (C-X-C motif) ligand 2, Cxcl2. For all panels, Kmowt and Kmonull mice were subjected to IRI or sham operation and euthanased 24 h afterwards. Kidney tissue was sampled, snap frozen in liquid nitrogen, and RNA subsequently extracted for analysis by real-time PCR as described. mRNA levels of the target gene were normalized to 18S ribosomal RNA and are presented as relative quantification (RQ) values. All graphs show data from individual mice with lines showing mean ± SEM. Group sizes were n = 6 mice per group. Statistically significant differences between groups were analyzed by one-way analysis of variance (ANOVA) with post hoc Tukey’s test; *P < 0.05, **P < 0.01, ***P < 0.001 and ****P < 0.0001
Fig. 6
Fig. 6. Kynurenine pathway metabolite concentrations in plasma and kidney tissue after ischemia–reperfusion injury (IRI).
a Plasma tryptophan; b plasma kynurenine; c plasma kynurenic acid; d plasma 3-hydroxyanthranilic acid; e plasma 3-hydroxykynurenine; f kidney tissue 3-hydroxykynurenine. For all panels, mice were subjected to unilateral nephrectomy and contralateral IRI, or sham operation, under general anesthesia. Twenty-four hours after IRI or sham operation, mice were euthanased and blood and kidney tissue sampled for analysis. Extracts of plasma (panels a–e) or kynurenine 3-monooxygenase (KMO) activity in kidney tissue (panel f) were analyzed by liquid chromatography-tandem mass spectrometry (LC-MS/MS) as described. All graphs show data from individual mice (one data point per mouse), with lines showing mean ± SEM. Group sizes were n = 6 or n = 5 (where one plasma was not obtained) mice per group. Statistically significant differences between groups were analyzed by one-way analysis of variance (ANOVA) with post hoc Tukey’s test; *P < 0.05, **P < 0.01, ***P < 0.001 and ****P < 0.0001

References

    1. Stone TW, Darlington LG. Endogenous kynurenines as targets for drug discovery and development. Nat. Rev. Drug. Discov. 2002;1:609–620. doi: 10.1038/nrd870. - DOI - PubMed
    1. Consortium TM, et al. Single-cell transcriptomics of 20 mouse organs creates a Tabula Muris. Nature. 2018;562:367–372. doi: 10.1038/s41586-018-0590-4. - DOI - PMC - PubMed
    1. Thul PJ, Lindskog C. The human protein atlas: a spatial map of the human proteome. Protein Sci. 2018;27:233–244. doi: 10.1002/pro.3307. - DOI - PMC - PubMed
    1. Nakagami Y, Saito H, Katsuki H. 3-Hydroxykynurenine toxicity on the rat striatum in vivo. Jpn. J. Pharmacol. 1996;71:183–186. doi: 10.1254/jjp.71.183. - DOI - PubMed
    1. Mizdrak J, Hains PG, Truscott RJ, Jamie JF, Davies MJ. Tryptophan-derived ultraviolet filter compounds covalently bound to lens proteins are photosensitizers of oxidative damage. Free Radic. Biol. Med. 2008;44:1108–1119. doi: 10.1016/j.freeradbiomed.2007.12.003. - DOI - PubMed

Publication types

MeSH terms