. 2019 Feb 13;10(1):728.
doi: 10.1038/s41467-019-08431-7.

Longitudinal HIV sequencing reveals reservoir expression leading to decay which is obscured by clonal expansion

Affiliations

Longitudinal HIV sequencing reveals reservoir expression leading to decay which is obscured by clonal expansion

Marilia Rita Pinzone et al. Nat Commun. .

Abstract

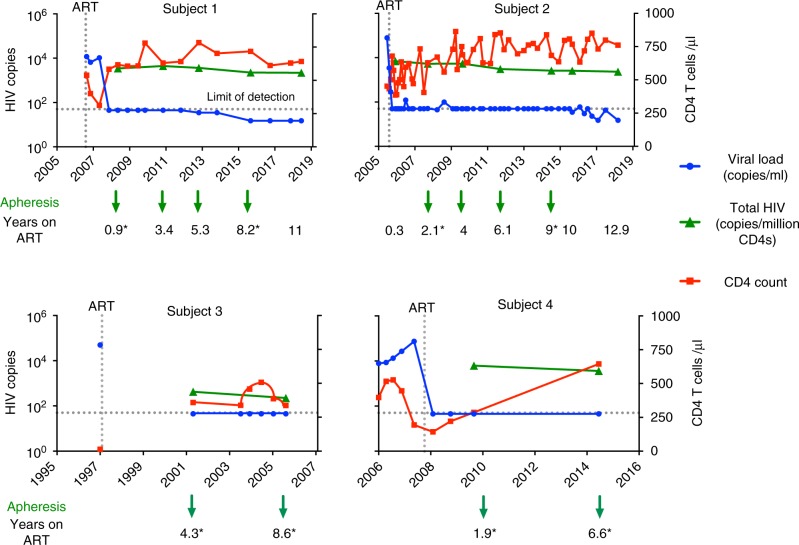
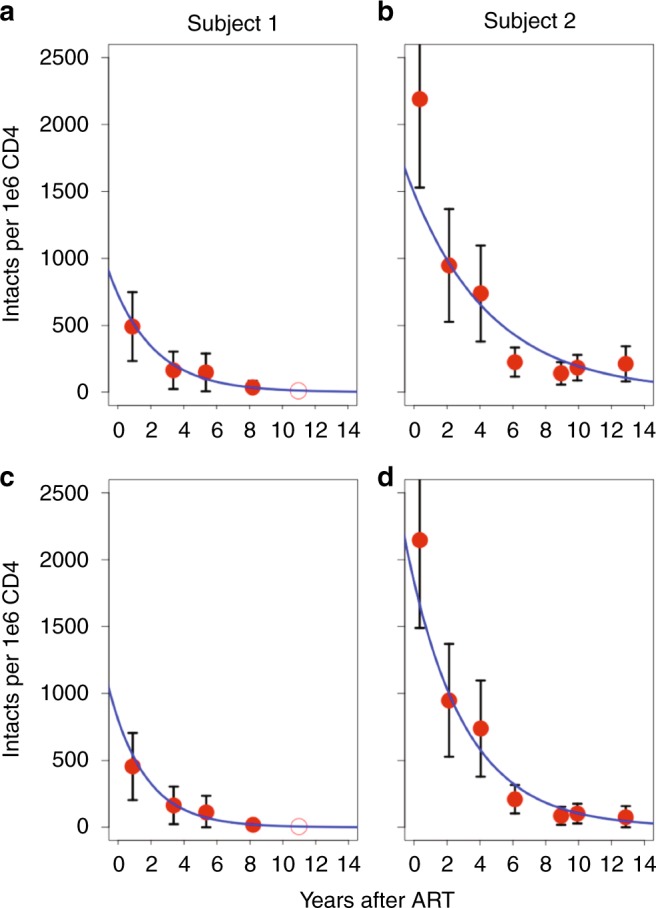
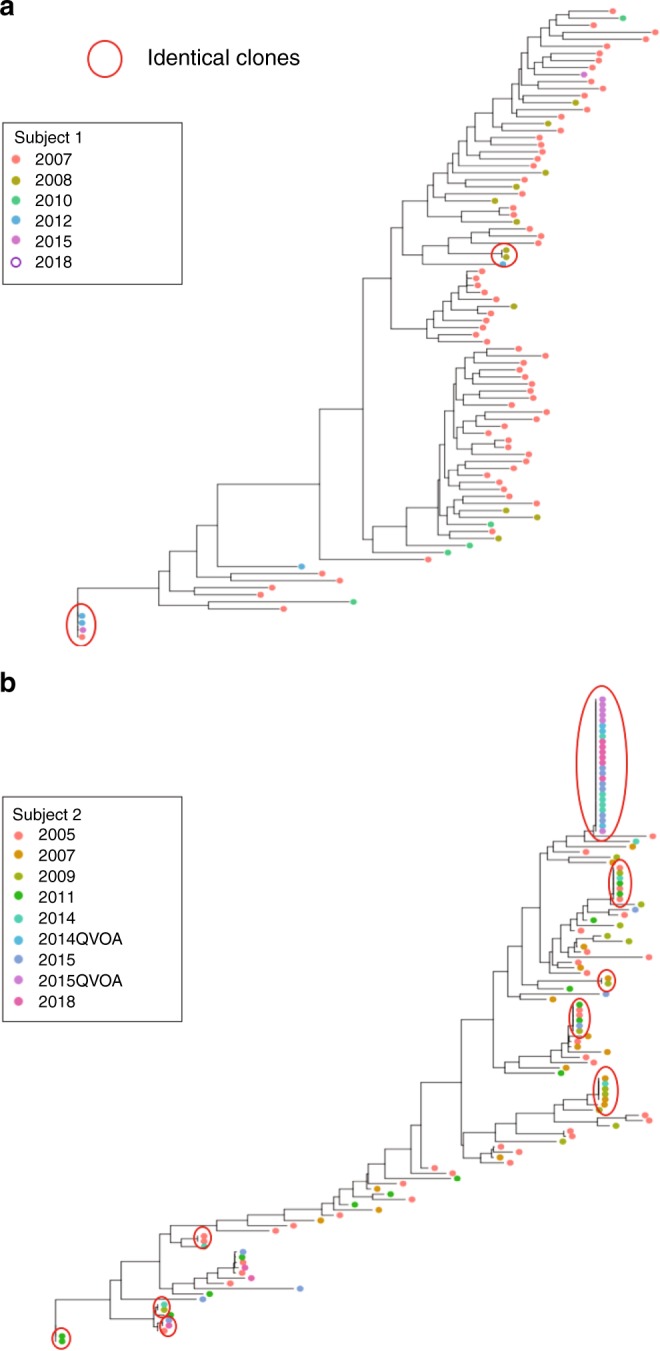
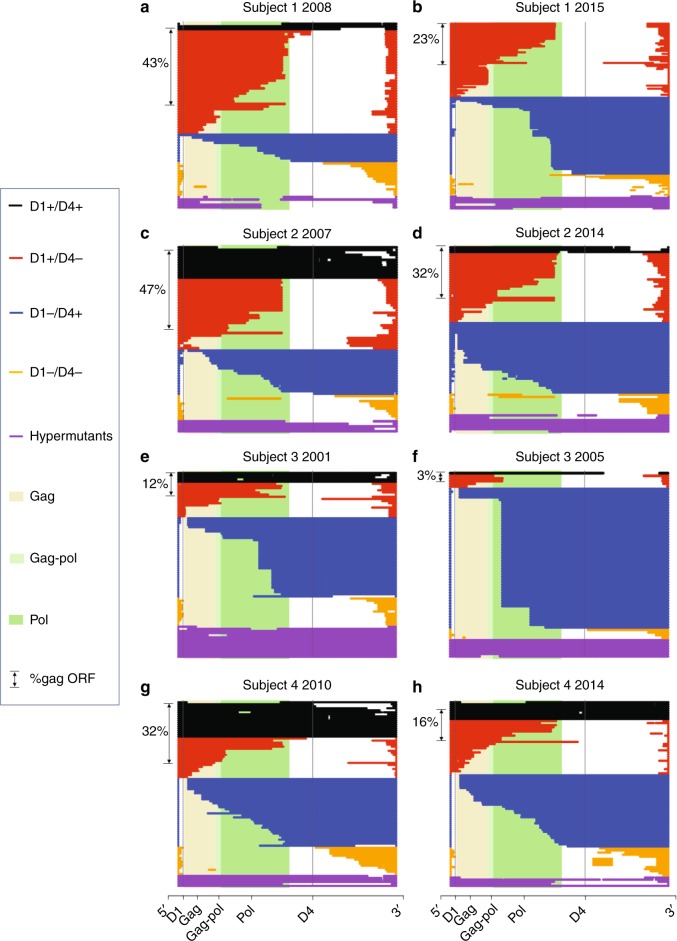
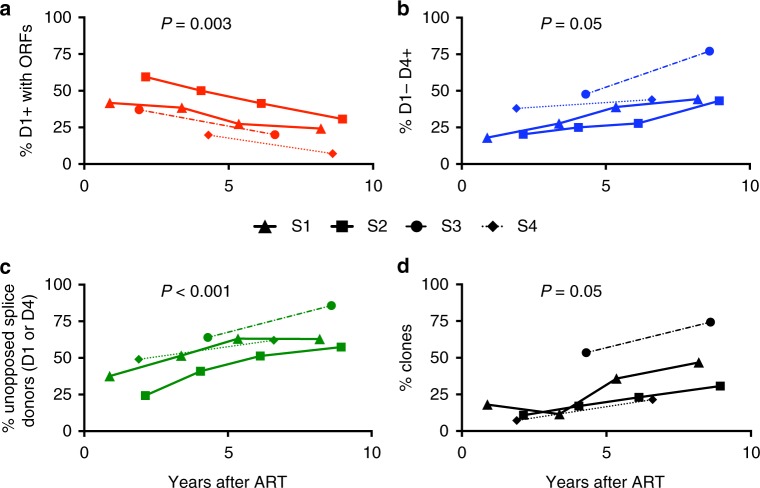
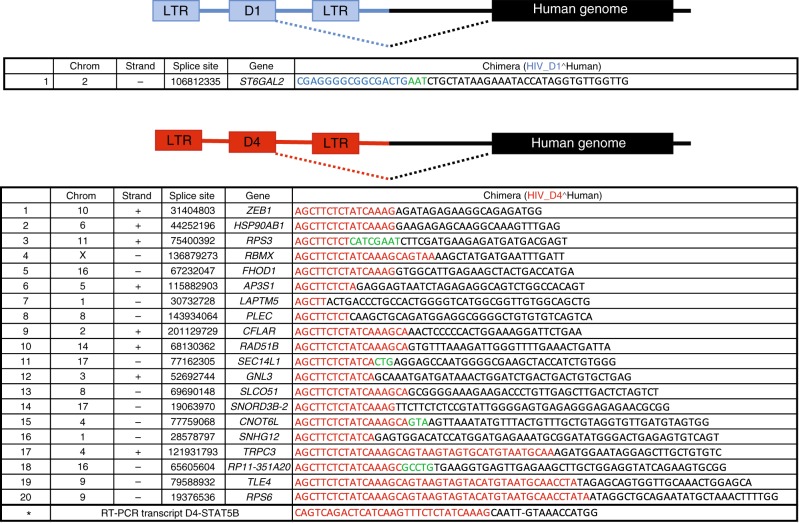
After initiating antiretroviral therapy (ART), a rapid decline in HIV viral load is followed by a long period of undetectable viremia. Viral outgrowth assay suggests the reservoir continues to decline slowly. Here, we use full-length sequencing to longitudinally study the proviral landscape of four subjects on ART to investigate the selective pressures influencing the dynamics of the treatment-resistant HIV reservoir. We find intact and defective proviruses that contain genetic elements favoring efficient protein expression decrease over time. Moreover, proviruses that lack these genetic elements, yet contain strong donor splice sequences, increase relatively to other defective proviruses, especially among clones. Our work suggests that HIV expression occurs to a significant extent during ART and results in HIV clearance, but this is obscured by the expansion of proviral clones. Paradoxically, clonal expansion may also be enhanced by HIV expression that leads to splicing between HIV donor splice sites and downstream human exons.


Conflict of interest statement

The authors declare no competing interests.

Figures

Fig. 1
Fig. 1
Longitudinal parameters of four subjects over time on ART. Longitudinal levels of plasma HIV-1 RNA (blue), total HIV DNA (green), and CD4 T cell counts (red). For each subject, peripheral blood mononuclear cells (PBMCs) were collected by apheresis at the time points indicated in the graph. The arrows identify the time points we used for sequencing of both intact and defective proviruses, while for the remaining time points only near-full-length proviruses were sequenced. Asteriks identify the time points used for the deletion maps in Fig. 4. Total HIV DNA was quantified by primers binding to the long terminal repeat region of HIV-1. Values are normalized to CD4 T cell count and presented as log copies of HIV per million CD4 T cells. HIV RNA is presented as copies per ml blood
Fig. 2
Fig. 2
Dynamic changes of intact proviruses over time. a Frequency of intact proviruses after initiating treatment for Subject 1 measured by intact copies per million CD4 T cells. Red circles represent intact proviruses calculated by multiplying the concentration of total HIV DNA per CD4 by the frequency of sequenced proviruses that were intact. b Frequency of intact proviruses for Subject 2. c Frequency of intact proviruses for Subject 1 when counting clones only the first time they were detected in order to minimize the effects of clonal expansion. d Frequency of intact proviruses in Subject 2 with clones counted only once, when they first appeared. We included five time points for Subject 1 and 7 for Subject 2. For Subject 1, we did not identify any intact provirus in 2018, and therefore this time point is presented as an open circle. Black bars signify 95 percent confidence interval of the mean based on a binomial process with approximately 100 sequences per time point. The blue line is the estimated decay based on a exponential decay model
Fig. 3
Fig. 3
Phylogenetic tree of intact proviruses for Subjects 1 and 2. a Phylogenetic tree of intact proviruses for Subject 1 (n = 90). Branch lengths are proportional to genetic distance to a consensus sequence for the sequences graphed in the tree. Identical clones are indicated within the red circles. Consensus sequences were generated for each subject and used to root the tree. b Phylogenetic tree of intact proviruses for Subject 2 (n = 123). Circled clones represent identical intact proviruses. Notably, we included 67 sequences from 2007 for Subject 1, at which time he was in the first phase of viral decay; for this reason, we excluded this time point in our model of intact proviral decay. For Subject 1, no intact proviruses were identified in the sample from 2018, and therefore this time point is presented as an open circle
Fig. 4
Fig. 4
Deletion analysis reveals a role for splicing in reservoir dynamics. a Defective proviruses from an apheresis sample collected from Subject 1 in 2008 (~1 year of ART) are aligned to HXB2. In order, from top to bottom, black proviruses are D1+ D4+, red proviruses are D1+ D4−, blue proviruses are D1− D4+, and gold proviruses are D1−D4-. Hypermutated proviruses are represented in purple. The shaded beige, light green, and dark green regions correspond to the gag, gag-pol, and pol regions of HXB2, respectively. On the left side of panels ah we show the percentage of defective proviruses containing a complete Gag ORF. b Defective proviruses from Subject 1 for the apheresis sample collected in 2015 (~8 years of ART). Proviruses are graphed on the same scale to demonstrate how the proportion of each type of defective proviruses changed from first to last time point. c, d Defective proviruses from Subject 2 for the apheresis sample collected in 2007 (~2 years of ART) and in 2014 (~9 years of ART). e, f Defective proviruses from Subject 3 for the apheresis sample collected in 2001 (~4 years of ART) and in 2005 (~9 years of ART). g, h Defective proviruses from Subject 4 for the apheresis sample collected in 2010 (~2 years of ART) and in 2014 (~7 years of ART). The time points used for the deletion maps are identified by asterisks in Fig. 1. The first black provirus depicted in a contains a D1 and terminates within the gag ORF, but this is obscured due to imperfect R-coded filtering
Fig. 5
Fig. 5
Relative changes in the major splice sites donors reveal selection pressures. a Percentage of defective proviruses with D1 splice site and at least one ORF over time on ART (red). b Percentage of intact D4 splice site sequence in defective proviruses lacking 5′ D1 at the same time points. These proviruses are predicted not to express proteins efficiently due to a truncated 5′UTR (blue). c Percentage of defective proviruses with unopposed strong donor splice site, i.e. D1+ without ORFs or D1−D4+ at the same time points (green). d Percentage of clones over time in defective proviruses (black). Estimations of a common slope for these data were done using a linear random-effects regression model, assuming each subject had a different intercept at the initiation of ART. To test for the statistical significance of this effect, a statistical analysis based on a type III Anova was performed. The time points used for the analysis of the deleted proviruses are identified by arrows in Fig. 1
Fig. 6
Fig. 6
HIV expression leads to chimeric transcripts between D1 or D4 and human genes. RNA-seq was performed using in vitro-infected resting cells harvested at day 7 after infection. The sequences of the chimeric transcripts between HIV D1 (blue) and human genes (black) are shown in the top panel, while those between HIV D4 (red) and human genes (black) are shown in the bottom panel. We marked in green the sequences we could not map to either HIV or the human genome.The sequence marked with an asterisk was retrieved by RT-PCR and Sanger sequencing of in vitro-infected CD4 T cells

References

    1. Siliciano JD, et al. Long-term follow-up studies confirm the stability of the latent reservoir for HIV-1 in resting CD4+T cells. Nat. Med. 2003;9:727–728. doi: 10.1038/nm880. - DOI - PubMed
    1. Finzi D, et al. Latent infection of CD4+T cells provides a mechanism for lifelong persistence of HIV-1, even in patients on effective combination therapy. Nat. Med. 1999;5:512–517. doi: 10.1038/8394. - DOI - PubMed
    1. Eriksson, S. et al. Comparative analysis of measures of viral reservoirs in HIV-1 eradication studies. PLoS Pathog. 9, e1003174 (2013). - PMC - PubMed
    1. Besson GJ, et al. HIV-1 DNA decay dynamics in blood during more than a decade of suppressive antiretroviral therapy. Clin. Infect. Dis. 2014;59:1312–1321. doi: 10.1093/cid/ciu585. - DOI - PMC - PubMed
    1. Bruner KM, et al. Defective proviruses rapidly accumulate during acute HIV-1 infection. Nat. Med. 2016;22:1043–1049. doi: 10.1038/nm.4156. - DOI - PMC - PubMed

Publication types

MeSH terms

Substances