. 2019 Feb 13;9(1):1930.
doi: 10.1038/s41598-018-38034-z.

Global Disease Outbreaks Associated with the 2015-2016 El Niño Event

Affiliations

Global Disease Outbreaks Associated with the 2015-2016 El Niño Event

Assaf Anyamba et al. Sci Rep. .

Erratum in

Abstract

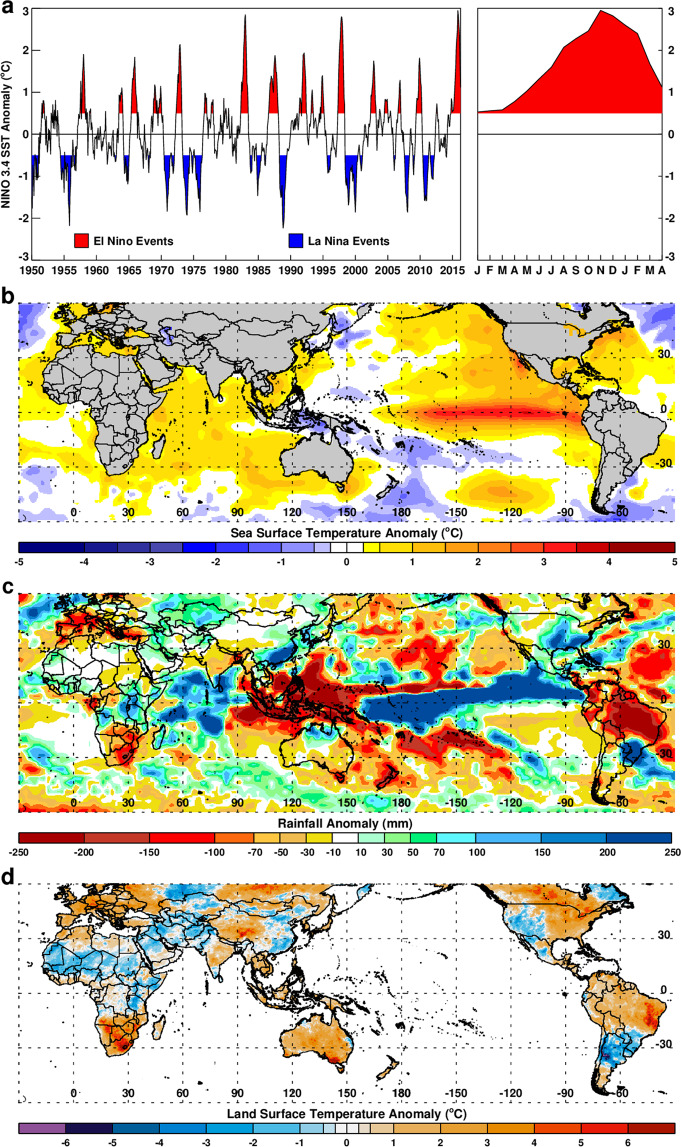
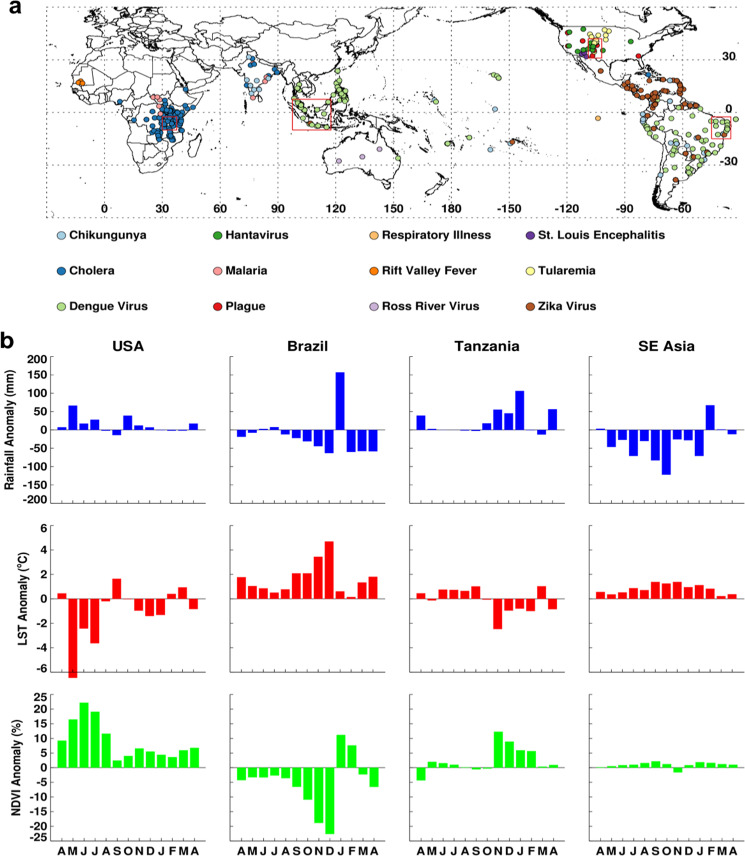
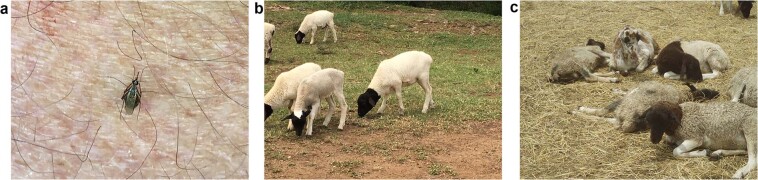
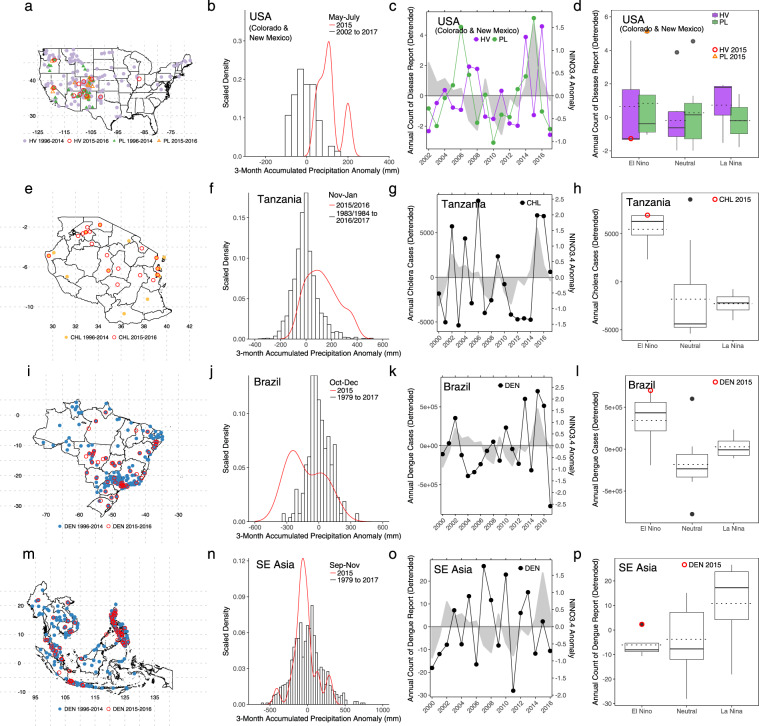
Interannual climate variability patterns associated with the El Niño-Southern Oscillation phenomenon result in climate and environmental anomaly conditions in specific regions worldwide that directly favor outbreaks and/or amplification of variety of diseases of public health concern including chikungunya, hantavirus, Rift Valley fever, cholera, plague, and Zika. We analyzed patterns of some disease outbreaks during the strong 2015-2016 El Niño event in relation to climate anomalies derived from satellite measurements. Disease outbreaks in multiple El Niño-connected regions worldwide (including Southeast Asia, Tanzania, western US, and Brazil) followed shifts in rainfall, temperature, and vegetation in which both drought and flooding occurred in excess (14-81% precipitation departures from normal). These shifts favored ecological conditions appropriate for pathogens and their vectors to emerge and propagate clusters of diseases activity in these regions. Our analysis indicates that intensity of disease activity in some ENSO-teleconnected regions were approximately 2.5-28% higher during years with El Niño events than those without. Plague in Colorado and New Mexico as well as cholera in Tanzania were significantly associated with above normal rainfall (p < 0.05); while dengue in Brazil and southeast Asia were significantly associated with above normal land surface temperature (p < 0.05). Routine and ongoing global satellite monitoring of key climate variable anomalies calibrated to specific regions could identify regions at risk for emergence and propagation of disease vectors. Such information can provide sufficient lead-time for outbreak prevention and potentially reduce the burden and spread of ecologically coupled diseases.


Conflict of interest statement

The authors declare no competing interests.

Figures

Figure 1
Figure 1
Climate anomalies during the 2015–2016 ENSO event: (a) 1950–2016 NINO 3.4 sea surface temperature (SST) anomalies showing periods of El Niño and La Niña events defined by +0.5/−0.5 SST thresholds, and 2015–2016 El Niño SST anomaly values by month in red on right panel. (b) December-February 2015/16 global mean SST anomalies during the peak ENSO season. (c) October-December 2015 cumulative rainfall anomalies towards the ENSO peak phase and (d) mean land surface temperature (LST) anomalies for October-December 2015. Anomalies in rainfall and LSTs highlight several ENSO-linked regions including southeast United States, northeast Brazil, eastern equatorial Africa, southern Africa, and Southeast Asia. This figure was created using Interactive Data Language (IDL) software (version 8.6.0) (www.harrisgeospatial.com/SoftwareTechnology/IDL.aspx).
Figure 2
Figure 2
Geographic distribution of various disease activity worldwide (between April 2015–March 2016) compiled from various sources (a) and time series profiles of climate variables (b) for each box in (a). Persistence of anomaly conditions of precipitation, land surface temperature, and normalized difference vegetation index in (b) created conditions for the emergence of vectors and outbreaks of diseases for United States, Brazil, Tanzania, and Southeast Asia focal regions in (a). This figure was created using Interactive Data Language (IDL) software (version 8.6.0) (www.harrisgeospatial.com/SoftwareTechnology/IDL.aspx).
Figure 3
Figure 3
Aedes mcintoshi Rift Valley fever virus reservoir mosquito at a farm in Ruiru, near Nairobi, Kenya (left-a) in January, 2016, produced by anomalously heavy rainfall in the presence of healthy sheep (center-b) unlike in January, 2007 (right-c) when the farm lost ~80% of its sheep population. Early warning and early vaccination prevented transmission of Rift Valley fever 2016 on this farm (Photo Credits: KJ Linthicum and A. Anyamba).
Figure 4
Figure 4
Selected regional disease outbreaks and climate conditions for hantavirus (HV) and plague (PL) in the United States (ad); cholera (CHL) in Tanzania (eh); dengue (DEN) in Brazil (il); dengue (DEN) in Southeast Asia (mp). Maps in the first column show the locations of reported disease occurrences during April 2015 to May 2016 El Niño event, overlaid on the locations of the same diseases occurring between 1996 and 2014. Histograms in the second column show rainfall anomaly distributions for locations with reported disease occurrences during the specified season in the 2015/2016 El Niño year. Time series plots in the third column represent each disease intensity over the years while the shaded plot denote annual NINO3.4 anomaly. Boxplots in the fourth column show the distribution of each disease intensity as categorized by the ENSO events. Here solid black lines represent the median value, dotted lines the mean value, and the circles are the disease intensity during 2015/2016 El Niño year. This figure was created using R software (version 3.4.1).

References

    1. Gubler DJ, et al. Climate variability and change in the United States: potential impacts on vector- and rodent-borne diseases. Environ. Health Perspect. 2001;109(Suppl):223–33. - PMC - PubMed
    1. Epstein PR. Climate change and human health. N. Engl. J. Med. 2005;353:1433–6. - PubMed
    1. Lyon B, Barnston AG. ENSO and the Spatial Extent of Interannual Precipitation Extremes in Tropical Land Areas. J. Clim. 2005;18:5095–5109.
    1. Ropelewski CF, Halpert MS. Global and Regional Scale Precipitation Patterns Associated with the El Niño/Southern Oscillation. Mon. Weather Rev. 1987;115:1606–1626.
    1. Mason SJ, Goddard L. Probabilistic Precipitation Anomalies Associated with ENSO. Bull. Am. Meteorol. Soc. 2001;82:619–638.

Publication types