Clinical Trial
. 2019 Feb 13;9(1):1917.
doi: 10.1038/s41598-018-38253-4.

Antimicrobial and inflammatory properties of South African clinical Lactobacillus isolates and vaginal probiotics

Affiliations
Clinical Trial

Antimicrobial and inflammatory properties of South African clinical Lactobacillus isolates and vaginal probiotics

Emily Chetwin et al. Sci Rep. .

Abstract

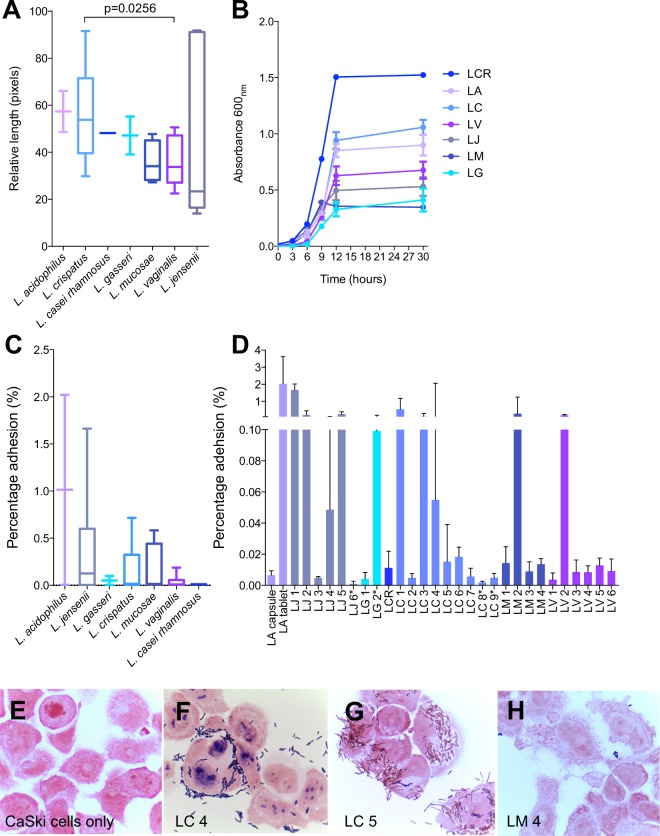
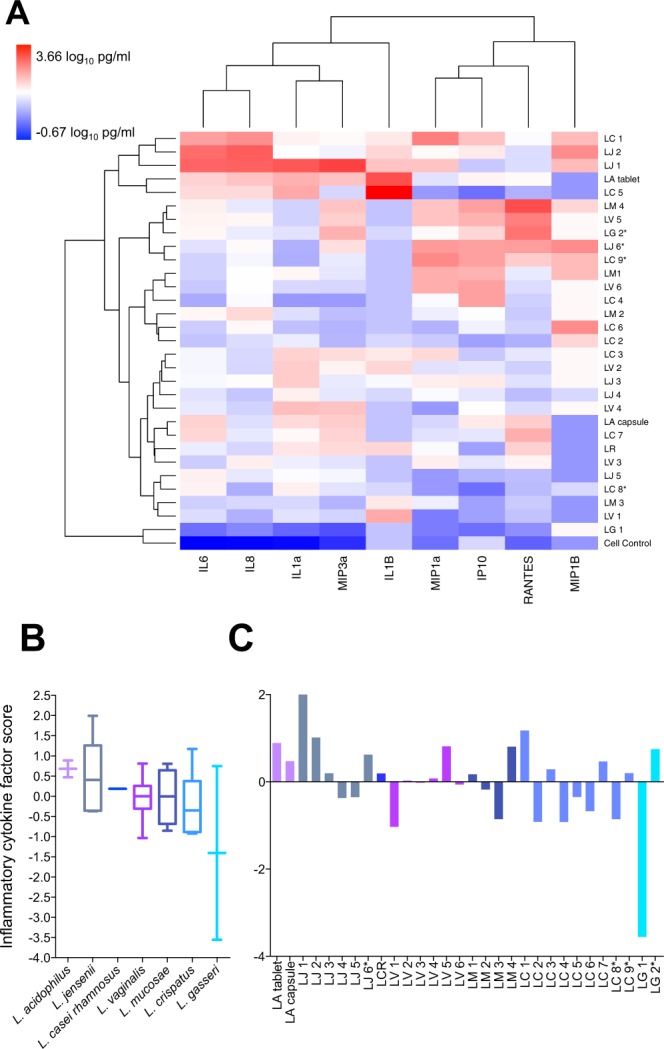
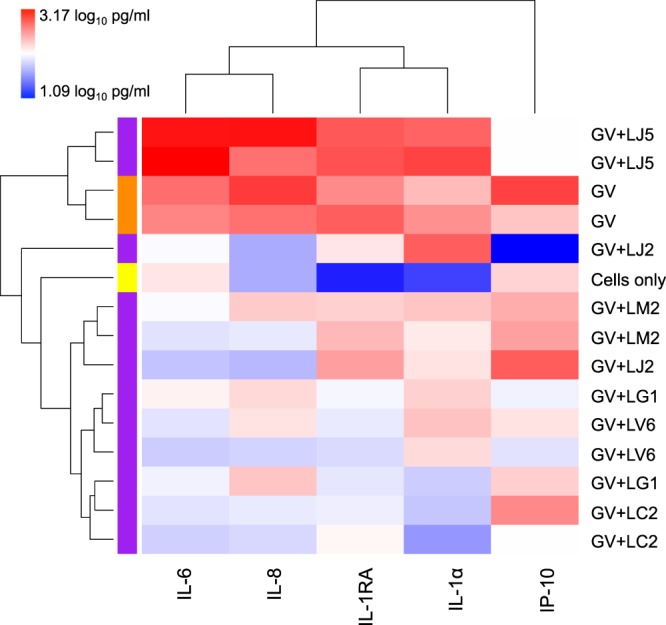
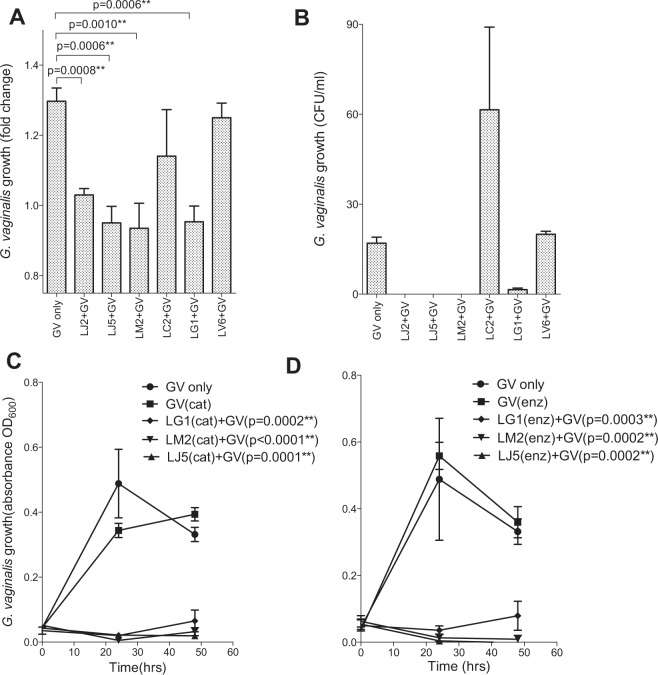
Bacterial vaginosis (BV) causes genital inflammation and increased HIV acquisition risk. The standard-of-care for BV, antibiotic therapy, is associated with high recurrence rates. Probiotics may improve treatment outcomes, although substantial heterogeneity in efficacy has been observed during clinical trials. To evaluate the potential to improve existing probiotics, we compared the inflammatory and antimicrobial (adhesion, H2O2, D-lactate and L-lactate production) characteristics of 23 vaginal Lactobacillus isolates from South African women, commercial vaginal probiotics (L. casei rhamnosus, L. acidophilus) and 4 reference strains. All lactobacilli induced inflammatory cytokine production by genital epithelial cells and produced D-lactate. Of six isolates assessed, five suppressed inflammatory responses to Gardnerella vaginalis. Although the L. acidophilus probiotic was the most adherent, many clinical isolates produced greater amounts of H2O2, D-lactate and L-lactate than the probiotics. The most L-lactate and H2O2 were produced by L. jensenii (adjusted p = 0.0091) and L. mucosae (adjusted p = 0.0308) species, respectively. According to the characteristics evaluated, the top 10 isolates included 4 L. jensenii, 2 L. crispatus, 1 L. mucosae, 1 L. vaginalis and the L. acidophilus probiotic. There is potential to develop an improved vaginal probiotic using clinical Lactobacillus isolates. Inflammatory profiles are critical to evaluate as some isolates induced substantial cytokine production.


Conflict of interest statement

The authors declare no competing interests.

Figures

Figure 1
Figure 1
Size, growth rates and adhesion of Lactobacillus isolates. (A) Bacterial length was evaluated using microscopy and lengths of different isolates grouped by species are shown, with species ordered from largest to smallest. Lines indicate medians of species (5 measurements per isolate), bars indicate the interquartile ranges and error bars indicate the ranges. (B) Growth rates were evaluated by inoculating MRS broth with 4.18 × 106 colony forming units (CFU) of each isolate, incubating anaerobically at 37 °C, and measuring the optical densities (600 nm) of cultures at various time-points. Growth rates by species are shown with symbols indicating means and error bars indicating the standard errors of the means of different isolates of the same species. (C–H) Lactobacillus adhesion to CaSki (ectocervical epithelial) cells was assessed by adding optical density (OD)-adjusted bacteria (OD600 0.1 ± 0.01) to cell monolayers, incubating for 2 h and washing to remove unbound bacteria. (C) Adhesion was evaluated in three separate experiments for each isolate. Following addition of bacteria and a 2 h incubation period, cells were lifted and plated on MRS agar and colony-forming units were counted. Adhesion is expressed as the percentage of the number of bacteria added to the monolayers that remained adherent. Different isolates of the same species were grouped together and species are ordered from the most to least adhesive. Lines indicate medians, bars indicate the interquartile ranges and error bars indicate the ranges. (D) The level of adhesion of each isolate is shown separately, with bars indicating medians and error bars indicating the ranges of adhesion evaluated in three separate experiments. (E–H) Adhesion was assessed qualitatively by Gram staining and collecting images at 1000x magnification using a light microscope. Mann-Whitney test was used for comparisons between species and p-values < 0.05 after adjustment for multiple comparisons were considered statistically significant. LA: Lactobacillus acidophilus probiotic (n = 2); LC: Lactobacillus crispatus (n = 9); LCR: Lactobacillus casei rhamnosus probiotic (n = 1); LG: Lactobacillus gasseri (n = 2); LM: Lactobacillus mucosae (n = 4); LV: Lactobacillus vaginalis (n = 6); LJ: Lactobacillus jensenii (n = 6). *ATCC reference strains.
Figure 2
Figure 2
Antimicrobial characteristics of Lactobacillus isolates. (A,C,E,G) Different isolates of the same species were grouped together and the overall antimicrobial properties of different species are shown, with species ordered according to the amounts of hydrogen peroxide (H2O2), D- and L-lactate produced and culture pH. Lines indicate medians, bars indicate the interquartile ranges and error bars indicate the ranges. (B,D,F,H) Antimicrobial properties for individual isolates are also shown with bars indicating the medians and error bars indicating the ranges of technical replicates within each assay. (A,B) Hydrogen peroxide production after 3 h of aerobic culture was measured in duplicate within the same assay. (C,D) pH levels of bacterial cultures were measured using a pH meter following anaerobic culture at 37 °C for 24 hours. (E,F) D-lactate and (G,H) L-lactate concentrations after a 24 h incubation period at 37 °C under anaerobic conditions were measured in duplicate within the same assays using Lactate Colorimetric kits. Mann-Whitney test was used for comparisons between species and p-values < 0.05 after adjustment for multiple comparisons were considered statistically significant. **Associations that remained statistically significant after adjustment for multiple comparisons. LA: Lactobacillus acidophilus probiotic (n = 2); LC: Lactobacillus crispatus (n = 9); LCR: Lactobacillus casei rhamnosus probiotic (n = 1); LG: Lactobacillus gasseri (n = 2); LM: Lactobacillus mucosae (n = 4); LV: Lactobacillus vaginalis (n = 6); LJ: Lactobacillus jensenii (n = 6). *ATCC reference strains.
Figure 3
Figure 3
Inflammatory cytokine production by CaSki cells in response to Lactobacillus isolates. Cytokine production by CaSki cells in response to lactobacilli after a 24 h incubation period at 37 °C under 5% CO2 was measured using Luminex. (A) Unsupervised hierarchical clustering was used to group lactobacilli isolates according to inflammatory responses induced. Inflammatory cytokine concentrations are shown as a heat map, with blue, through white, to red indicating low-high cytokine concentrations, respectively. Data was log10-transformed and scaled in R. Two clustering dendrograms are shown in the figure. The dendrogram above the heat map illustrates degrees of relatedness between different cytokines measured. The dendrogram on the left hand side of the heat map indicates relationships between the expression profiles of the analysed cytokines in response to different clinical Lactobacillus isolates. (B) Different isolates of the same species were grouped together and overall inflammatory responses to each species were determined by grouping all 9 inflammatory cytokines measured onto 1 factor and generating factor scores for the isolates. Species are ordered from most to least inflammatory; lines indicate medians, bars indicate interquartile ranges and error bars indicate ranges. Mann-Whitney test was used for comparisons between species; no significant differences in inflammatory responses were observed between species. (C) Overall inflammatory responses to each isolate. LA: Lactobacillus acidophilus probiotic (n = 2); LC: Lactobacillus crispatus (n = 9); LCR: Lactobacillus casei rhamnosus probiotic (n = 1); LG: Lactobacillus gasseri (n = 2); LM: Lactobacillus mucosae (n = 4); LV: Lactobacillus vaginalis (n = 6); LJ: Lactobacillus jensenii (n = 6). *ATCC reference strains.
Figure 4
Figure 4
L-lactate and D-lactate production by lactobacilli after a 24 h incubation period with CaSki cells at 37 °C under 5% CO2. D-lactate and L-lactate concentrations after a 24 h incubation period at 37 °C under 5% CO2 in antibiotic-free cell culture medium were measured in duplicate within the same assays using Lactate Colorimetric kits. (A) D- and (C) L-lactate production by isolates grouped according to species are shown. Lines indicate medians, bars indicate the interquartile ranges and error bars indicate the ranges. (B,D) Lactate production by individual isolates is also shown with bars indicating the medians and error bars indicating the ranges of technical replicates within each assay. Mann-Whitney test was used for comparisons between species and p-values < 0.05 after adjustment for multiple comparisons were considered statistically significant. **Associations that remained statistically significant after adjustment for multiple comparisons. LA: Lactobacillus acidophilus probiotic (n = 2); LC: Lactobacillus crispatus (n = 7); LCR: Lactobacillus casei rhamnosus probiotic (n = 1); LG: Lactobacillus gasseri (n = 1); LM: Lactobacillus mucosae (n = 4); LV: Lactobacillus vaginalis (n = 6); LJ: Lactobacillus jensenii (n = 5).
Figure 5
Figure 5
Lactobacilli-mediated changes in inflammatory cytokine production by CaSki cells in response to Gardnerella vaginalis. Cytokine production by CaSki cells in response to G. vaginalis alone and G. vaginalis following pre-incubation with lactobacilli. CaSki monolayers in 24 well plates were incubated with lactobacilli for 5 hours at 37 °C under 5% CO2. G. vaginalis was then added to the cultures and incubated as above for a further 20 hours. Cytokine concentrations were measured using Luminex. Unsupervised hierarchical clustering was used to group the co-cultures according to inflammatory responses induced. Inflammatory cytokine concentrations are shown as a heat map, with blue, through white, to red indicating low-high cytokine concentrations, respectively. Data was log10-transformed and scaled in R. Two clustering dendrograms are shown in the figure. The dendrogram above the heat map illustrates degrees of relatedness between different cytokines measured. The dendrogram on the left hand side of the heat map indicates relationships between the expression profiles of the analysed cytokines in response to different clinical Lactobacillus isolates. GV: G. vaginalis; LC: L. crispatus, LJ: L. jensenii; LM: L. mucosae; LG: L. gasseri; LV: L. vaginalis.
Figure 6
Figure 6
Inhibition of Gardnerella vaginalis growth by Lactobacillus culture supernatants. (A) Growth of G. vaginalis was determined by measuring the optical density of cultures at a wavelength of 600 nm (OD600), after culture with lactobacilli supernatants in duplicate within the same assay for 24 h at 37 °C. The fold change in growth of G. vaginalis only cultures was compared to those cultured with lactobacilli supernatants using an unpaired two-tailed t-test. (B) Colony forming units (CFU)/ml of G. vaginalis pretreated with lactobacilli supernatants on brain heart infusion (BHI) agar after incubation for 48 h at 37 °C were assessed in duplicate within the same assay. (C,D) Lactobacillus jensenii (LJ)5, L. mucosae (LM)2 and L. gasseri (LG)1 were used to determine the mechanism underlying the inhibition of G. vaginalis by lactobacilli supernatant in triplicate within the same assay. (C) The effects of hydrogen peroxide reduction by catalase and (D) bacteriocin degradation by proteolytic enzymes in Lactobacillus culture supernatants on the growth of G. vaginalis. Lines indicate means and error bars indicate the standard deviations of technical replicates. Student’s t-tests were used for comparisons. **Adjusted p-values < 0.05 were considered statistically significant. CFU: colony forming units, LC: L. crispatus, LV: L. vaginalis, Cat: catalase, Enz = proteolytic enzymes.

References

    1. Forsum U, et al. Bacterial vaginosis - A microbiological and immunological enigma. Apmis. 2005;113:81–90. doi: 10.1111/j.1600-0463.2005.apm1130201.x. - DOI - PubMed
    1. Cohen CR, et al. Bacterial Vaginosis associated with increased risk of female-to-male HIV-1 transmission: A prospective cohort analysis among African couples. PLoS Med. 2012;9:1–9. - PMC - PubMed
    1. Taha TE, et al. Bacterial vaginosis and disturbances of vaginal flora: association with increased acquisition of HIV. AIDS. 1998;13:1699–706. doi: 10.1097/00002030-199813000-00019. - DOI - PubMed
    1. Gosmann C, et al. Lactobacillus-deficient cervicovaginal bacterial communities are associated with increased HIV acquisition in young South African women. Immunity. 2017;46:29–37. doi: 10.1016/j.immuni.2016.12.013. - DOI - PMC - PubMed
    1. Williams B, Landay A, Presti RM. Microbiome alterations in HIV infection a review. Cell. Microbiol. 2016;18:645–51. doi: 10.1111/cmi.12588. - DOI - PubMed

Publication types

MeSH terms

LinkOut - more resources