. 2019 Feb 13;9(1):1900.
doi: 10.1038/s41598-018-38406-5.

Basic Units of Inter-Individual Variation in Resting State Connectomes

Affiliations

Basic Units of Inter-Individual Variation in Resting State Connectomes

Chandra Sripada et al. Sci Rep. .

Abstract

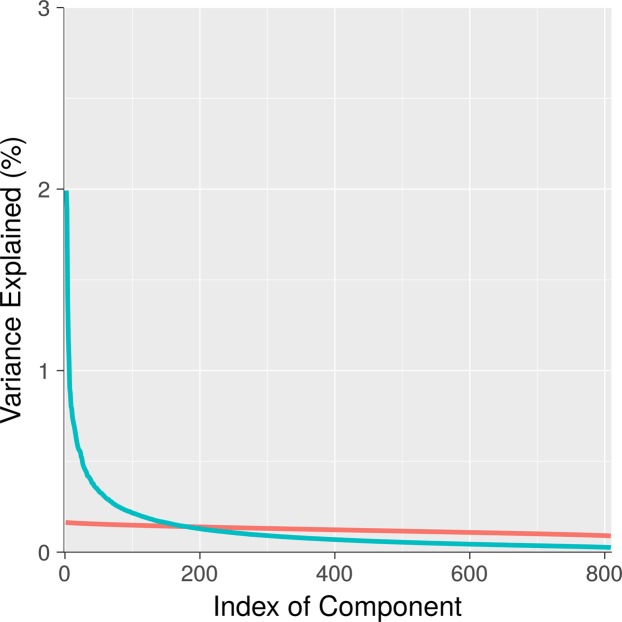
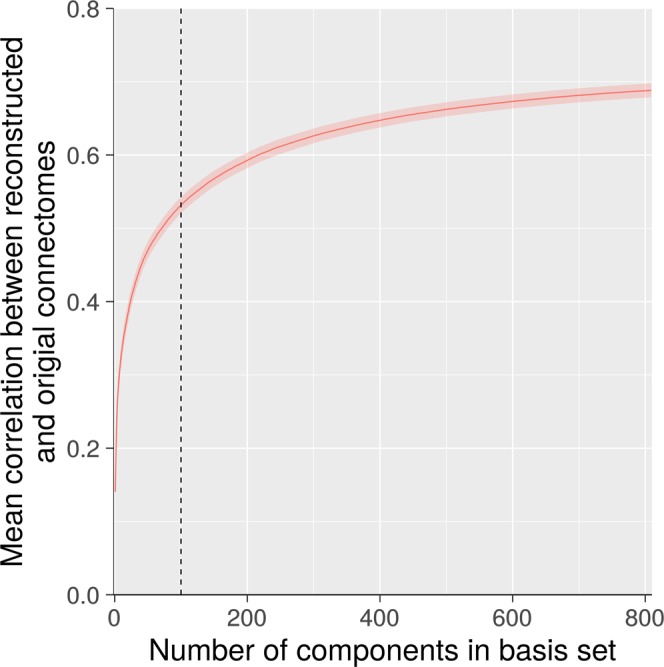
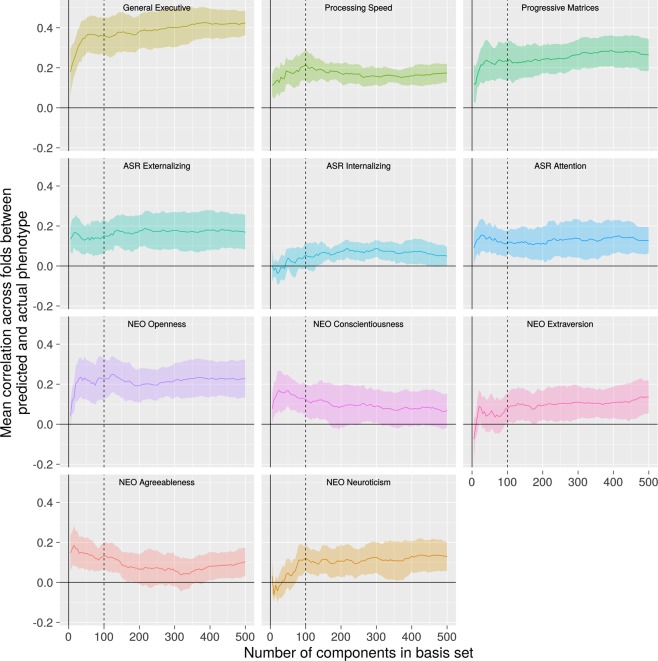
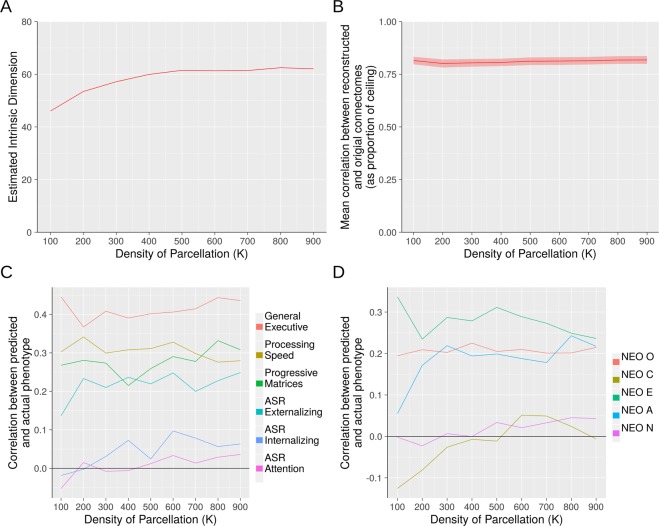
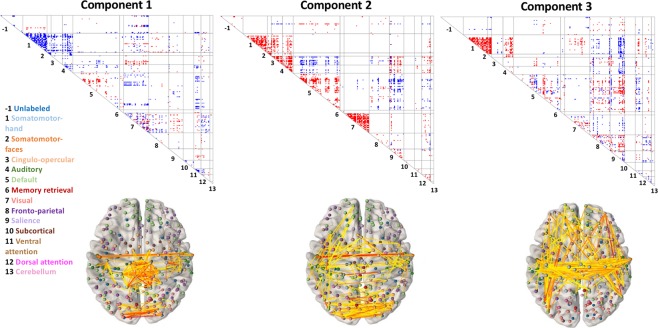
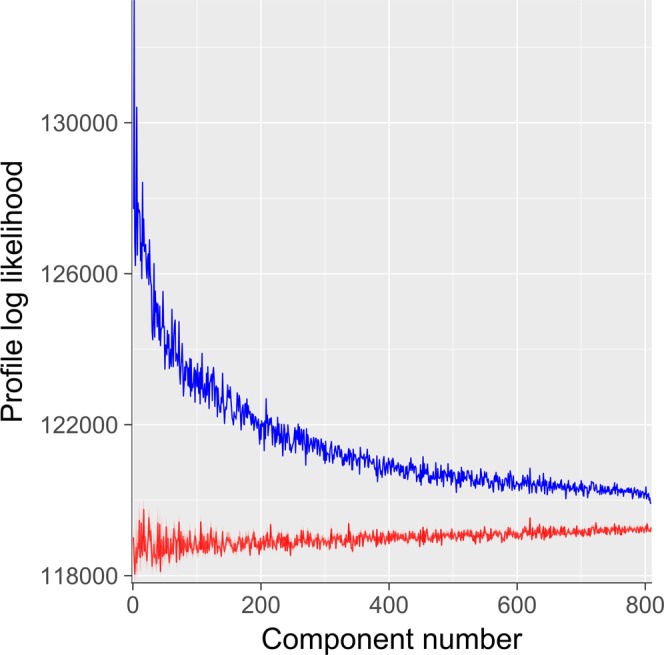
Resting state functional connectomes are massive and complex. It is an open question, however, whether connectomes differ across individuals in a correspondingly massive number of ways, or whether most differences take a small number of characteristic forms. We systematically investigated this question and found clear evidence of low-rank structure in which a modest number of connectomic components, around 50-150, account for a sizable portion of inter-individual connectomic variation. This number was convergently arrived at with multiple methods including estimation of intrinsic dimensionality and assessment of reconstruction of out-of-sample data. In addition, we show that these connectomic components enable prediction of a broad array of neurocognitive and clinical symptom variables at levels comparable to a leading method that is trained on the whole connectome. Qualitative observation reveals that these connectomic components exhibit extensive community structure reflecting interrelationships between intrinsic connectivity networks. We provide quantitative validation of this observation using novel stochastic block model-based methods. We propose that these connectivity components form an effective basis set for quantifying and interpreting inter-individual connectomic differences, and for predicting behavioral/clinical phenotypes.


Conflict of interest statement

The authors declare no competing interests.

Figures

Figure 1
Figure 1
Percent Variance Explained For Components Derived From Actual Versus Random Data. Components are ordered by decreasing percent variance explained. For observed components (blue), percent variance explained of early components is much larger than mean percent variance explained of components derived from random data (red). This pattern is suggestive of substantial low-rank structure in observed connectomes. Of note, the 95% confidence interval is plotted on the red line, but it is too narrow to be visible.
Figure 2
Figure 2
Out of Sample Reconstruction of Connectomes. With 100 components (dashed line), the correlation between actual and reconstructed connectomes is 0.50 (mean correlation across subjects; shading represents 95% confidence interval). Importantly, this correlation is only 0.68 using all 809 components, so a basis set consisting of 100 components achieves roughly three fourths of the “ceiling” correlation that is achievable.
Figure 3
Figure 3
Phenotype Predictive Accuracy as a Function of Basis Set Size. For most phenotypes, there is a plateau after 50 to 100 components (dotted line) after which adding further components to the prediction model basis set does not appreciably improve performance. Shading reflects 95% confidence interval based on cross-validation error.
Figure 4
Figure 4
Assessing Robustness to Parcellation Density. Three methods for identifying low-rank structure yielded stable results across parcellations of varying density. Panel (A) Estimation of intrinsic dimensionality with the method of Levina and Bickel. Panel (B) Out-of-sample reconstruction. Panels (C,D) Predictive accuracy with respect to 11 HCP phenotypes. Panels B through D used a 100-component basis set.
Figure 5
Figure 5
Components 1, 2, and 3. The first three components of inter-individual connectomic variation are displayed, with nodes organized by membership in 13 ICNs according to assignments of Power et al.. The boundaries of ICNs are determined from a strictly intra-individual phenomenon: coherence of the BOLD time series within a person across time. It is notable, then, that inter-individual connectomic differences clearly involve substantial ICN structure (which we further corroborate utilizing a novel quantitative approach based on stochastic block modeling). 1 = Somatomotor-hand; 2 = Somatomotor-faces; 3 = Cingulo-opercular; 4 = Auditory; 5 = Default; 6 = Memory retrieval; 7 = Visual; 8 = Fronto-parietal; 9 = Salience; 10 = Subcortical; 11 = Ventral Attention; 12 = Dorsal Attention; 13 = Cerebellum.
Figure 6
Figure 6
Profile Log-Likelihood of ICN-Based Community Structure in Each Component. This statistic serves to quantify presence of ICN structure in each component using a stochastic block model (SBM) framework. The blue trace is the profile log-likelihood from the SBM according to the community assignments given in Power et al.. Note that ICN structure is most prominent in early (high variance explained) components. The red trace is the median profile log-likelihood across many random shufflings of the community assignments and serves as a null distribution. Of note, the 95% confidence interval of the null distribution is plotted on the red line, but it is very narrow and not easily visible.

References

    1. Van Dijk KRA, et al. Intrinsic functional connectivity as a tool for human connectomics: theory, properties, and optimization. J. Neurophysiol. 2010;103:297–321. doi: 10.1152/jn.00783.2009. - DOI - PMC - PubMed
    1. Buckner RL, Krienen FM, Yeo BTT. Opportunities and limitations of intrinsic functional connectivity MRI. Nat. Neurosci. 2013;16:832–837. doi: 10.1038/nn.3423. - DOI - PubMed
    1. Smith SM, et al. Functional connectomics from resting-state fMRI. Trends Cogn. Sci. 2013;17:666–682. doi: 10.1016/j.tics.2013.09.016. - DOI - PMC - PubMed
    1. Biswal BB, et al. Toward discovery science of human brain function. Proc. Natl. Acad. Sci. 2010;107:4734–4739. doi: 10.1073/pnas.0911855107. - DOI - PMC - PubMed
    1. Lee MH, Smyser CD, Shimony JS. Resting-State fMRI: A Review of Methods and Clinical Applications. Am. J. Neuroradiol. 2013;34:1866–1872. doi: 10.3174/ajnr.A3263. - DOI - PMC - PubMed

Publication types