. 2019 Feb 13;9(1):1998.
doi: 10.1038/s41598-019-39096-3.

Conservation implications of turtle declines in Australia's Murray River system

Affiliations

Conservation implications of turtle declines in Australia's Murray River system

J U Van Dyke et al. Sci Rep. .

Abstract

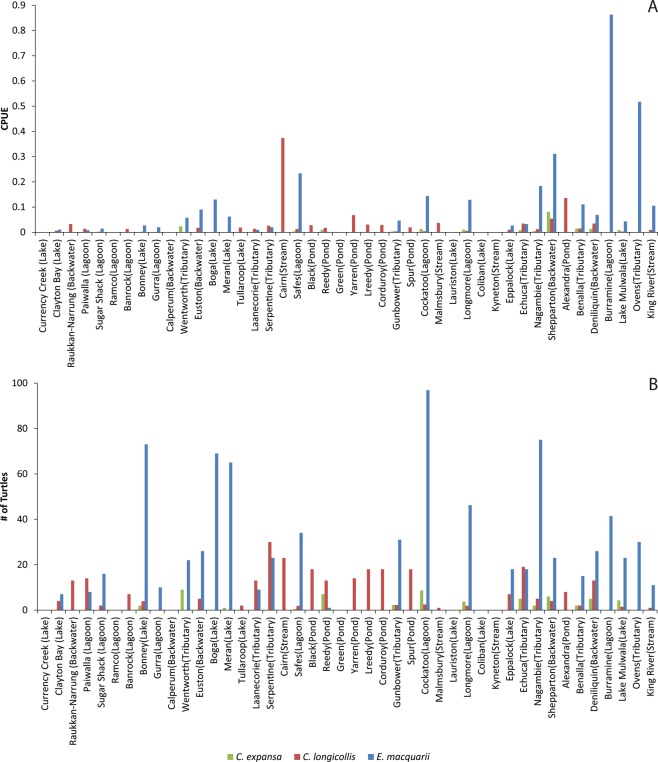
Conservation requires rapid action to be effective, which is often difficult because of funding limitations, political constraints, and limited data. Turtles are among the world's most endangered vertebrate taxa, with almost half of 356 species threatened with extinction. In Australia's Murray River, nest predation by invasive foxes (Vulpes vulpes) was predicted to drive turtle declines in the 1980s. We assessed populations of the broad-shelled turtle (Chelodina expansa), eastern long-necked turtle (C. longicollis), and Murray River turtle (Emydura macquarii) in the Murray River and some of its associated waterways. Our results suggest that the predicted decline is occurring. All three species are rare in the lower Murray River region, and were undetected in many locations in South Australia. Moreover, E. macquarii had considerable population aging almost everywhere, possibly due to comprehensive nest destruction by foxes. Chelodina longicollis also had population aging at some sites. Sustained low recruitment has potential to lead to collapses as turtles age, which is particularly worrying because it was predicted over 30 years ago and may have already occurred in South Australia. Our results show that turtle declines were not mitigated since that prediction. If the crash continues, a vertebrate guild responsible for considerable nutrient cycling in the aquatic ecosystem will disappear. Our results highlight a worst-case outcome when species declines are predicted, but insufficiently mitigated.


Conflict of interest statement

The authors declare no competing interests.

Figures

Figure 1
Figure 1
(A) Turtle CPUE (turtles per trap-hour) and (B). Total number of each species caught for each site trapped in the study, with site names and designations. Sites are ordered left-right from downstream-upstream. Far upstream sites where 0 turtles were caught and which are likely beyond extant turtle ranges have been removed for clarity.
Figure 2
Figure 2
Mean catch-per-unit-effort (CPUE; turtles per trap-hour) of (A) Chelodina expansa increased slightly with increasing distance from the Murray River mouth, regardless of wetland type, but this relationship was not retained in reduced models (Table S1). (B) CPUE of C. longicollis increased with increasing distance to the Murray River, and was higher in ponds than in other types of wetlands. The relationship with distance from the Murray River was not retained in a reduced model, but the difference between ponds and other wetlands was (Table S1). (C) CPUE of Emydura macquarii increased with distance from the Murray River mouth and also significantly higher in backwaters, lagoons, lakes and tributaries (BLLT) than in ponds and streams (PS). Lines on each graph represent best-fit regressions identified in log-linear ANCOVAs (Table 1).
Figure 3
Figure 3
Mean percentages of populations of (A) Chelodina longicollis made up by large adults and juveniles, and (B) Emydura macquarii large females, large males, and juveniles. We present the data for both species as percentages for clarity, but we accounted for the number of turtles caught in each site using a log-linear ANCOVA on the raw numbers of each sex-size group, rather than on percentages. Error bars represent ± 1 SE, and letters indicate pairwise significant differences between size/sex number within each habitat type. Mean percentages do not sum to 100% because we did not include the percentages of intermediate-aged turtles in these analyses.
Figure 4
Figure 4
Locations of all trapping sites (dots) in our study area.

References

    1. Ceballos G, et al. Accelerated modern human–induced species losses: Entering the sixth mass extinction. Science Advances. 2015;1:e1400253. doi: 10.1126/sciadv.1400253. - DOI - PMC - PubMed
    1. Dirzo R, et al. Defaunation in the anthropocene. Science. 2014;345:401–406. doi: 10.1126/science.1251817. - DOI - PubMed
    1. Barnosky AD, et al. Has the Earth’s sixth mass extinction already arrived? Nature. 2011;471:51–57. doi: 10.1038/nature09678. - DOI - PubMed
    1. Lister, B. C. & Garcia, A. Climate-driven declines in arthropod abundance restructure a rainforest food web. Proceedings of the National Academy of Sciences, 10.1073/pnas.1722477115 (2018). - PMC - PubMed
    1. Purvis A, Gittleman JL, Cowlishaw G, Mace GM. Predicting extinction risk in declining species. Proceedings of the Royal Society B, Biological Sciences. 2000;267:1947–1952. doi: 10.1098/rspb.2000.1234. - DOI - PMC - PubMed

Publication types