. 2019 Feb 13;9(1):1921.
doi: 10.1038/s41598-019-38600-z.

The Th17/Treg Cytokine Imbalance in Chronic Obstructive Pulmonary Disease Exacerbation in an Animal Model of Cigarette Smoke Exposure and Lipopolysaccharide Challenge Association

Affiliations

The Th17/Treg Cytokine Imbalance in Chronic Obstructive Pulmonary Disease Exacerbation in an Animal Model of Cigarette Smoke Exposure and Lipopolysaccharide Challenge Association

Daniela A B Cervilha et al. Sci Rep. .

Abstract

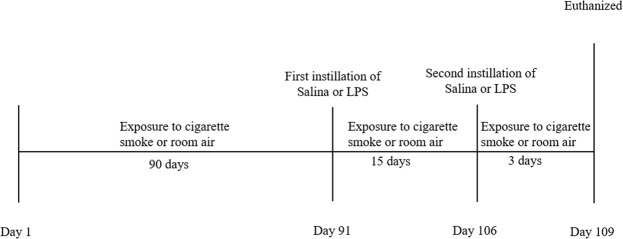
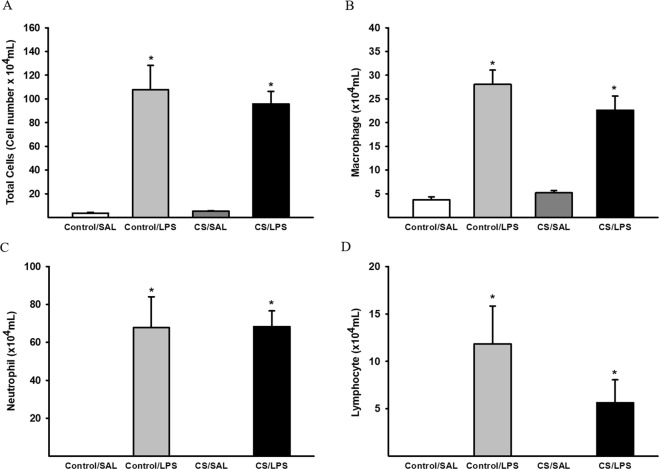
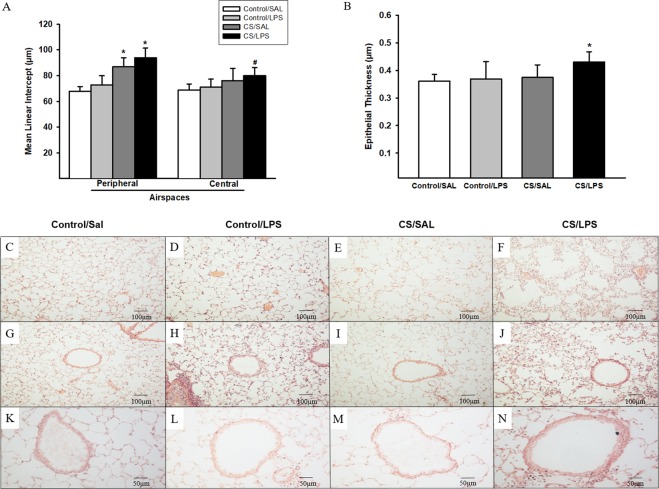
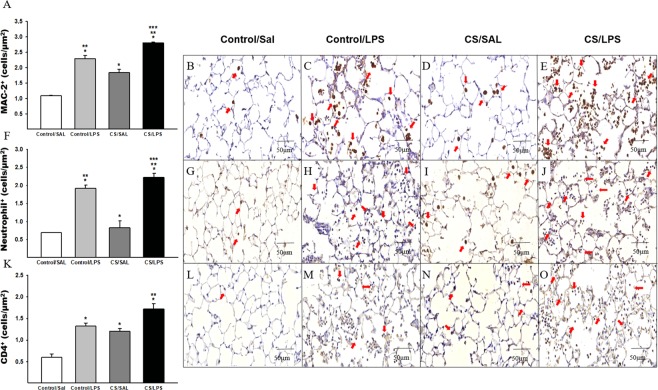
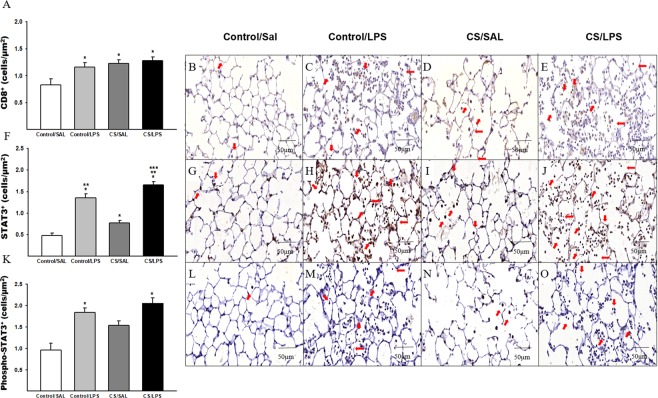
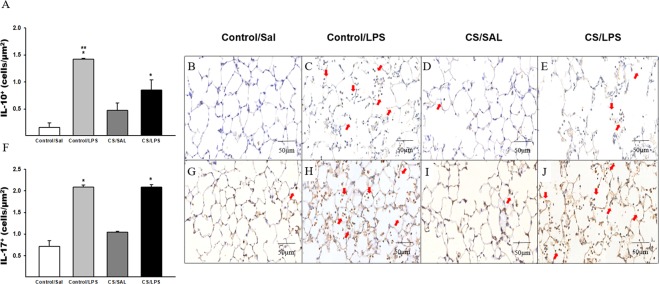
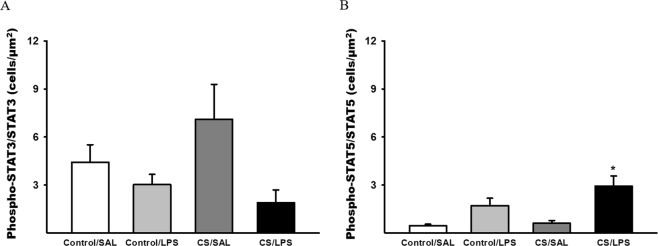
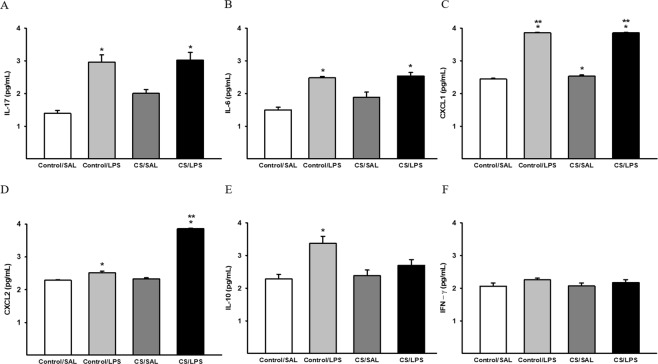
We proposed an experimental model to verify the Th17/Treg cytokine imbalance in COPD exacerbation. Forty C57BL/6 mice were exposed to room air or cigarette smoke (CS) (12 ± 1 cigarettes, twice a day, 30 min/exposure and 5 days/week) and received saline (50 µl) or lipopolysaccharide (LPS) (1 mg/kg in 50 µl of saline) intratracheal instillations. We analyzed the mean linear intercept, epithelial thickness and inflammatory profiles of the bronchoalveolar lavage fluid and lungs. We evaluated macrophages, neutrophils, CD4+ and CD8+ T cells, Treg cells, and IL-10+ and IL-17+ cells, as well as STAT-3, STAT-5, phospho-STAT3 and phospho-STAT5 levels using immunohistochemistry and IL-17, IL-6, IL-10, INF-γ, CXCL1 and CXCL2 levels using ELISA. The study showed that CS exposure and LPS challenge increased the numbers of neutrophils, macrophages, and CD4+ and CD8+ T cells. Simultaneous exposure to CS/LPS intensified this response and lung parenchymal damage. The densities of Tregs and IL-17+ cells and levels of IL-17 and IL-6 were increased in both LPS groups, while IL-10 level was only increased in the Control/LPS group. The increased numbers of STAT-3, phospho-STAT3, STAT-5 and phospho-STAT5+ cells corroborated the increased numbers of IL-17+ and Treg cells. These findings point to simultaneous challenge with CS and LPS exacerbated the inflammatory response and induced diffuse structural changes in the alveolar parenchyma characterized by an increase in Th17 cytokine release. Although the Treg cell differentiation was observed, the lack of IL-10 expression and the decrease in the density of IL-10+ cells observed in the CS/LPS group suggest that a failure to release this cytokine plays a pivotal role in the exacerbated inflammatory response in this proposed model.


Conflict of interest statement

The authors declare no competing interests.

Figures

Figure 1
Figure 1
Timeline of the experimental protocol.
Figure 2
Figure 2
Inflammatory cells in the BAL. (A) Total cells, *p < 0.001 compared to Control/SAL and CS/SAL; Control/SAL n = 10, Control/LPS n = 6, CS/SAL n = 9, CS/LPS n = 7. ANOVA, Holm-Sidak post hoc. (B) Macrophages, *p < 0.001 compared to Control/SAL and CS/SAL; Control/SAL n = 10, Control/LPS n = 7, CS/SAL n = 6, CS/LPS n = 7. (C) Neutrophils, *p < 0.001 compared to Control/SAL and CS/SAL; Control/SAL n = 10, Control/LPS n = 6, CS/SAL n = 7, CS/LPS n = 7. (D) Lymphocyte, *p < 0.001 compared to Control/SAL and CS/SAL. Control/SAL n = 10, Control/LPS n = 4, CS/SAL n = 7, CS/LPS n = 7. Kruskal-Wallis, Dunn’s post hoc. Data are presented as means and SE.
Figure 3
Figure 3
Mean linear intercept measured in subpleural airspaces and peribronchial airspaces and epithelial thickness in the experimental groups. (A) Lm: *p < 0.001 compared to Control/SAL and Control/LPS groups. Control/SAL n = 9, Control/LPS n = 9, CS/SAL n = 8, CS/LPS n = 5. ANOVA, Holm-Sidak post hoc. #p = 0.02 compared to Control/SAL. Control/SAL n = 9, Control/LPS n = 9, CS/SAL n = 8, CS/LPS n = 5. Kruskal-Wallis, Dunn’s post hoc. Photomicrographs of Lm in subpleural airspaces and peribronchial airspaces. (C,G) Control/SAL group; (D,H) Control/LPS group; (E,I) CS/SAL group and (F,J) CS/LPS group, respectively, 200X magnification. (B) Epithelial thickness: *p = 0.02 compared to Control/SAL. Control/SAL n = 9, Control/LPS n = 9, CS/SAL n = 8, CS/LPS n = 5. ANOVA, Holm-Sidak post hoc. Photomicrographs of epithelial thickness in airways (K) Control/SAL group; (L) Control/LPS group; (M) CS/SAL group and (N) CS/LPS group. Data are presented as means and SE. 400X magnification.
Figure 4
Figure 4
The density of positive cells for MAC-2, neutrophils and CD4+ in experimental groups. (A) MAC-2: *p < 0.001 compared to Control/SAL; **p < 0.001 compared to CS/SAL group and ***p < 0.001 compared to Control/LPS group. Control/SAL n = 9, Control/LPS n = 9, CS/SAL n = 7, CS/LPS n = 5. Photomicrographs of MAC-2 in lung parenchyma (B) Control/SAL group; (C) Control/LPS group; (D) CS/SAL group and (E) CS/LPS group, 400X magnification. (F) Neutrophils: *p < 0.001 compared to Control/SAL; **p < 0.001 compared to CS/SAL group and ***p < 0.001 compared to Control/LPS group. Control/SAL n = 9, Control/LPS n = 9, CS/SAL n = 8, CS/LPS n = 5. Photomicrographs of neutrophils in lung parenchyma (G) Control/SAL group; (H) Control/LPS group; (I) CS/SAL group and (J) CS/LPS group, 400X magnification. (K) CD4+: *p < 0.001 compared to Control/SAL. **p < 0.001 compared to CS/SAL and Control/LPS groups. Control/SAL n = 9, Control/LPS n = 9, CS/SAL n = 8, CS/LPS n = 5. Photomicrographs of CD4 T cells in lung parenchyma (L) Control/SAL group; (M) Control/LPS group; (N) CS/SAL group and (O) CS/LPS group, 400X magnification. Data were expressed as log10 base. ANOVA, Holm-Sidak post hoc. Data are presented as means and SE.
Figure 5
Figure 5
The density of positive cells for CD8+, STAT3 and Phospho-STAT3 in experimental groups. (A) CD8+: *p = 0.006 compared to Control/SAL. Control/SAL n = 9, Control/LPS n = 9, CS/SAL n = 8, CS/LPS n = 5. Photomicrographs of CD8 T cells in lung parenchyma (B) Control/SAL group; (C) Control/LPS group; (D) CS/SAL group and (E) CS/LPS group, 400X magnification. (F) STAT3: *p < 0.001 compared to Control/SAL; **p < 0.001 compared to CS/SAL group and ***p < 0.001 compared to Control/LPS group. Control/SAL n = 7, Control/LPS n = 9, CS/SAL n = 6, CS/LPS n = 5. Photomicrographs of STAT3 in lung parenchyma (G) Control/SAL group; (H) Control/LPS group; (I) CS/SAL group and (J) CS/LPS group, 400X magnification. Data were expressed as log10 base. ANOVA, Holm-Sidak post hoc. Data are presented as means and SE. (K) Phospho-STAT3: *p < 0.001 compared to Control/SAL. Control/SAL n = 8, Control/LPS n = 8, CS/SAL n = 8, CS/LPS n = 4. Photomicrographs of Phospho-STAT3 in lung parenchyma (L) Control/SAL group; (M) Control/LPS group; (N) CS/SAL group and (O) CS/LPS group, 400X magnification. Data were expressed as log10 base. Kruskal-Wallis, Dunn’s post hoc. Data are presented as means and SE.
Figure 6
Figure 6
The density of positive cells for FOXP3, STAT5 and Phospho-STAT5 in experimental groups. (A) FOXP3: *p = 0.01 compared to Control/SAL. Control/SAL n = 9, Control/LPS n = 9, CS/SAL n = 8, CS/LPS n = 5. Photomicrographs of FOXP3 cells in lung parenchyma (B) Control/SAL group; (C) Control/LPS group; (D) CS/SAL group and (E) CS/LPS group, respectively, 400X magnification. Data were expressed as log10 base. ANOVA, Holm-Sidak post hoc. Data are presented as means and SE. (F) STAT5: *p < 0.001 compared to Control/SAL and CS/SAL groups. Control/SAL n = 9, Control/LPS n = 9, CS/SAL n = 8, CS/LPS n = 5. Photomicrographs of STAT5 in lung parenchyma (G) Control/SAL group; (H) Control/LPS group; (I) CS/SAL group and (J) CS/LPS group, 400X magnification. Data were expressed as log10 base. Kruskal-Wallis, Dunn’s post hoc. Data are presented as means and SE. (K) Phospho-STAT5: *p < 0.001 compared to Control/SAL and CS/SAL groups; **p < 0.001 compared to Control/LPS group. Control/SAL n = 9, Control/LPS n = 9, CS/SAL n = 8, CS/LPS n = 5. Photomicrographs of Phospho-STAT5 in lung parenchyma (L) Control/SAL group; (M) Control/LPS group; (N) CS/SAL group and (O) CS/LPS group, 400X magnification. Data were expressed as log10 base. ANOVA, Holm-Sidak post hoc. Data are presented as means and SE.
Figure 7
Figure 7
The density of positive cells for IL-10 and IL-17 in experimental groups. (A) IL-10: *p = 0.001 compared to Control/SAL; **p = 0.001 compared to CS/SAL and CS/LPS. Control/SAL n = 6, Control/LPS n = 6, CS/SAL n = 6, CS/LPS n = 5. Photomicrographs of IL-10 cells in lung parenchyma (B) Control/SAL group; (C) Control/LPS group; (D) CS/SAL group and (E) CS/LPS group, 400X magnification. Data were expressed as log10 base. ANOVA, Holm-Sidak post hoc. Data are presented as means and SE. (F) IL-17: *p < 0.001 compared to Control/SAL group. Control/SAL n = 6, Control/LPS n = 6, CS/SAL n = 6, CS/LPS n = 5. Photomicrographs of IL-17 in lung parenchyma (G) Control/SAL group; (H) Control/LPS group; (I) CS/SAL group and (J) CS/LPS group, 400X magnification. Data were expressed as log10 base. Kruskal-Wallis, Dunn’s post hoc. Data are presented as means and SE.
Figure 8
Figure 8
The ratio of normalized of PhosphoStat3/Stat3 and PhosphoStat5/Stat5. (A) PhosphoStat3/Stat3, there were no significant differences in parameters values among the experimental groups. Control/SAL n = 7, Control/LPS n = 8, CS/SAL n = 6, CS/LPS n = 3. (B) PhosphoStat5/Stat5, *p = 0.002 compared to Control/SAL. Control/SAL n = 9, Control/LPS n = 9, CS/SAL n = 8, CS/LPS n = 4. Kruskal-Wallis, Dunn’s post hoc. Data were expressed as log10 base. Data are presented as means and SE.
Figure 9
Figure 9
Cytokines and chemokines in lung homogenates. (A) IL-17: *p < 0.001 compared to Control/SAL. Control/SAL n = 10, Control/LPS n = 6, CS/SAL n = 8, CS/LPS n = 7. Kruskal-Wallis, Dunn’s post hoc. (B) IL-6: *p < 0.001 compared to Control/SAL. Control/SAL n = 10, Control/LPS n = 6, CS/SAL n = 9, CS/LPS n = 7. Kruskal-Wallis, Dunn’s post hoc. (C) CXCL1: *p < 0.001 compared to Control/SAL and **p < 0.001 compared to CS/SAL. Control/SAL n = 10, Control/LPS n = 6, CS/SAL n = 9, CS/LPS n = 7. ANOVA, Holm-Sidak post hoc. (D) CXCL2: *p < 0.001 compared to Control/SAL and CS/SAL and **p < 0.001 compared to Control/LPS group. Control/SAL n = 10, Control/LPS n = 6, CS/SAL n = 9, CS/LPS n = 7. ANOVA, Holm-Sidak post hoc. (E) IL-10: *p < 0.01 compared to Control/SAL and CS/SAL. Control/SAL n = 10, Control/LPS n = 5, CS/SAL n = 7, CS/LPS n = 7. Kruskal-Wallis, Dunn’s post hoc. (F) IFN-γ: there were no significant differences in parameters values among the experimental groups. Control/SAL n = 10, Control/LPS n = 6, CS/SAL n = 9, CS/LPS n = 7. Kruskal-Wallis, Dunn’s post hoc. Data were expressed as log10 base. Data are presented as means and SE.
Figure 10
Figure 10
Representative photomicrographs of double immunostaining for FOXP3 (brown reaction product), IL-10 (red reaction product). FOXP3 positive cells was increased in parenchymal areas of CS/LPS while the co-localization of FOXP3/IL-10 (arrow) was found increased in Control/LPS group. (A) Control/LPS group and (B) CS/LPS group. 400X and 1000X magnification.

References

    1. Lozano R, et al. Global and regional mortality from 235 causes of death for 20 age groups in 1990 and 2010: a systematic analysis for the Global Burden of Disease Study 2010. Lancet. 2012;380:2095–2128. doi: 10.1016/S0140-6736(12)61728-0. - DOI - PMC - PubMed
    1. Mathers CD, Loncar D. Projections of global mortality and burden of disease from 2002 to 2030. PLoS medicine. 2006;3:e442. doi: 10.1371/journal.pmed.0030442. - DOI - PMC - PubMed
    1. Silverman EK, Speizer FE. Risk factors for the development of chronic obstructive pulmonary disease. The Medical clinics of North America. 1996;80:501–522. doi: 10.1016/S0025-7125(05)70451-X. - DOI - PubMed
    1. Taylor JD. COPD and the response of the lung to tobacco smoke exposure. Pulmonary pharmacology & therapeutics. 2010;23:376–383. doi: 10.1016/j.pupt.2010.04.003. - DOI - PubMed
    1. Patel IS, et al. Relationship between bacterial colonisation and the frequency, character, and severity of COPD exacerbations. Thorax. 2002;57:759–764. doi: 10.1136/thorax.57.9.759. - DOI - PMC - PubMed

Publication types

MeSH terms