. 2019 Feb;566(7744):383-387.
doi: 10.1038/s41586-019-0948-2. Epub 2019 Feb 13.

Sleep modulates haematopoiesis and protects against atherosclerosis

Affiliations

Sleep modulates haematopoiesis and protects against atherosclerosis

Cameron S McAlpine et al. Nature. 2019 Feb.

Abstract

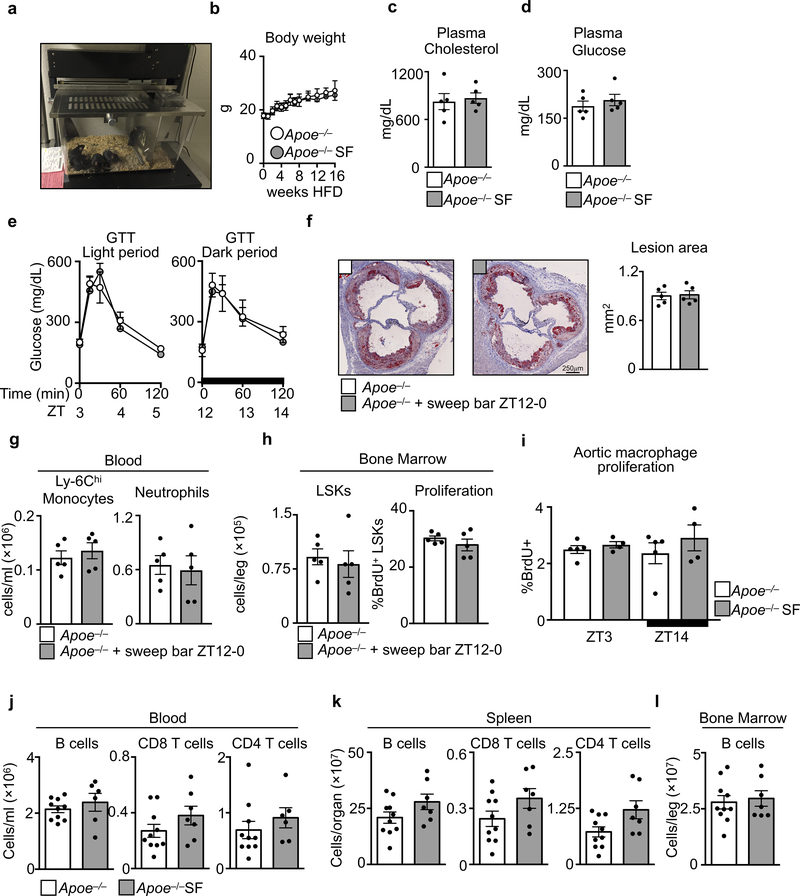
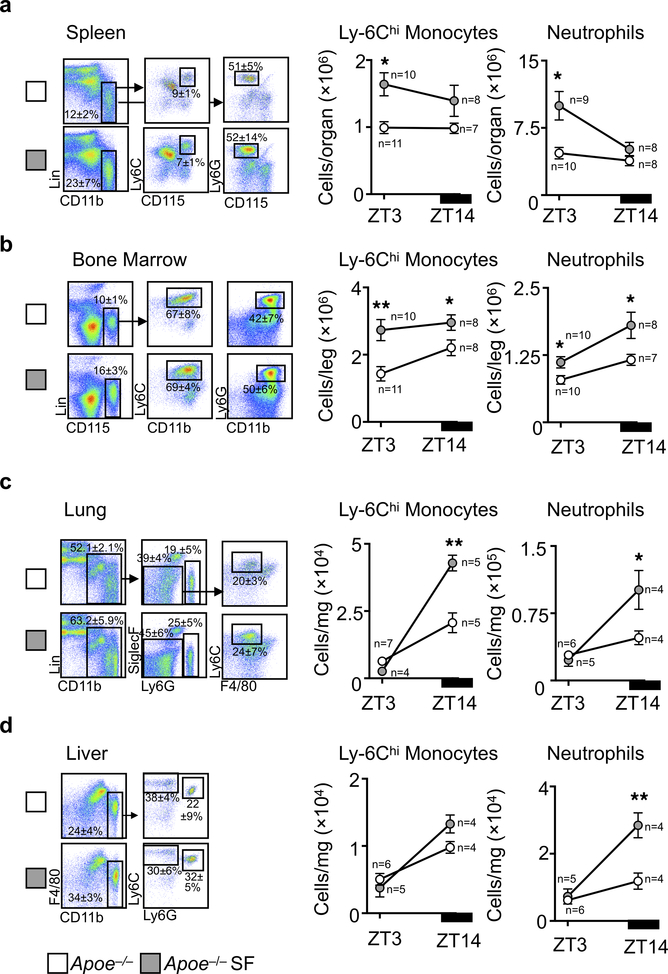
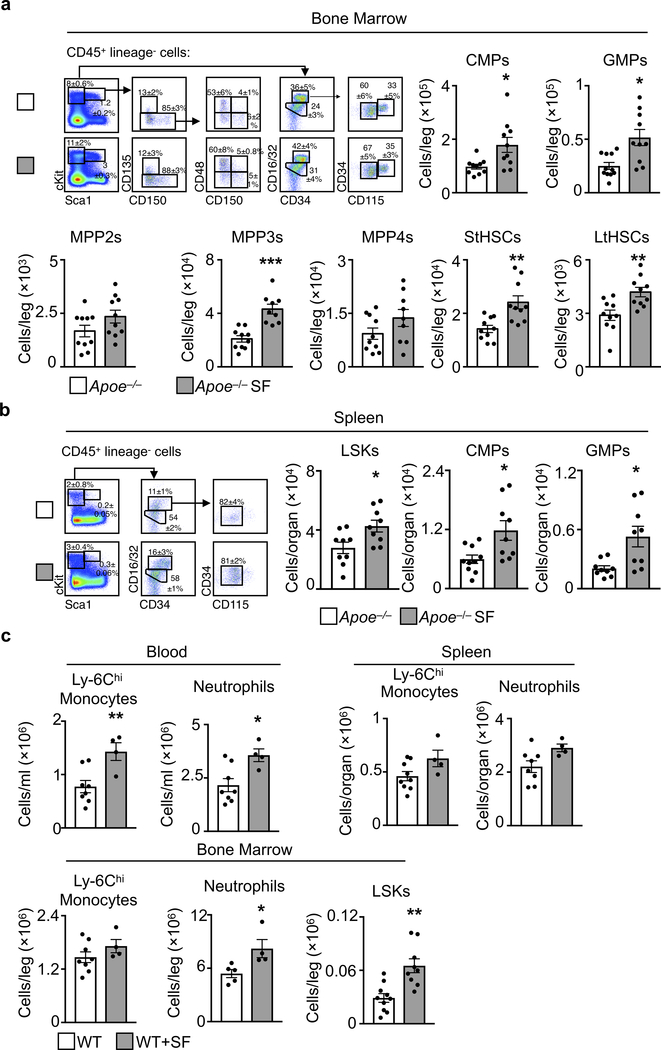
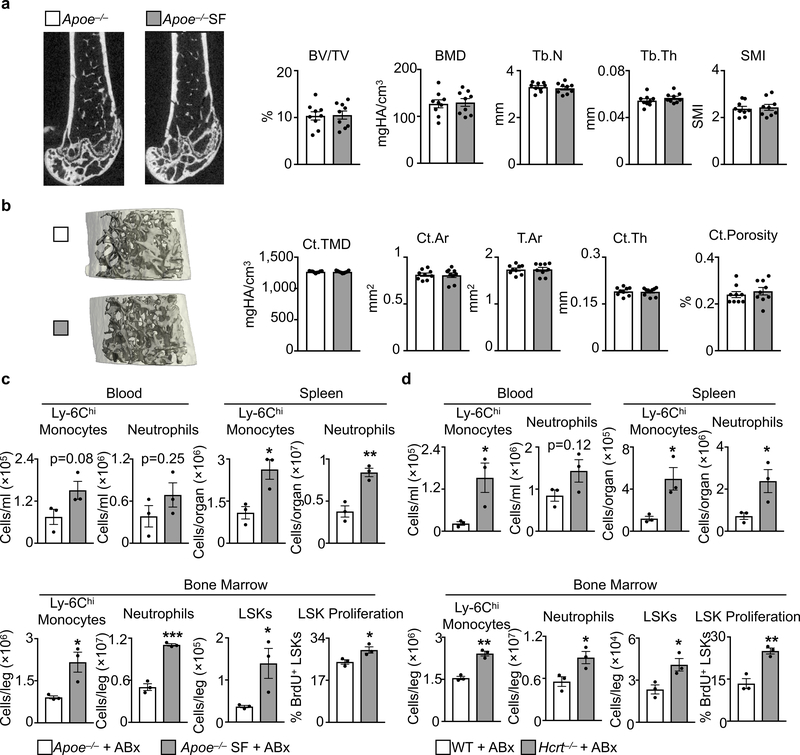
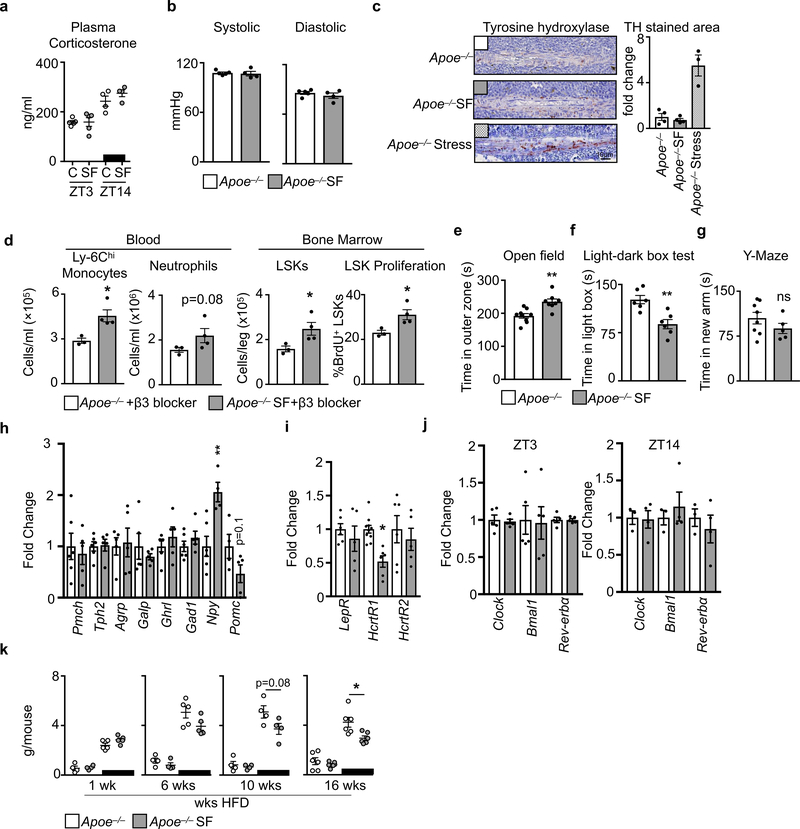
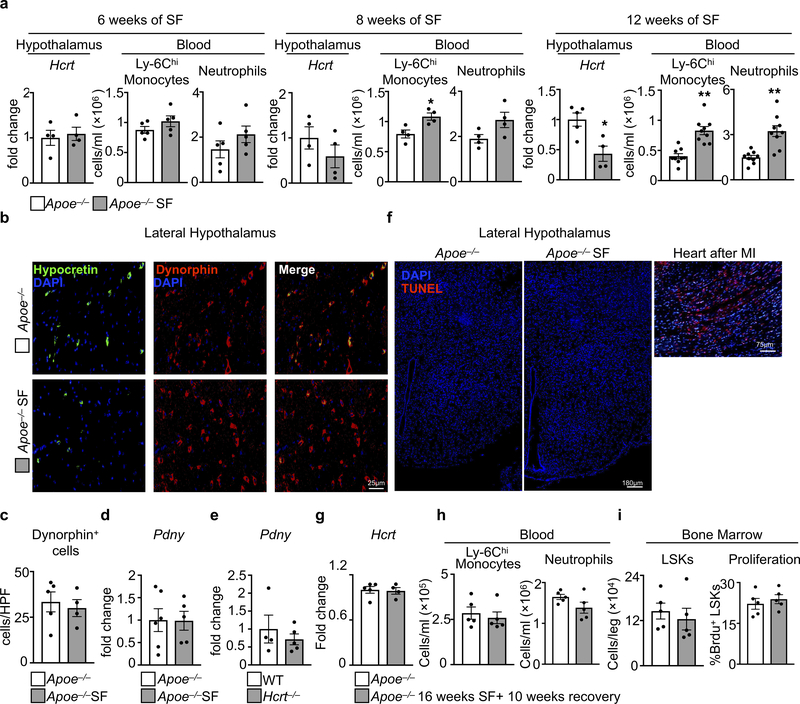
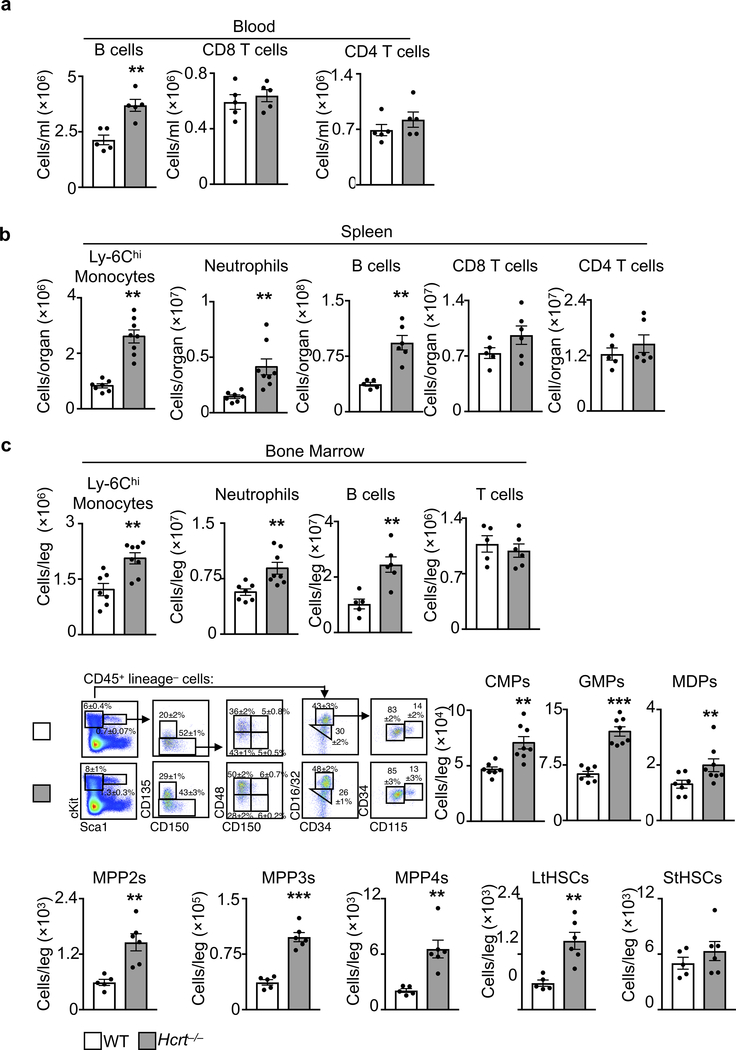
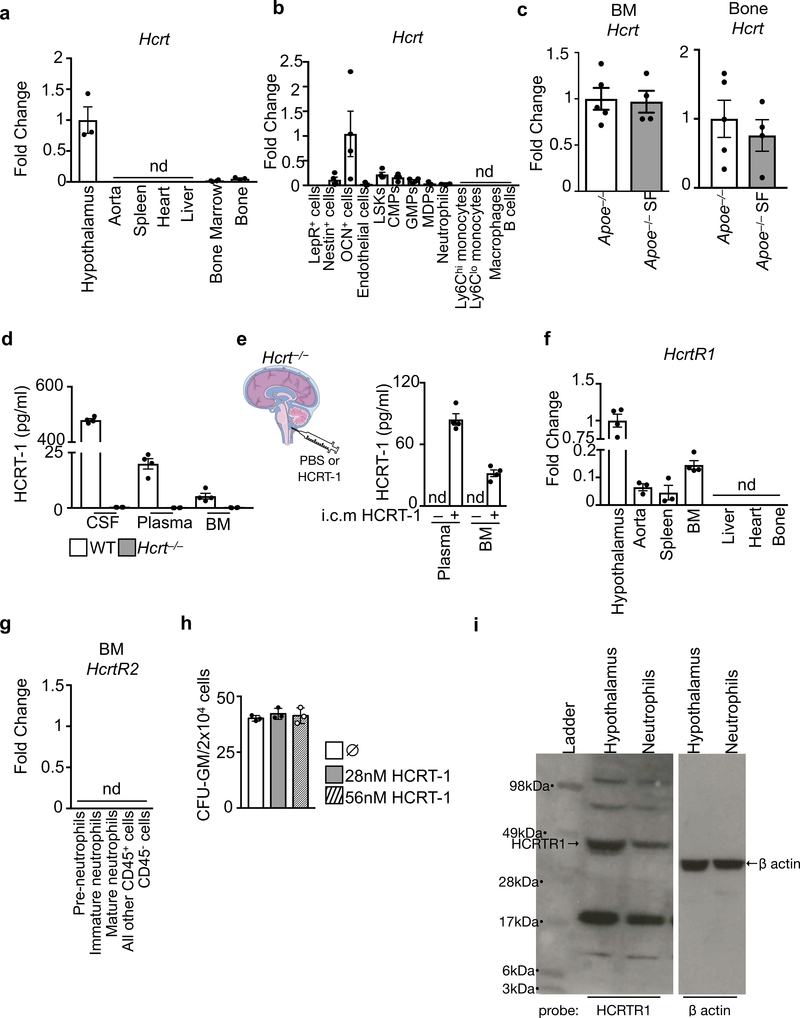
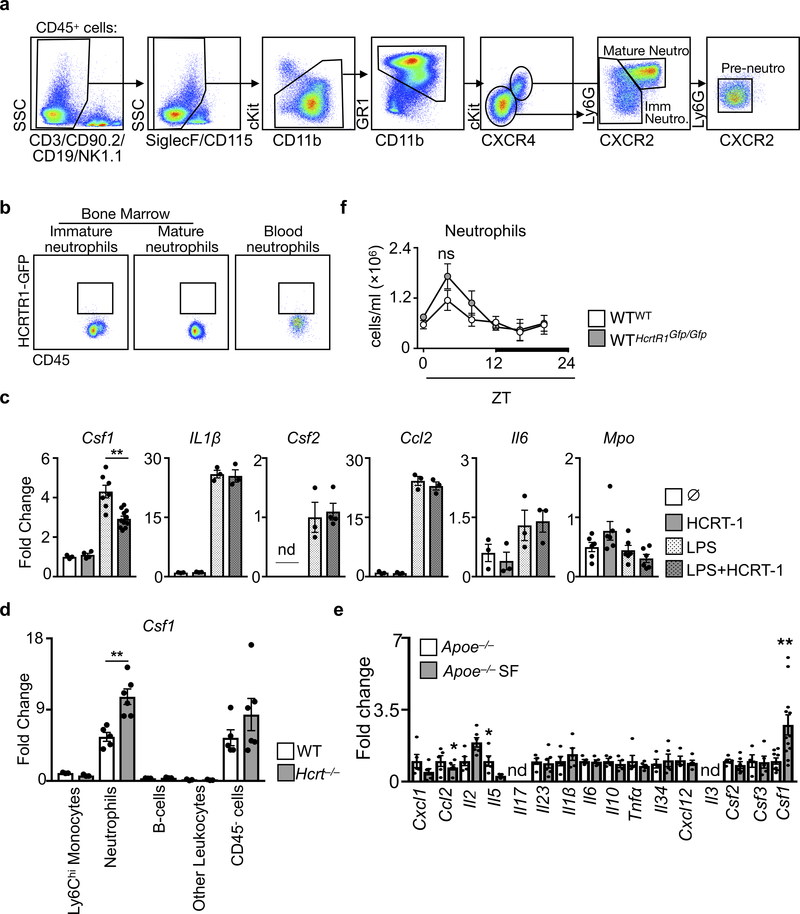
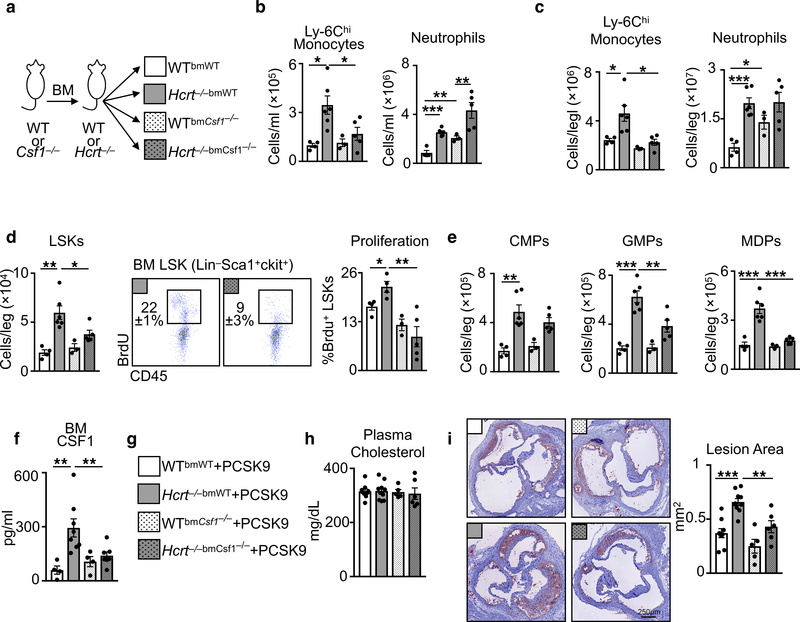
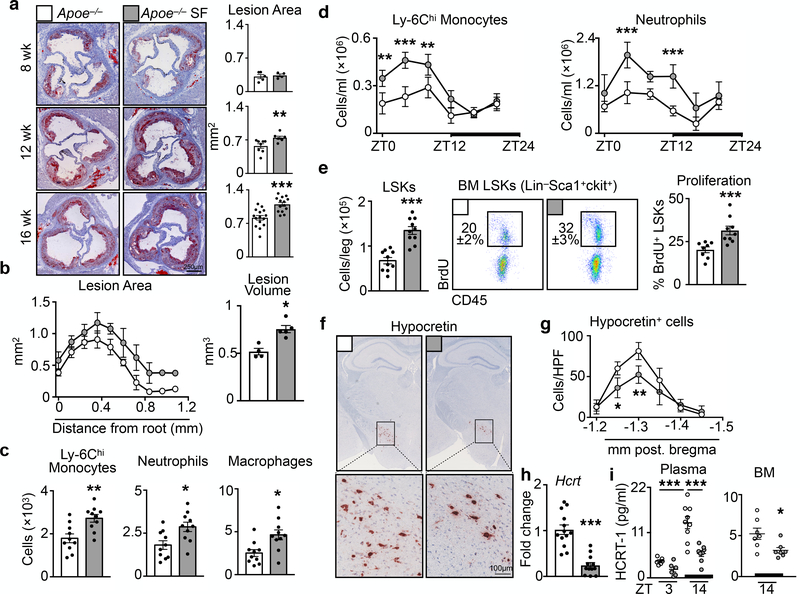
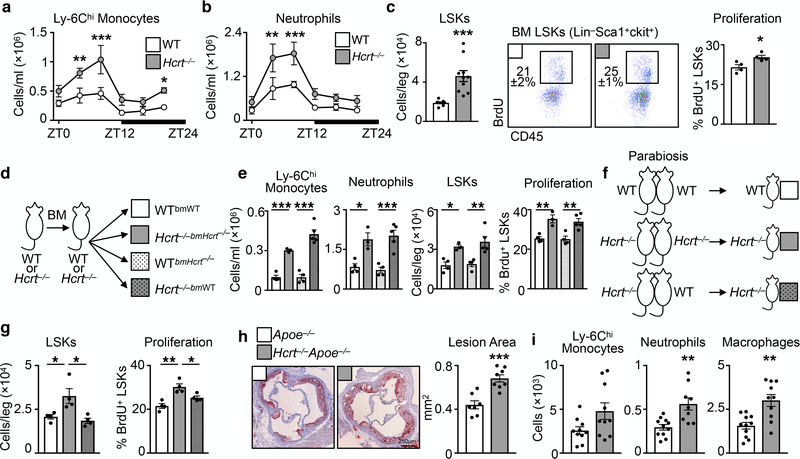
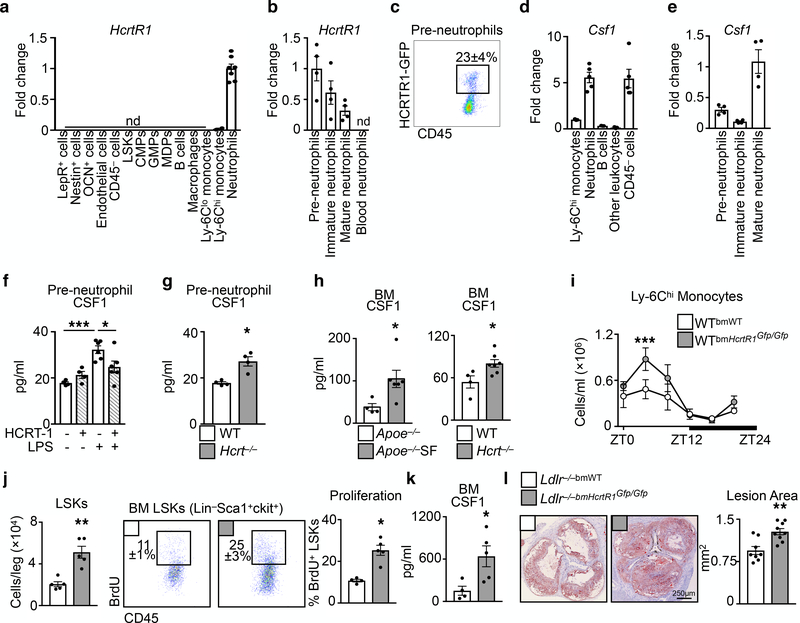
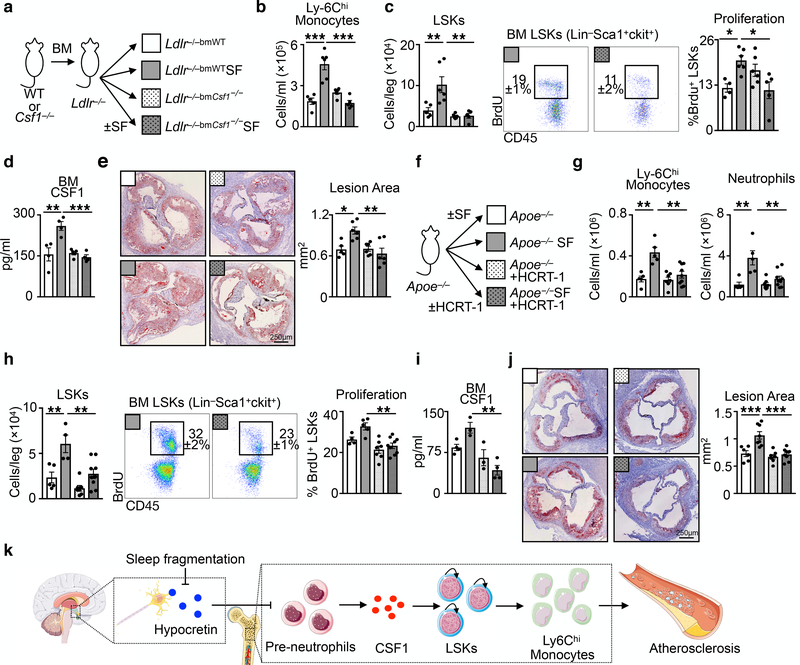
Sleep is integral to life1. Although insufficient or disrupted sleep increases the risk of multiple pathological conditions, including cardiovascular disease2, we know little about the cellular and molecular mechanisms by which sleep maintains cardiovascular health. Here we report that sleep regulates haematopoiesis and protects against atherosclerosis in mice. We show that mice subjected to sleep fragmentation produce more Ly-6Chigh monocytes, develop larger atherosclerotic lesions and produce less hypocretin-a stimulatory and wake-promoting neuropeptide-in the lateral hypothalamus. Hypocretin controls myelopoiesis by restricting the production of CSF1 by hypocretin-receptor-expressing pre-neutrophils in the bone marrow. Whereas hypocretin-null and haematopoietic hypocretin-receptor-null mice develop monocytosis and accelerated atherosclerosis, sleep-fragmented mice with either haematopoietic CSF1 deficiency or hypocretin supplementation have reduced numbers of circulating monocytes and smaller atherosclerotic lesions. Together, these results identify a neuro-immune axis that links sleep to haematopoiesis and atherosclerosis.


Conflict of interest statement

Competing Financial Interests

None.

Figures

Extended Data Figure 1.
Extended Data Figure 1.. Effects of sleep fragmentation on metabolic and cellular parameters.
a, Image of a sleep fragmentation cage. b, Body weight (n=10 per group). c, Plasma cholesterol at ZT3 (n=5 per group). d, Plasma glucose at ZT3 (n=5 per group). e, Glucose tolerance test (GTT) beginning at ZT3 and ZT12 (n=4 per group). f-h, Apoe−/− mice were placed in sleep fragmentation chambers where the sweep bar operated during the dark period (ZT12–0) when mice are normally awake. Control mice were maintained in SF chambers with a stationary sweep bar. f, Assessment of atherosclerosis and lesion area (n=5 per group). g, Assessment of blood Ly-6Chi monocytes and neutrophils (n=5 per group). h, Assessment of bone marrow LSKs and proliferation (n=5 per group). i, Aortic macrophage proliferation in Apoe−/− and Apoe−/− SF mice after 16 weeks of SF at ZT3 and ZT14 (n=5 Apoe−/−; n=4 Apoe−/− SF). j, Quantification at ZT3 in Apoe−/− and Apoe−/−SF mice of B cells, CD4+ T cells and CD8+ T cells in blood (n=10 Apoe−/−; for B and CD4 T cells n=6 Apoe−/− SF for CD8 T cells n=7 Apoe−/− SF), k, spleen (n=10 Apoe−/−; n=7 Apoe−/− SF) and l, B cells in bone marrow (n=10 Apoe−/−; n=7 Apoe−/− SF). Data presented as mean ± s.e.m.
Extended Data Figure 2.
Extended Data Figure 2.. Sleep and circadian leukocyte migration.
Enumeration of Ly-6Chi monocytes and neutrophils at ZT3 and ZT14 in a, spleen, b, bone marrow, c, lung, and d, liver of Apoe−/− mice and Apoe−/− mice after 16 weeks of SF. Group sizes are indicated within the figure. Data presented as mean ± s.e.m., *p<0.05, **p<0.01,***p<0.001, Two-way ANOVA.
Extended Data Figure 3.
Extended Data Figure 3.. Sleep mediated hematopoiesis and extramedullary hematopoiesis.
a, Gating strategy and quantification of hematopoietic progenitor cells at ZT3 in the bone marrow (n=10 Apoe−/− except GMPs n=11; n=10 Apoe−/− SF except MPP3 and MPP4 n=9) and b, spleen (n=9 Apoe−/− except CMP n=10; n=9 Apoe−/−SF). c, C57BL/6 wildtype (WT) mice consuming a regular chow diet were subjected to SF for 16 weeks after which Ly-6Chi monocytes, neutrophils and LSKs were enumerated at ZT3 (n= 8 WT except n=9 spleen Ly-6Chi monocytes, n=5 BM neutrophils, n=10 BM LSKs; n=4 WT+SF except BM LSKs n=9). Data presented as mean ± s.e.m., *p<0.05, **p<0.01,***p<0.001, Mann-Whitney two-tailed tests.
Extended Data Figure 4.
Extended Data Figure 4.. Sleep fragmentation does not alter bone structure and does not depend on the microbiome.
μCT analysis of a, tribeculae and b, cortical bone structure of Apoe−/− mice and Apoe−/− mice after 16 weeks of SF. Bone Volume Fraction (BV/TV), Bone Mineral Density (BMD), Trabecular Number (Tb.N), Trabecular Thickness (Tb.Th), Structural Model Index (SMI), Cortical Tissue Mineral Density (Ct.TMD), Cortical Area (Ct.Ar), Total Area (T.Ar), Cortical Thickness (Ct.Th), Cortical Porosity (Ct.Porosity). (n=9 per group) Analysis of leukocytosis in c, SF and d, Hcrt−/− mice at ZT3 after receiving 4 weeks of antibiotic cocktail in drinking water (n=3 per group). Data presented as mean ± s.e.m., *p<0.05,**p<0.01,***p<0.001, Mann-Whitney two-tailed tests.
Extended Data Figure 5.
Extended Data Figure 5.. Sleep fragmentation does not activate the peripheral sympathetic nervous system but has effects on hypothalamic gene transcription and food consumption.
a, Plasma corticosterone levels in Apoe−/− mice and Apoe−/− mice after 16 weeks of SF at ZT3 and ZT14 (n=4 per group except n=5 Apoe−/−ZT3). b, Systolic and diastolic blood pressure at ZT3 (n=4 per group). c, Immunohistochemical analysis and quantification of tyrosine hydroxylaze (TH) staining in the bone marrow of Apoe−/− mice, Apoe−/−SF mice, and Apoe−/− mice subjected to 3 weeks of chronic variable stress (n=4 Apoe−/−; n=4 Apoe−/−SF; n=3 Apoe−/−stress). d, Enumeration at ZT3 of blood Ly-6Chi monocytes and neutrophils, bone marrow LSKs and proliferation in Apoe−/− mice and Apoe−/−SF mice after antagonism of the β3 receptor for 4 weeks (n=3 Apoe−/−+β3 blocker; n=4 Apoe−/−SF+β3 blocker). e, Quantification of time in outer zone during open field test (n=9 Apoe−/−; n=8 Apoe−/−SF). f, Quantification of time spent in light box during light/dark box test (n=6 per group). g, Quantification of time in new arm during Y-maze test (n=8 Apoe−/−; n=5 Apoe−/−SF). h, Analysis of neuropeptide expression in the hypothalamus at ZT3 (n=5 Apoe−/− except n=6 for Pmch, Tph2, Gad1,and Npy; n=5 Apoe−/−SF except n=4 for Npy). i, Neuropeptide receptor expression in the hypothalamus at ZT3 (n=6 Apoe−/− except HcrtR1 n=10; n=5 Apoe−/−SF except HcrtR2 n=6). j, Circadian gene expression in the hypothalamus at ZT3 and ZT14 (n=3 Apoe−/−; n=4 Apoe−/−SF). k, Mouse food consumption during the course of SF (n=4 Apoe−/−ZT3 except n=6 16wksApoe−/−ZT3; n=4 Apoe−/−SFZT3 except n=6 16wksApoe−/−ZT3; n=5 Apoe−/−ZT14 except n=4 10wksApoe−/−ZT14 and n=6 16wksApoe−/−ZT14; n=5 Apoe−/−SFZT14 except n=4 10wksApoe−/−SFZT14 and n=6 16wksApoe−/−SFZT14). Data presented as mean ± s.e.m., *p<0.05, **p<0.01,***p<0.001, Mann-Whitney two-tailed tests.
Extended Data Figure 6.
Extended Data Figure 6.. Hypothalamic expression of hypocretin and dynorphin.
a, Hypothalamic expression of hypocretin and blood Ly-6Chi monocyte and neutrophil enumeration in Apoe−/− mice after 6, 8, and 12 weeks of SF. (for Hcrt n=4 Apoe−/− except n=5 for 12wks Apoe−/−; for Hcrt n=4 Apoe−/−SF; for blood cells at 6wks n=5 per group; for blood cells at 8 wks n=4 per group; for blood cells at 12 wks n=9 per group). b, Sections of the hypothalamus probed for dynorphin and hypocretin. c, Quantification of hypothalamic dynorphin+ cells per high powered field of view (HPV) (n=5 Apoe−/−; n=4 Apoe−/−SF, of 2 independent experiments). Dynorphin (Pdny) mRNA expression in hypothalamus of d, SF mice (n=6 Apoe−/−; n=5 Apoe−/−SF) and e, Hcrt−/− mice (n=4 WT; n= 5 Hcrt−/−). f, TUNEL staining of hypothalamic sections from Apoe−/− and Apoe−/− SF mice (representative of 4 biological replicates) along with a positive control of TUNEL stained myocardium 1 day after myocardial infarction (n = 1). g-i, Apoe−/− mice were sleep fragmented for 16 weeks then allowed to recover and sleep normally for 10 weeks. Control mice slept normally for 26 weeks. g, Analysis of hypothalamic hypocretin expression (n=5 Apoe−/−; n=4 Apoe−/−SF). h, Blood Ly-6Chi monocytes and neutrophils (n=5 per group). i, Bone marrow LSKs and LSK proliferation. (n=5 per group). Data presented as mean ± s.e.m., *p<0.05, **p<0.01,***p<0.001, Mann-Whitney two-tailed tests.
Extended Data Figure 7.
Extended Data Figure 7.. Hematopoiesis in hypocretin-deficient mice.
Leukocyte enumeration in WT and Hcrt−/− mice at ZT3 in a, blood (n=5 per group), b, spleen (for Ly-6Chi monocytes and neutrophils n=7 WT and n=8 Hcrt−/−; for B, CD8 T, and CD4 T cells n=5 WT and n=6 Hcrt−/−) and c, bone marrow (for Ly-6Chi monocytes and neutrophils n=7 WT and n=8 Hcrt−/−; for B and T cells n=5 WT and n=6 Hcrt−/−; for CMPs, GMPs and MDPs n=7 WT and n=8 Hcrt−/−; for LSK populations n=5 WT and n=6 Hcrt−/−). Data presented as mean ± s.e.m., *p<0.05, **p<0.01,***p<0.001, Mann-Whitney two-tailed tests.
Extended Data Figure 8.
Extended Data Figure 8.. Hypocretin and hypocretin receptor-1 expression and production.
Relative Hcrt mRNA expression in a, tissues (n=3) and b, sorted bone marrow cells (n=4). c, Hcrt expression in the bone marrow and bone in Apoe−/− mice and in Apoe−/− mice subjected to sleep fragmentation for 16 weeks (n=5 Apoe−/−; n=4 Apoe−/−SF). d, Hypocretin-1 protein levels in cerebrospinal fluid (CSF), plasma and bone marrow (BM) fluid of WT and Hcrt−/− mice (n=4 per group). e, Hypocretin-1 protein levels in the plasma and BM fluid of Hcrt−/− mice 3 hours after intra-cisterna magna (i.c.m.) injection of HCRT-1 or PBS. (n=4 per group). f, Relative HcrtR1 mRNA expression in tissues (n=4 except aorta and spleen n=3). g, HcrtR2 expression in sorted BM cells (n=4). h, Granulocyte-macrophage colony forming units (CFU-GM) from bone marrow cells of WT mice exposed to hypocretin-1 (HCRT1) ex vivo in culture media (n=3 per group). i, Assessment of hypocretin receptor-1 (HCRTR1) protein in hypothalamus and sorted bone marrow neutrophils by western blot. Data presented as mean ± s.e.m.
Extended Data Figure 9.
Extended Data Figure 9.. Hypocretin, bone marrow neutrophils, and HcrtR1.
a, Flow cytometry gating strategy for bone marrow pre-neutrophils, immature neutrophils and mature neutrophils. b, HCRTR1 (GFP) in bone marrow and blood neutrophils from WTHcrtR1Gfp/Gfp mice. c, mRNA expression in cultured bone marrow pre-neutrophils exposed to LPS and/or HCRT-1 (for untreated n=3 except Mpo n=6; for HCRT-1 n=3 expect Csf1 n=4 and Mpo n=6; for LPS n=3 except Csf1 n=7 and Mpo n=6; for LPS+HCRT-1 n=3 except Csf1 n=11, CSf2 n=4, and Mpo n=6). d, Csf1 expression in sorted bone marrow cells of WT and Hcrt−/− mice (n=5 WT; n=6 Hcrt−/−). e, Analysis of mRNA transcript expression in bone marrow leukocytes of Apoe−/− mice after 16 weeks of SF. (for Apoe−/− n=5 except Il10, IL34, CXCL12, CSF3 n=4 and Csf1 n=9; for Apoe−/− SF n=6 except IL5, IL1β, IL6, IL34, CXCL12, CSF3 n=5, IL10 n=5, and Csf1 n=12). f, Blood neutrophils in WTHcrtR1Gfp/Gfp mice over 24 hours (n=3 per group). Data presented as mean ± s.e.m., *p<0.05, **p<0.01,***p<0.001, One-way ANOVA.
Extended Data Figure 10.
Extended Data Figure 10.. Hematopoietic CSF1 deletion protects against hematopoiesis and atherosclerosis in hypocretin deficient mice.
a, Schematic of chimeric models. Enumeration of Ly-6Chi monocytes and neutrophils in b, blood (n=4 WTbmWT; n=6 Hcrt−/−bmWT; n=3 WTbmCsf1−/−; n=5 Hcrt−/−bmCsf1−/−) and c, bone marrow (n=4 WTbmWT; n=6 Hcrt−/−bmWT; n=3 WTbmCsf1−/−; n=5 Hcrt−/−bmCsf1−/−). d, LSKs enumeration (n=4 WTbmWT; n=6 Hcrt−/−bmWT; n=3 WTbmCsf1−/−; n=5 Hcrt−/−bmCsf1−/−) and proliferation (n=4 WTbmWT; n=4 Hcrt−/−bmWT; n=3 WTbmCsf1−/−; n=5 Hcrt−/−bmCsf1−/−) in bone marrow. e, Enumeration of CMPs, GMPs and MDPs in chimeric mice (n=4 WTbmWT; n=6 Hcrt−/−bmWT; n=3 WTbmCsf1−/−; n=5 Hcrt−/−bmCsf1−/−). f, Bone marrow CSF1 levels (n=4 WTbmWT; n=8 Hcrt−/−bmWT; n=4 WTbmCsf1−/−; n=7 Hcrt−/−bmCsf1−/−). g, Schematic of chimeric models receiving Adv-PCSK9 and fed a high cholesterol diet for 12 weeks. h, Plasma cholesterol levels (n=7 WTbmWT; n=10 Hcrt−/−bmWT; n=5 WTbmCsf1−/−; n=6 Hcrt−/−bmCsf1−/−). i, Cross section images of aortic roots stained with oil-red-o and quantification of atherosclerosis in chimeric mice (n=7 WTbmWT; n=9 Hcrt−/−bmWT; n=5 WTbmCsf1−/−; n=6 Hcrt−/−bmCsf1−/−). Data presented as mean ± s.e.m., *p<0.05, **p<0.01,***p<0.001, One-way ANOVA.
Figure 1.
Figure 1.. Sleep fragmentation aggravates atherosclerosis, increases hematopoiesis and decreases hypothalamic hypocretin production.
Assessment of sleep fragmentation (SF) in Apoe−/− mice fed a high fat diet (HFD). a, Cross sections of aortic roots stained with oil-red-o and quantification of atherosclerotic lesion area after varying lengths of SF (n=5 8wk Apoe−/−; n=4 8wk Apoe−/−SF; n=8 12wk Apoe−/−; n=7 12wk Apoe−/−SF; n=15 16wk Apoe−/−; n=14 16wkApoe−/−SF). b, Measurement of lesion volume after 16 weeks of SF (n=4 Apoe−/−; n=5 Apoe−/−SF). c, Enumeration, by flow cytometry, of aortic neutrophils, macrophages and Ly-6Chi monocytes in the aorta of Apoe−/− mice and Apoe−/− mice having undergone SF for 16 weeks (n=10 per group). d, Quantification of circulating Ly-6Chi monocytes and neutrophils over 24 hours after 16 weeks of SF (ZT0=lights on, ZT12=lights off, n=4 per group) **p<0.01, ***p<0.001, Two-way ANOVA. e, Quantification of bone marrow LinSca1+cKit+ (LSK) cells and BrdU incorporation after 16 weeks of SF (for LSKs/leg n=10 per group; for proliferation n=8 Apoe−/− and n=9 Apoe−/−SF). f, Immunohistochemical staining for hypocretin in the hypothalamus after 16 weeks of SF. g, Enumeration of hypocretin+ cells per high power field (HPF) in the hypothalamus after 16 weeks of SF (n=4 Apoe−/−; n=5 Apoe−/−SF, of 2 independent experiments) **p<0.01, Two-way ANOVA. h, Transcript expression of hypocretin (Hcrt) in the hypothalamus after 16 weeks of SF (n=12 per group). i, Measurement of hypocretin-1 (HCRT-1) protein in plasma and bone marrow fluid after 16 weeks of SF (n=6 per group plasma ZT3; n=9 plasma Apoe−/− ZT14; n=8 plasma Apoe−/−SF ZT14; n=7 per group BM ZT14) ***p<0.001 One-way ANOVA. Data presented as mean ± s.e.m., *p<0.05, **p<0.01,***p<0.001, Mann-Whitney two-tailed tests unless otherwise indicated.
Figure 2.
Figure 2.. Hypocretin suppresses hematopoiesis and atherosclerosis.
Assessment of hematopoiesis in hypocretin-deficient (Hcrt−/−) mice. Enumeration of a, Ly-6Chi monocytes and b, neutrophils in the blood of Hcrt−/− and wild type (WT) mice over 24 hours (n=3 per group) **p<0.01, ***p<0.001, Two-way ANOVA. c, Enumeration of bone marrow LSK cells and BrdU incorporation in WT and Hcrt−/− (for LSKs/leg n=8 WT and n=10 Hcrt−/−; for proliferation n=4 per group). d, Schematic of chimeric models. e, Assessment of blood Ly-6Chi monocytes and neutrophils, bone marrow LSK cells and BrdU incorporation in chimeric mice (n=4 WTbmWT mice; n=3 Hcrt−/−bmHcrt−/− mice; n=4 WTbmHcrt−/− mice; n=5 Hcrt−/−bmWT mice) *p<0.05, **p<0.01, ***p<0.001 One-way ANOVA. f, Schematic of parabiosis models. g, Enumeration of LSKs and BrdU incorporation in the bone marrow of parabiosis mice (n=4 per group) *p<0.05, One-way ANOVA. h, Cross section images of aortic roots stained with oil-red-o and quantification of atherosclerotic lesion area in Apoe−/− and Hcrt−/−Apoe−/− mice fed a high fat diet for 16 weeks (n=7 Apoe−/−; n=8 Hcrt−/−Apoe−/−). i, Aortic myeloid cells in Apoe−/− and Hcrt−/−Apoe−/− mice (for Ly-6Chi monocytes n=10 per group; for neutrophils n=11 Apoe−/− and n=9 Hcrt−/−Apoe−/−; for macrophages n=11 Apoe−/− and n=10 Hcrt−/−Apoe−/−). Data presented as mean ± s.e.m., *p<0.05, **p<0.01,***p<0.001, Mann-Whitney two-tailed tests unless otherwise indicated.
Figure 3.
Figure 3.. Hypocretin controls pre-neutrophil CSF1 production in the bone marrow.
Hypocretin receptor-1 (Hcrtr1) mRNA in cells sorted from bone marrow (n=4 except neutrophils n=7). b, HcrtR1 mRNA expression in bone marrow and blood neutrophil populations (n=4). c, Flow cytometry plot of HCRTR1+ pre-neutrophils in the bone marrow of WT mice transplanted with HcrtR1Gfp/Gfp BM. d, Colony stimulating factor-1 (Csf1) expression in sorted bone marrow cells (for Ly-6Chi monocytes, B cells, and other leukocytes n=3; for neutrophils and CD45 cells n=5). e, Csf1 expression in sorted bone marrow neutrophil populations (n=4). f, CSF1 production by pre-neutrophils sorted from WT mice exposed to LPS and/or HCRT-1 (for untreated and HCRT-1 n=4 per group; for LPS and LPS+HCRT-1 n=6 per group) *p<0.05, ***p<0.001, One-way ANOVA. g, CSF1 production by pre-neutrophils sorted from WT and Hcrt−/− mice (n=4 per group). h, BM CSF1 concentration in Apoe−/− SF and Hcrt−/− mice (n=4 Apoe−/−; n=6 Apoe−/−SF; n=4 WT; n=7 Hcrt−/−). i, Enumeration of blood Ly-6Chi monocytes over 24 hours in WTbmHcrtR1Gfp/Gfp mice (n=3 per group) ***p<0.001, Two-way ANOVA. j, BM LSKs and LSK proliferation in WT mice transplanted with WT or HcrtR1Gfp/Gfp BM cells (for LSKs/leg n=5 per group; for proliferation n=4 WTbmWT and n=5 WTbmHcrtR1Gfp/Gfp). k, BM CSF1 concentration in WT mice transplanted with WT or HcrtR1Gfp/Gfp BM cells (n=4 WTbmWT; n=5 WTbmHcrtR1Gfp/Gfp ). l, Cross section images of aortic roots stained with oil-red-o and quantification of atherosclerosis in Ldlr−/− mice transplanted with WT or HcrtR1Gfp/Gfp BM cells and fed a high cholesterol diet for 12 weeks (n=8 Ldlr−/−bmWT; n=9 Ldlr−/−bmHcrtR1Gfp/Gfp ). Data presented as mean ± s.e.m., *p<0.05, **p<0.01,***p<0.001, Mann-Whitney two-tailed tests unless otherwise indicated.
Figure 4.
Figure 4.. Hematopoietic CSF1 deletion or hypocretin supplementation protects against SF-induced hematopoiesis and atherosclerosis.
a, Schematic of chimeric Ldlr−/− mice with WT or CSF1−/− hematopoietic cells subjected to SF. b, Enumeration of blood Ly-6Chi monocytes in chimeric mice (n=5 LDLr−/−bmWT; n=6 LDLr−/−bmWTSF; n=6 Ldlr−/−bmCsf1−/−; n=5 Ldlr−/−bmCsf1−/−SF ). c, Quantification of bone marrow LSKs and BrdU incorporation in chimeric mice (for LSKs/leg n=5 LDLr−/−bmWT; n=6 LDLr−/−bmWTSF; n=6 Ldlr−/−bmCsf1−/−; n=5 Ldlr−/−bmCsf1−/−SF; for proliferation n=4 LDLr−/−bmWT; n=6 LDLr−/−bmWTSF; n=6 Ldlr−/−bmCsf1−/−; n=5 Ldlr−/−bmCsf1−/−SF). d, BM CSF1 concentration in chimeric mice (n=4 LDLr−/−bmWT; n=4 LDLr−/−bmWTSF; n=5 Ldlr−/−bmCsf1−/−; n=4 Ldlr−/−bmCsf1−/−SF). e, Cross section images of aortic roots stained with oil-red-o and assessment of atherosclerosis in chimeric mice after 16 weeks of high cholesterol diet (n=5 LDLr−/−bmWT; n=6 LDLr−/−bmWTSF; n=6 Ldlr−/−bmCsf1−/−; n=6 Ldlr−/−bmCsf1−/−SF). f, Schematic of mice subjected to SF and receiving hypocretin-1 or saline via osmotic mini-pumps for 8 weeks. g, Enumeration of blood Ly-6Chi monocytes and neutrophils (n=5 Apoe−/−; n=5 Apoe−/−SF; n=7 Apoe−/−+HCRT-1; n=9 Apoe−/−SF+HCRT-1). h, LSKs and BrdU incorporation in the bone marrow of SF mice with HCRT-1 supplementation (n=5 Apoe−/−; n=4 Apoe−/−SF; n=7 Apoe−/−+HCRT-1; n=9 Apoe−/−SF+HCRT-1). i, BM CSF1 levels (n=4 Apoe−/−; n=3 Apoe−/−SF; n=3 Apoe−/−+HCRT-1; n=4 Apoe−/−SF+HCRT-1). j, Cross section images of aortic roots stained with oil-red-o and quantification of atherosclerotic lesion area (n=6 Apoe−/−; n=8 Apoe−/−SF; n=7 Apoe−/−+HCRT-1; n=9 Apoe−/−SF+HCRT-1). k, Model of sleep’s role in regulating hypocretin production, hematopoiesis and atherosclerosis. The illustration was modified from Servier Medical Art (http://smart.servier.com/), licensed under a Creative Common Attribution 3.0 Generic License. Data presented as mean ± s.e.m., *p<0.05, **p<0.01,***p<0.001, One-way ANOVA.

Comment in

References

    1. Hublin C, Partinen M, Koskenvuo M & Kaprio J Sleep and mortality: a population-based 22-year follow-up study. Sleep 30, 1245–1253 (2007). - PMC - PubMed
    1. Cappuccio FP, Cooper D, D’Elia L, Strazzullo P & Miller MA Sleep duration predicts cardiovascular outcomes: a systematic review and meta-analysis of prospective studies. Eur Heart J 32, 1484–1492 (2011). - PubMed
    1. Hafner M, Stepanek M, Taylor J, Troxel WM & van Stolk C Why Sleep Matters-The Economic Costs of Insufficient Sleep: A Cross-Country Comparative Analysis. Rand Health Q 6, 11 (2017). - PMC - PubMed
    1. Ford ES, Cunningham TJ & Croft JB Trends in Self-Reported Sleep Duration among US Adults from 1985 to 2012. Sleep 38, 829–832 (2015). - PMC - PubMed
    1. Cappuccio FP et al. Meta-analysis of short sleep duration and obesity in children and adults. Sleep 31, 619–626 (2008). - PMC - PubMed

Publication types

MeSH terms