. 2019 Feb;566(7744):398-402.
doi: 10.1038/s41586-019-0934-8. Epub 2019 Feb 13.

High frequency of shared clonotypes in human B cell receptor repertoires

Affiliations

High frequency of shared clonotypes in human B cell receptor repertoires

Cinque Soto et al. Nature. 2019 Feb.

Abstract

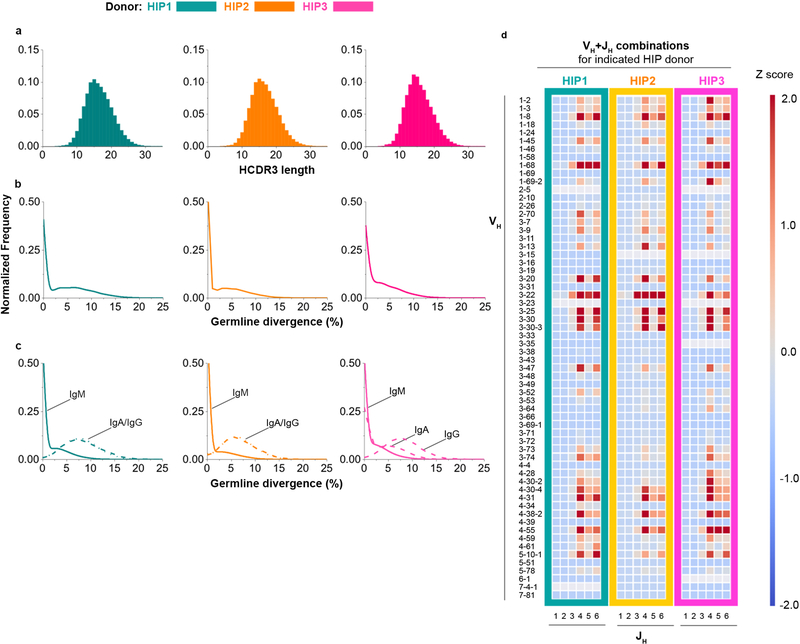
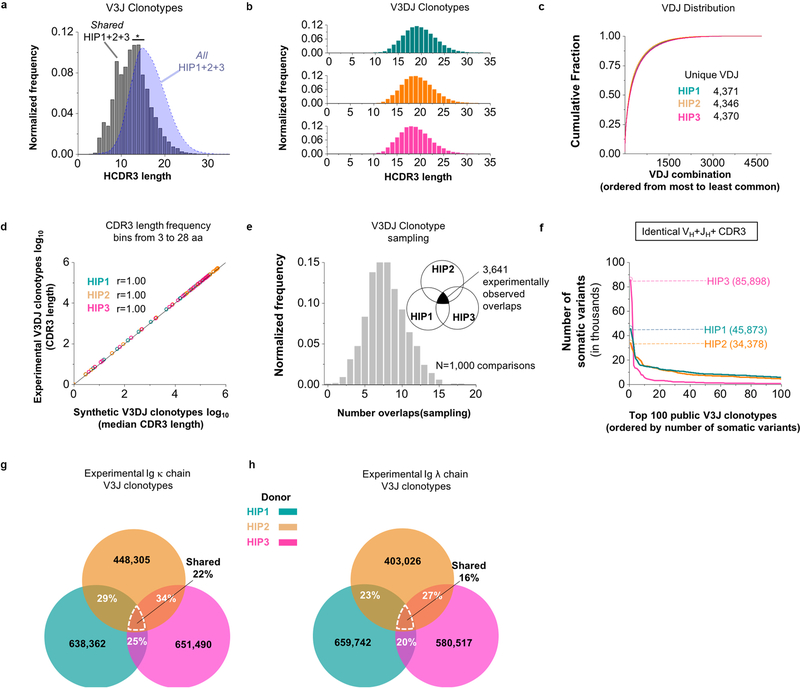
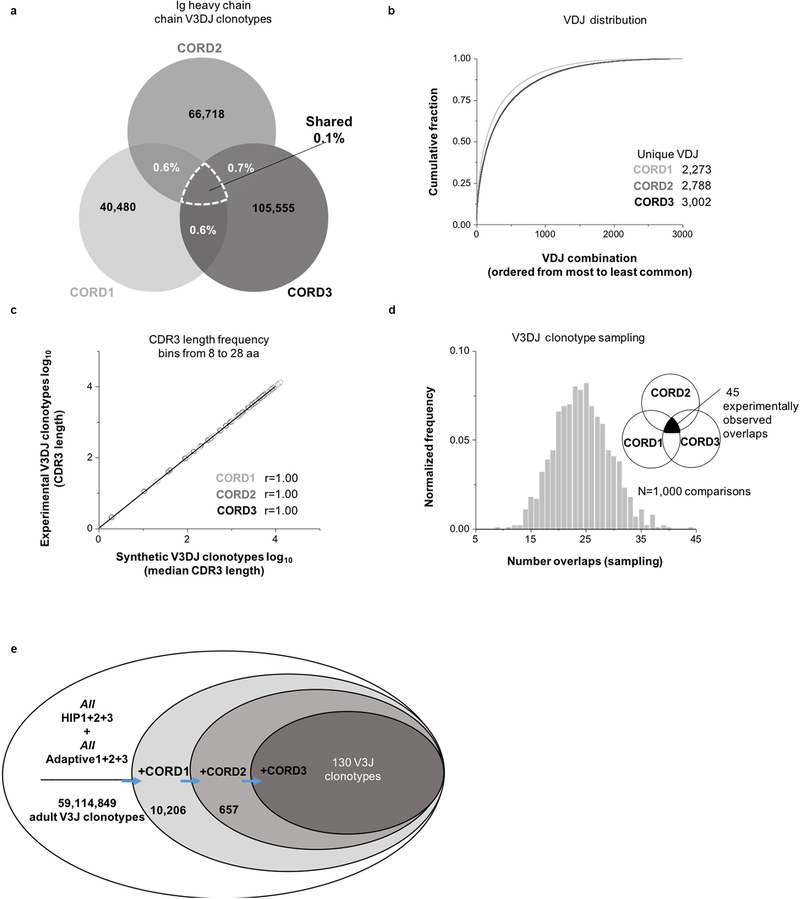
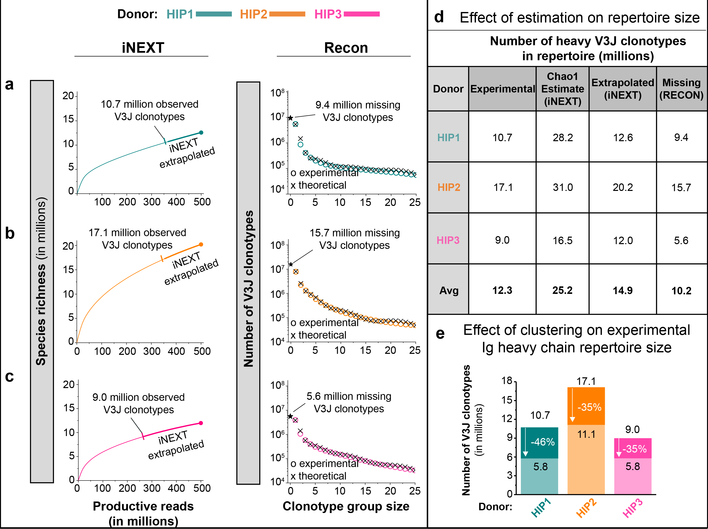
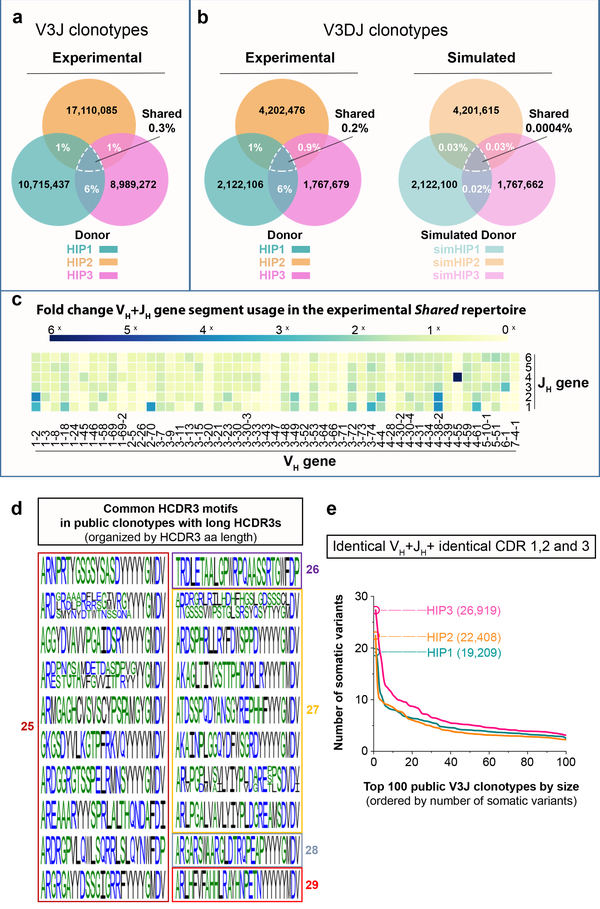
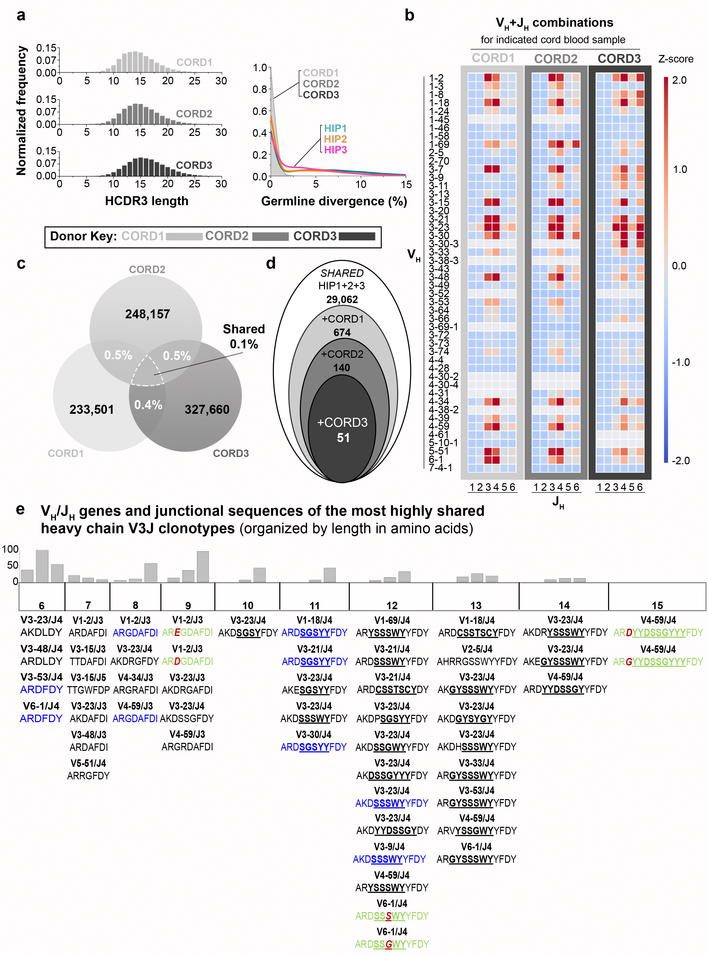
The human genome contains approximately 20 thousand protein-coding genes1, but the size of the collection of antigen receptors of the adaptive immune system that is generated by the recombination of gene segments with non-templated junctional additions (on B cells) is unknown-although it is certainly orders of magnitude larger. It has not been established whether individuals possess unique (or private) repertoires or substantial components of shared (or public) repertoires. Here we sequence recombined and expressed B cell receptor genes in several individuals to determine the size of their B cell receptor repertoires, and the extent to which these are shared between individuals. Our experiments revealed that the circulating repertoire of each individual contained between 9 and 17 million B cell clonotypes. The three individuals that we studied shared many clonotypes, including between 1 and 6% of B cell heavy-chain clonotypes shared between two subjects (0.3% of clonotypes shared by all three) and 20 to 34% of λ or κ light chains shared between two subjects (16 or 22% of λ or κ light chains, respectively, were shared by all three). Some of the B cell clonotypes had thousands of clones, or somatic variants, within the clonotype lineage. Although some of these shared lineages might be driven by exposure to common antigens, previous exposure to foreign antigens was not the only force that shaped the shared repertoires, as we also identified shared clonotypes in umbilical cord blood samples and all adult repertoires. The unexpectedly high prevalence of shared clonotypes in B cell repertoires, and identification of the sequences of these shared clonotypes, should enable better understanding of the role of B cell immune repertoires in health and disease.


Figures

Extended Data Figure 1.
Extended Data Figure 1.. Repertoire properties for Ig V3J clonotype data belonging to HIP1–3.
(a) Normalized frequency histogram of HCDR3 sequence lengths belonging to Ig heavy chain V3J clonotypes for HIP1 (left plot, n = 8,623,076 unique CDR3s with a median CDR3 length 16 aa), HIP2 (middle plot, n = 15,413,214 unique CDR3s with a median CDR3 length 16 aa) and HIP3 (right plot, n = 7,081,314 unique CDR3s with a median CDR3 length 15 aa). (b) Normalized frequency histogram of germline divergence values for HIP1 (left plot), HIP2 (middle plot) or HIP3 (right plot). Germline divergence was defined as 100 percent minus the percent nucleotide identity a read had with its closest matching germline variable (V) gene sequence. Median percent germline divergence values for HIP1, 2 or 3 were 3, 0 or 2 respectively. (c) Normalized frequency histogram of germline divergence values by isotype for subject HIP1 (left plot), HIP2 (middle plot) or HIP3 (right plot). The median germline divergence was 0 for all IgM data sets. All isotype data were obtained from the AbHelix sequencing method. (d) Heat map representation for unique VH+JH recombinations in subject HIP1, 2 or 3. The data from each set were transformed to obtain Z scores using the mean and standard deviation.
Extended Data Figure 2.
Extended Data Figure 2.. Extent of sharing between Ig clonotypes belonging to HIP1–3.
(a) Normalized frequency histogram of HCDR3 sequence lengths belonging to V3J clonotypes from All HIP1+2+3 (blue filled curve, n = 30,156,947 unique CDR3s with a median CDR3 length of 16 amino acids) and Shared HIP1+2+3 (grey bins, n = 22,934 unique CDR3s with a median CDR3 length of 13 aa). The medians were statistically different based on a two-tailed Mann-Whitney U test with a P < 2.2×10⁻¹⁶ (at an α = 0.05). (b) Normalized frequency histogram of CDR3 lengths belonging to all V3DJ clonotypes from HIP1 (n = 1,750,325 unique CDR3s with a median CDR3 length of 19 aa), HIP2 (n = 3,889,527 unique CDR3s with a median CDR3 length of 19 aa) and HIP3 (n = 1,437,339 unique CDR3s with a median CDR3 length of 19 aa). (c) Cumulative distribution of normalized VDJ triple frequencies used for simulation: HIP1 (n = 4,373 unique VDJ triples), HIP2 (n = 4,351 unique VDJ triples) and HIP3 (n = 4,372 unique VDJ triples). (d) Log-Log frequency plot between experimental and synthetic CDR3 lengths. The Pearson correlation coefficient r = 1.00 with a P < 2.2 × 10⁻¹⁶ (at an α = 0.05) (n = 26 CDR3 length bins for each set). (e) Normalized frequency histogram of V3DJ overlap counts between all three synthetic HIP distributions (n = 3,641 common clonotypes between sequenced repertoires). (f) V3J clonotypes with the largest numbers of somatic variants. Numbers in parenthesis denote counts for the number of unique somatic variants associated with a V3J clonotype for HIP1, HIP2 or HIP3. (g) Percentage overlaps for the Ig κ V3J clonotypes from the experimentally determined repertoires belonging to HIP1–3. (h) Percentage overlaps for Ig λ V3J clonotypes from the experimentally determined repertoires belonging to HIP1–3.
Extended Data Figure 3.
Extended Data Figure 3.. Shared Ig heavy chain clonotypes for three cord blood samples.
(a) V3DJ clonotype overlaps from three cord blood samples, CORD1 (n = 40,480 unique V3DJ clonotypes), CORD2 (n = 66,718 unique V3DJ clonotypes) and CORD3 (n = 105,555 unique V3DJ clonotypes) (b) Cumulative distribution of normalized VDJ triple frequencies for CORD1 (n = 2,273 unique VDJ triples), CORD2 (n = 2,788 unique VDJ triples) and CORD3 (n = 3,002 unique VDJ triples). (c) Log-Log frequency plot between experimental and synthetic CDR3 lengths. The Pearson correlation coefficient r = 1.000 with a P < 2.2 × 10⁻¹⁶ (at an α = 0.05) (n = 21 bins for each set). It should be noted that there were no V3DJ clonotypes with CDR3 lengths less than 8 amino acids in length. (d) Normalized frequency histogram of V3DJ overlap counts between all three synthetic CORD distributions (n = 45 common clonotypes between all three sequenced repertoires). (e) V3J clonotypes identified in the adult subjects HIP1, 2, and 3 (“All HIP1+2+3”) were combined with an independently derived set of Ig heavy chain V3J clonotypes for which sequences were publicly available (“All Adaptive1+2+3”). Starting from the combined set of 59,193,994 clonotypes from six adult Ig heavy chain repertoires, each of the three cord blood sets was scanned in a serial fashion, keeping only the common clonotypes. A total of 130 shared V3J clonotypes was identified.
Extended Data Figure 4.
Extended Data Figure 4.. Schematic diagram showing bioinformatic sequence processing.
The flowchart shows how a typical sequencing run using paired ends (PE) reads from Illumina was processed using bioinformatics pipeline. Detailed descriptions for each of the programs used in the pipeline can be found in the supplementary methods.
Extended Data Figure 5.
Extended Data Figure 5.. Schematic showing placement of primers.
Annotated example of a biological sequence obtained from the two-step barcoded library preparation protocol. The red and yellow regions show the placement of the first and second steps of PCR amplification. The cyan region shows the location of the RID tagged RT gene specific primer.
Figure 1.
Figure 1.. Estimates of V3J clonotype diversity from three healthy adult subjects, designated HIP1, 2, or 3.
Interpolation (thin curves) and extrapolation (thick curves) of species diversity values were obtained using the program iNEXT. The endpoint diversity estimates are represented by the symbols (|) for interpolation and (●) for extrapolation, respectively. The 95% confidence limits were all within ± 0.05% of the end-point estimates. The program Recon was used to estimate the number of unobserved or “missing” V3J clonotypes. The observed frequency of clonotype group sizes and their theoretical fits obtained using Recon are represented by the symbols (○) or (×), respectively. Only the first 25 clonotype group sizes are shown on the plot for clarity. (a) (Left panel) Experimental sequencing yielded about 10.7 million Ig heavy V3J clonotypes for HIP1. The species richness endpoint estimate was 10,715,954. Extrapolation gave a species richness estimate of 12,590,751. (Right panel) Recon estimates suggested a total of 9.4 million missing clonotypes. (b) (Left panel) Experimental sequencing yielded about 17.1 million Ig heavy V3J clonotypes for subject HIP2. The species richness endpoint estimate was 17,110,333. Extrapolation gave a species richness estimate of 20,210,426. (Right panel) Recon estimates suggested a total of 15.7 million missing clonotypes. (c) (Left panel) Experimental sequencing yielded about 9.0 million V3J clonotypes for HIP3. The endpoint species richness estimate was 8,989,812. Extrapolation gave a species richness estimate of 11,984,340. (Right panel) Recon estimates suggested a total of 5.6 million missing clonotypes. (d) A summary of estimates for repertoire size based on clonotype frequencies. Species richness values obtained from experimental sequencing were rounded to nearest hundred thousand. (e) Clustering of Ig heavy chain V3J clonotypes in the HCDR3s reduced the total number of unique clonotypes by 35 to 46%.
Figure 2.
Figure 2.. Shared clonotypes between three healthy adult subjects (HIP1, 2 and 3).
(a) Shared V3J clonotypes from sequenced Ig heavy chains. (b) (Left panel) Shared V3DJ clonotypes from sequenced Ig heavy chains with HCDR3 lengths from 3 to 28 amino acids. (Right panel) Shared V3DJ clonotypes from synthetic HIP repertoires with HCDR3 lengths from 3 to 28 amino acids. The percentage overlaps were based on the average of 1,000 comparisons from bootstrap testing involving synthetic HIP repertoires. The average and standard error of the mean (s.e.m.) for the percentage overlaps was 0.03% (5.0 × 10⁻⁵) between simHIP1 and simHIP2, 0.03% (4.9 × 10⁻⁵) between simHIP1 and simHIP3, and 0.02% (6.0 × 10⁻⁵) between simHIP2 and simHIP3. The average and s.e.m. for the percentage overlap between simHIP1 and simHIP2 and simHIP3 was 0.0004% (6.9 × 10⁻⁶). The V3DJ overlap count between all three sequenced repertoires (n = 3,641 common clonotypes) ranked highest in the 1,000 comparisons giving a P = 1.0 × 10⁻⁴ (see Extended Data Fig. 2e for normalized histogram of common clonotypes between synthetic sets). (c) Fold change in VH+JH usage between Shared HIP1+2+3 (n = 29,062 unique clonotypes) and all HIP subjects (designated: All HIP1+2+3, n = 36,064,712 unique clonotypes). (d) Common motifs in Shared V3J clonotypes with long CDR3s shown as a WebLogo. (e) Somatic variant count for V3J clonotypes from the Shared HIP1+2+3 collection whose somatic variants had identical CDR1 and CDR2 amino acid sequences plotted in order of decreasing frequency. Numbers in parenthesis denote V3J clonotypes having the largest number of somatic variant counts.
Figure 3.
Figure 3.. Occurrence of public V3J clonotypes that are shared in adult and cord blood repertoires.
(a) (Left panel) Normalized frequency histogram of HCDR3 sequence lengths from V3J clonotypes belonging to CORD1 (top plot, n = 229,478 unique CDR3 sequences with a median CDR3 length 14 aa), CORD2 (middle plot, n = 243,497 unique CDR3 sequences with a median CDR3 length 15 aa) or CORD3 (bottom plot, n = 322,882 CDR3 sequences with a median CDR3 length 16 aa). (Right panel) Normalized frequency histogram of germline divergence values for CORD1, 2 and 3 and adult subjects HIP1, 2, and 3. The shaded area corresponds to the CORD1–3 data set. Germline divergence was defined as 100 percent minus the percent nucleotide identity a read had with its closest matching germline variable (V) gene sequence. (b) Heat map representation for unique VH+JH recombinations in CORD1, 2 or 3. (c) Shared V3J clonotypes between CORD samples. (d) Schematic illustration showing shared V3J clonotypes common to all six subjects. Starting from the Shared HIP1+2+3 set, the three CORD sets were compared sequentially to determine the presence of 51 common clonotypes. (e) Shared V3J clonotypes between all six subjects. The VH and JH germline gene for each clonotype appears directly above the CDR3 amino acid sequence. Identical CDR3 sequences appearing within multiple clonotypes appear in blue. Clonotypes with the same CDR3 length and one amino acid difference appear in green text; the amino acid change is denoted in red. All underlined text denotes the location of the assigned DH germline gene. Histograms above each column provide frequencies for the number of matching clonotypes from All HIP1+2+3 that were 1, 2 or 3 mismatches (from left to right) from one of the shared clonotypes appearing in the column directly below.

References

    1. Ezkurdia I et al. Multiple evidence strands suggest that there may be as few as 19,000 human protein-coding genes. Hum Mol Genet 23, 5866–5878, (2014). - PMC - PubMed
    1. The Adaptive Immune Receptor Repertoire Community of the Antibody Society <https://www.antibodysociety.org/the-airr-community/>
    1. Zalocusky KA et al. The 10,000 Immunomes Project: Building a Resource for Human Immunology. Cell Rep 25, 513–522 e513, (2018). - PMC - PubMed
    1. Ye J, Ma N, Madden TL & Ostell JM IgBLAST: an immunoglobulin variable domain sequence analysis tool. Nucleic Acids Res 41, W34–40, (2013). - PMC - PubMed
    1. Hsieh TC, Ma KH & Chao A iNEXT: an R package for rarefaction and extrapolation of species diversity (Hill numbers). Methods Ecol Evol 7, 1451–1456, (2016).

Publication types

MeSH terms