. 2019 Mar;567(7746):118-122.
doi: 10.1038/s41586-019-0945-5. Epub 2019 Feb 13.

Squalene accumulation in cholesterol auxotrophic lymphomas prevents oxidative cell death

Affiliations

Squalene accumulation in cholesterol auxotrophic lymphomas prevents oxidative cell death

Javier Garcia-Bermudez et al. Nature. 2019 Mar.

Abstract

Cholesterol is essential for cells to grow and proliferate. Normal mammalian cells meet their need for cholesterol through its uptake or de novo synthesis1, but the extent to which cancer cells rely on each of these pathways remains poorly understood. Here, using a competitive proliferation assay on a pooled collection of DNA-barcoded cell lines, we identify a subset of cancer cells that is auxotrophic for cholesterol and thus highly dependent on its uptake. Through metabolic gene expression analysis, we pinpoint the loss of squalene monooxygenase expression as a cause of cholesterol auxotrophy, particularly in ALK+ anaplastic large cell lymphoma (ALCL) cell lines and primary tumours. Squalene monooxygenase catalyses the oxidation of squalene to 2,3-oxidosqualene in the cholesterol synthesis pathway and its loss results in accumulation of the upstream metabolite squalene, which is normally undetectable. In ALK+ ALCLs, squalene alters the cellular lipid profile and protects cancer cells from ferroptotic cell death, providing a growth advantage under conditions of oxidative stress and in tumour xenografts. Finally, a CRISPR-based genetic screen identified cholesterol uptake by the low-density lipoprotein receptor as essential for the growth of ALCL cells in culture and as patient-derived xenografts. This work reveals that the cholesterol auxotrophy of ALCLs is a targetable liability and, more broadly, that systematic approaches can be used to identify nutrient dependencies unique to individual cancer types.


Conflict of interest statement

Competing interests

The authors declare no competing interests.

Figures

Extended Data Figure 1.
Extended Data Figure 1.. Extracellular cholesterol dependence of cancer cell lines
a. Representative bright-field micrographs of U-937 cells cultured with the indicated concentrations of cholesterol and LDL b. Relative fold change in cell number of indicated cell lines cultured for 5 days with LPDS in the presence or absence of free cholesterol relative to LDL replete serum. c. Relative fold change in cell number of indicated cell lines grown for 5 days under LPDS with or without free cholesterol (1, 5, 10 ug/ml) relative to LDL replete serum. d. Fold change in cell viability of cholesterol auxotrophic cancer cell lines grown for 5 days with LPDS in the presence or absence of cholesterol or oleic acid (OA), relative to LPDS supplemented with free cholesterol. e. Reported alterations in copy number or driver mutations in oncogenic EGFR/Ras and PI3K pathways of cancer cell lines used in the DNA barcode-based competition assay. f. Heatmap showing mRNA expression levels of cholesterol metabolism genes in LDL-dependent and -independent cancer cell lines. Color bar indicates scale (log2 transformed). g. SQLE and HSD17B7 mRNA levels of indicated cell lines relative to cholesterol prototroph cell line NCI-H524. mRNA levels were measured using a real time PCR assay. RPL0 is used as a control. h. Immunoblotting of SQLE in SNU-1 cell lines transduced with a control vector or an SQLE cDNA. Actin is included as a loading control. i. Schematic depicting squalene synthesis from acetate. In b, c, d and g, bars represent mean ± SD. For b, c and d, n = 3 biologically independent samples. For g, n = 2 biologically independent samples. Statistical test used was two-tailed unpaired t-test.
Extended Data Figure 2.
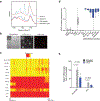
Extended Data Figure 2.. Promoter hypermethylation of the SQLE gene and accumulation of squalene in lipid droplets (LDs) of ALK+ ALCLs
a. Raman spectra of squalene (blue dashed), cholesterol (red dashed), LDs in Karpas299 parental cell (blue solid), and LDs in Karpas299 cell expressing SQLE cDNA (red solid). LDs were identified in bright field and targeted in the confocal Raman microspectrometer. Arrows indicate squalene-specific Raman peak. b. Representative bright field image, SRS image obtained at cell lipid background (1372cm−1) and fluorescence of Nile Red staining (for lipid droplets) in Karpas299 cells. c. Heat map showing the DNA methylation ratio for the indicated genomic region containing SQLE promoter for indicated cancer cell lines. Chromosomal position range and strand is indicated. Color bar indicates scale. d. SQLE promoter methylation ratio of control (grey) and SQLE deficient (blue) cancer cell lines. The boxes represent the median and the first and third quartiles, and the whiskers represent the minimum and maximum data points still within 1.5 of the interquartile range (n = 67 independent genomic positions per sample). e. Fold change in SQLE mRNA expression levels of indicated cell lines after treatment with decitabine (500 nM for 4 days) or 5-azacytidine (5-Aza, 1 uM for 6 days), relative to untreated cells (mean ± SD, n = 3 biologically independent samples).
Extended Data Figure 3.
Extended Data Figure 3.. Lack of SQLE expression in primary ALK+ ALCLs
a. List of most up and downregulated genes from differential expression analysis of primary ALK+ primary samples compared to ALK- samples. The student t-test statistic of each gene is calculated and used as a ranking metric (n = 17 biologically independent ALK- samples, 5 biologically independent ALK+ samples). b. Fold change in SQLE mRNA expression levels of primary ALK+ ALCLs relative to primary ALK- ALCLs, using ACTIN as a control. The boxes represent the median and the first and third quartiles, and the whiskers represent the minimum and maximum of all data points. Statistics: two-tailed unpaired t-test. c. Immunoblotting of SQLE and ALK in indicated patient derived xenograft and cell line models. Actin was used as the loading control. PTCL: Peripheral T-cell Lymphoma. d. Immunohistochemical staining of SQLE in ALK+ and ALK- ALCL primary tumor samples. e. Immunohistochemical staining of SQLE in Karpas299 xenograft tumors transduced with a control or SQLE cDNA. Representative images are shown. f. Immunoblotting of SQLE of indicated cell lines (top). Relative fold change in cell viability of the indicated ALK+ (Karpas299) and ALK- cell lines (TLBR-1 and ALK- PDX cell line) grown for 5 days under LPDS with or without free cholesterol relative to LDL replete serum (bottom) (mean ± SD, n = 3 biologically independent samples). g. Immunoblotting of STAT3, phospho-STAT3 and SQLE in indicated cell lines after 72 hrs treatment with crizotinib (200 nM). Actin was used as a loading control. h. Immunoblotting of STAT3 and phospho-STAT3 3 days after transduction of Ba/F3 with a dead kinase version of the NPM-ALK fusion (NPM-ALK DK) or with oncogenic NPM-ALK cDNA. i. SQLE mRNA levels of Ba/F3 and ALK- ALCL cell lines 2 or 7 days after transduction with NPM-ALK DK or NPM-ALK, relative to levels in NPM-ALK DK. mRNA levels were quantified with a real time PCR assay using ACTINB as a control (mean ± SD, n = 3–4 biologically independent samples). In b, the boxes represent the median, and the first and third quartiles, and the whiskers represent the minimum and maximum of all data points. In f and h, bars represent mean ± SD. For f and h, n = 3 biologically independent samples. Statistical test used was two-tailed unpaired t-test.
Extended Data Figure 4.
Extended Data Figure 4.. LDLR is an essential gene for the growth of ALK+ ALCLs
a. Squalene and lanosterol abundance of Karpas299 and DEL cell lines in the absence or presence of SQLE cDNA or after incubation for 24 hrs with an SQLE inhibitor (SQLEi, 1 uM). b. Gene essentiality scores for control or SQLE-expressing DEL cell line. Pearson correlation coefficients are indicated. Red dot denotes LDLR. c. Gene essentiality scores for cholesterol-auxotroph Karpas299 or cholesterol-prototroph HEL cell lines. Pearson correlation coefficients are indicated. Red dot denotes LDLR. d. LDLR guide scores of the indicated cell lines in the presence or absence of SQLE inhibitor. e. Immunoblots for LDLR and SQLE in control and SQLE cDNA expressing Karpas299 cells infected with sgAAVS1 or sgLDLR1 virus in the presence or absence of Shield-1 (250 nM) (left). Relative fold change in cell viability of indicated cancer cell lines grown in the absence and presence of Shield-1 for 5 days (right). f. Immunoblotting of LDLR in ALK+ ALCL lines transduced with an inducible sgLDLR vector in the presence or absence of Shield-1 (250 nM). Actin is used as a loading control. g. Relative fold change in cell viability of control or SQLE-expressing DEL cell lines transduced with sgAAVS1 or sgLDLR after 5 days of growth. h. Gene essentiality scores for untreated or cholesterol-supplemented Karpas299 cell line. Red dot denotes LDLR. i. LDLR guide scores in Karpas299 cell lines expressing a control vector or SQLE cDNA in the presence or absence of cholesterol supplementation. j. Coomassie blue staining of control IgG and LDLR monoclonal antibodies used in proliferation assays. k. Relative fold change in cell viability of indicated cancer cell lines grown for 5 days in the presence of the indicated amounts of IgG or a monoclonal antibody against LDLR. l. Relative fold change in cell viability of DEL cell lines transduced with a control vector or an SQLE cDNA grown for 5 days in the presence of the indicated amounts of IgG or an anti-LDLR monoclonal antibody compared to cells grown in the absence of both. In a, d, e, g, i, k and l bars represent mean ± SD. For a, e, g, i, and k, n = 3 biologically independent samples. For d and i, n = 5 independent LDLR targeting sgRNAs. Statistical test used was two-tailed unpaired t-test.
Extended Data Figure 5.
Extended Data Figure 5.. Upregulation of the LDL-cholesterol uptake pathway in ALK+ ALCLs
a. Dil-LDL uptake in the indicated cell lines. Results were normalized to protein levels (mean ± SD, n = 2 biologically independent samples). b. mRNA expression levels of LDLR (log) in cell lines from CCLE database compared to that of ALK+ ALCL lines (mean ± SD, n = 1010 independent cell lines for CCLE collection, 5 independent cell lines for ALCL). c. Expression levels of Niemann-Pick C1 protein (NPC1) mRNA (log) in cell lines from CCLE database compared to that of ALK+ ALCL lines (mean ± SD, n = 1010 independent cell lines for CCLE collection, 5 independent cell lines for ALCL). d. Immunoblot of LDLR in the indicated primary patient derived xenografts (top). Immunoblotting of NPC1 in control and ALK+ ALCL cell lines (bottom). Actin is included as a loading control. PTCL: Peripheral T-cell Lymphoma. e. Immunoblotting of SREBP-2 (non-cleaved and cleaved forms) in cytoplasmic and nuclear fractions of indicated cell lines expressing a vector or an SQLE cDNA. The cells were incubated for 24 hours in media containing either FBS (−) or LPDS (+). GAPDH and Histone H3 were used as cytoplasmic and nuclear loading controls respectively.
Extended Data Figure 6.
Extended Data Figure 6.. Squalene accumulation leads to resistance of SQLE-null cells to ferroptosis inducers
a. Immunoblots of FDFT1 and SQLE in the indicated Karpas299 cell lines. Actin was used as the loading control. b. Stimulated Raman scattering (SRS) imaging of squalene for indicated Karpas299 cells. Grey image shows cellular background (1372cm−1), squalene image (pseudo colored yellow hot, 1386cm−1) (left). SRS spectra integrating intensity from lipid droplet with Raman peak of squalene (1386cm−1) (right) (mean ± SD, n = 3 biologically independent samples). Error bar represent standard deviation from multiple lipid droplets in at least three cells. c. sgRNA competition assay using a pool of five control (sgControl) and five FDFT1-targeting (sgFDFT1) sgRNAs in indicated patient derived xenografts. Transduced cells were injected subcutaneously to NOD/SCID gamma mice to generate tumors. Subsequent to 4 weeks of growth, genomic DNA was harvested to measure sgRNA abundance by deep sequencing. Average guide scores of tumors were calculated and graphed. d. Relative fold change in cell viability of indicated Karpas299 lines treated with or without ML162 (20 nM, top) or RSL3 (30 nM, bottom) in the presence or absence of an SQLE inhibitor (1 uM) for 5 days. e. Fold change in cell viability relative to untreated cells of indicated Karpas299 lines treated with or without ML162 (120 nM) for 2 days (top). Representative bright-field micrographs of indicated Karpas299 cells after 2 days of indicated treatments (bottom). f. Immunoblotting of FDFT1 in the indicated DEL and SUP-M2 cell lines. Actin is used as a loading control (left). Relative fold change in cell viability of control, FDFT1-null and rescued DEL and SUP-M2 cell lines in the presence and absence of ML162 (20 nM) after 5 days, g. Immunoblotting of FDFT1 in the indicated HEC1B and SNU-1 cell lines. Actin is used as a loading control (top). Squalene abundance of the indicated cell lines (middle). Relative fold change in cell viability of control and FDFT1-null HEC1B and SNU-1 cell lines in the presence and absence of ML162 (200 nM for HEC1B lines, 1 uM for SNU-1 cell lines) and grown for 5 days. In c, d, e, f and g bars represent mean ± SD. For c, n = 5 independent sgRNAs targeting a control region or LDLR gene. For d, e, f, and g, n = 3 biologically independent samples. Statistical test used was two-tailed unpaired t-test.
Extended Data Figure 7.
Extended Data Figure 7.. Blocking squalene accumulastion sensitizes ALCLs to a GPX4 inhibitor (ML162) and erastin
a. Mevalonate pathway in mammalian cells and fates of the side reactions. Reactions catalyzed by HMGCR, COQ2, FDFT1 and SQLE, and chemical inhibitors of these enzymes, are indicated. b. Relative abundance of squalene and coenzyme Q10 in Karpas299 treated for 24 hrs with atorvastatin (1 uM), 4-nitrobenzoate (4-NB, 1 mM) or zaragozic acid (ZA, 20 uM) to untreated. c. Relative fold change in cell viability of Karpas299 cells treated with erastin (1 uM), atorvastatin (1 uM), 4-nitrobenzoate (4-NB, 1 mM), zaragozic acid (ZA, 20 uM) or a combination of two of them after 5 days to untreated. d. Relative fold change in cell viability compared to untreated cells of Karpas299 cells treated with ML162 (25 nM), atorvastatin (1 uM), 4-nitrobenzoate (4-NB, 1 mM), zaragozic acid (ZA, 20 uM) or a combination of two of them after 5 days. In b, c and d bars represent mean ± SD. For b, c and d, n = 3 biologically independent samples.
Extended Data Figure 8.
Extended Data Figure 8.. Loss of SQLE decreases sensitivity of cancer cell lines to ferroptosis inducers
a. Immunoblotting of SQLE in the indicated cell lines transduced with a vector or sgSQLE. Actin is used as a loading control. b. Squalene abundance in the indicated cell lines. c. Relative fold change in cell viability of control and sgSQLE-expressing cell lines in the presence and absence of ML162 (500 nM for Jurkat lines, 200 nM for RPMI 8226 and SU-DHL-8 cell lines) grown for 5 days. d. Relative fold change in cell viability of Karpas299 parental cells supplemented with the indicated concentrations of exogenous squalene to untreated cells. e. Relative fold change in cell viability of Karpas299 parental or FDFT1 null cells expressing a vector, SQLE cDNA or FDFT1 cDNA treated with or without ML162, squalene or both, to untreated cells. In b, c, d and e bars represent mean ± SD. For b, c, d and e, n = 3 biologically independent samples. Statistical test used was two-tailed unpaired t-test.
Extended Data Figure 9.
Extended Data Figure 9.. Inhibition of PUFA synthesis prevents ferroptotic cell death in ALCLs
a. Immunoblotting of ACSL4 in the indicated Karpas299 cells. Actin is used as a loading control (top). Relative fold change in cell viability of indicated Karpas299 cell lines in the presence or absence of ML162 (20 nM) and Fer-1 (1 uM) for 5 days (bottom) (mean ± SD, n = 3 biologically independent samples). Statistics: two-tailed unpaired t-test. b. Correlation of mRNA levels of ACSL4 with SQLE (left) and ALK (right) in primary ALCLs dataset (n = 22 biologically independent samples). c. Correlation of mRNA levels of ACSL4 with SQLE in CCLE dataset (n = 935 independent cell lines). d. Lipid peroxidation assessed by flow cytometry measuring C11-BODIPY fluorescence of indicated Karpas299 cell lines after an 18 hr treatment with ML162 (200 nM). Representative data from one of three experiments is shown. e. Lipid peroxidation assessed by flow cytometry measuring C11-BODIPY fluorescence of indicated Karpas299 cell lines after an 18 hr treatment in the presence and absence of ML162 (200 nM) and Fer-1 (1 uM).
Extended Data Figure 10.
Extended Data Figure 10.. Squalene accumulation rewires membrane phospholipid composition
a. Unbiased lipidomic analysis of Karpas299 FDFT1-null cell line relative to its rescued isogenic counterpart expressing FDFT1 cDNA. Fold change (log2) in metabolite abundance was graphed and membrane phospholipids containing saturated and polyunsaturated fatty acids are indicated. b. Heat map showing fold changes (log2) in indicated phosphatidylcholines (PCs) and phosphatidylethanolamines (PEs) of Karpas299 cells cultured for 24 hours in the absence or presence of ZA (zaragozic acid, 20 uM) and ML162 (200 nM) relative to untreated cells. Triplicates of each condition are shown. Color bar indicates log2 change in abundance. c. Heat map showing fold changes (log2) in indicated phosphatidylethanolamines (PEs) of indicated Karpas299 cell lines cultured for 24 hours with Fer-1 (1 uM) and ML162 (200 nM). Triplicates of each condition are shown. Color bar indicates log2 change in abundance. d. Relative fold change in cell viability of HEL, KMS-26 and Jurkat cell lines expressing vector or an sgRNA targeting FDFT1 in the presence or absence of ML162 (20 nM) for 5 days. e. Immunoblotting of GPX4 in indicated Karpas299 cell lines expressing a vector, SQLE cDNA, FDFT1 cDNA or an sgRNA targeting FDFT1. Actin is used as a loading control. f. Coenzyme Q10 abundance of indicated Karpas299 cell lines relative to parental cells expressing a control vector. In d and f bars represent mean ± SD. For d and f, n = 3 biologically independent samples. Statistical test used was two-tailed unpaired t-test.
Figure 1.
Figure 1.. Identification of cholesterol auxotrophic cancer cell lines using a barcode-based competition assay
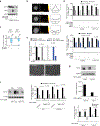
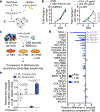
a. Cholesterol metabolism in mammalian cells. b. Fold change in cell number of Jurkat and U-937 cells cultured with the indicated concentrations of cholesterol, LDL, and oleic acid. c. Experimental design outline of cell competition assay. 28 cancer cell lines were barcoded with individual DNA barcodes and cultured for 2 weeks in media supplemented with FBS, LPDS, or LPDS/LDL (25ug/ml). FBS, Fetal Bovine Serum; LPDS, lipoprotein depleted serum; LDL, low density lipoprotein. d. Relative difference in barcode abundance of indicated cell lines in the competition assay grown under LPDS-supplemented media with (black) and without (blue) LDL, relative to FBS. e. Relative fold change in cell number of LDL independent (gray) and dependent (blue) cell lines in the presence or absence of cholesterol. In b and d, bars represent mean ± SD. In e, the boxes represent the median, and the first and third quartiles, and the whiskers represent the minimum and maximum of all data points. For b, n = 3 biologically independent samples. For d, n = 3 independent barcodes per cell line. For e, n = 5–6 biologically independent cell lines. Statistical test used was two-tailed unpaired t-test.
Figure 2.
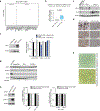
Figure 2.. ALK+ ALCLs are auxotrophic for cholesterol due to lack of SQLE expression
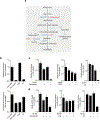
a. Immunoblotting for SQLE in LDL-dependent and independent cancer cell lines. Actin was used as a loading control. b. Relative fold change in cell viability of control and SQLE or HSD217B7 expressing SNU-1 cancer cells grown for 5 days under LPDS in the absence or presence of LDL or cholesterol. c. Mass isotopomer analysis of squalene in indicated cancer cell lines in the presence or absence of LDL after a 24 hour incubation with [U-13C]-Acetate. d. Expression levels of SQLE mRNA in 1037 cell lines from CCLE database. Cell lines with undetectable SQLE mRNA levels and their tissue origins are indicated. e. Immunoblotting for SQLE in ALK+ ALCL and control cancer cell lines. Actin was used as the loading control. f. Relative fold change in cell viability of indicated cancer cell lines grown for 5 days with LPDS in the absence and presence of LDL or cholesterol. g. Squalene abundance in control and SQLE deficient cancer cell lines. h. Raman spectra of squalene and cholesterol for the indicated cell lines. SRS images were obtained at squalene channel (1386cm−1) and at lipid channel (1372cm−1) in the same cell. i. Genes ranked by differential expression analysis of primary ALK+ ALCL primary samples compared to ALK- samples (left). Student t-test statistic of each gene was ranked as a function of its t-test rank. ALK- and ALK+ normalized expression (fpkm) of SQLE and ALK are indicated (right). In b, c, f and g, bars represent mean ± SD. In i, the boxes represent the median, and the first and third quartiles, and the whiskers represent the minimum and maximum of all data points. For b, c, f and g, n = 3 biologically independent samples. For i, n = 17 biologically independent ALK- samples, 5 biologically independent ALK+ samples. Statistical test used was two-tailed unpaired t-test.
Figure 3.
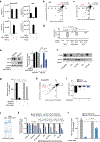
Figure 3.. In ALK+ ALCLs LDLR is upregulated and is a potential therapeutic target
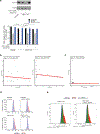
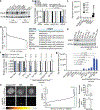
a. Schematic for CRISPR-Cas9 based negative selection screening. b. Comparison of gene essentiality between indicated cancer cell lines. Pearson correlation coefficients are indicated. Red dot denotes LDLR. c. Relative fold change in cell viability of indicated cancer cell lines infected with sgAAVS1 or sgLDLR and grown for 5 days. d. Immunoblot of LDLR in the indicated cancer cell lines. Actin was used as the loading control. e. Representative images (top) and weights (bottom) of subcutaneous tumour xenografts derived from indicated cancer lines expressing sgRNAs targeting AAVS or LDLR after 4 weeks of growth. f. Mini sgRNA competition assay using a pool of control (sgControl) and LDLR-targeting (sgLDLR) sgRNAs in indicated cancer cell lines and patient derived xenografts. Average guide scores of tumors and cell lines were calculated and graphed. (* p < 0.05). PDX: Patient derived xenograft. In c and f, bars represent mean ± SD. In e, the boxes represent the median, and the first and third quartiles, and the whiskers represent the minimum and maximum of all data points. For c, n = 3 biologically independent samples. For e, n = 6–7 biologically independent samples. For f, n = 5 independent sgRNAs targeting a control region and 4 sgRNAs targeting LDLR gene. Statistical test used was two-tailed unpaired t-test.
Figure 4.
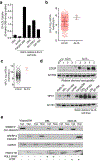
Figure 4.. Squalene accumulation rewires membrane lipid composition and protects ALCLs from ferroptosis
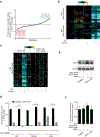
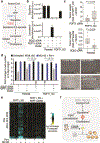
a. Metabolic reactions catalyzed by FDFT1 and SQLE in the cholesterol synthesis pathway. b. Squalene and lanosterol abundance in indicated Karpas299 cell lines. c. Relative fold change in tumor weight of indicated Karpas299 derived xenografts. d. Relative fold change in cell viability of indicated Karpas299 cells in the absence and presence of ML162 (20 nM) and Fer-1 (1 uM) for 5 days (left). Representative bright-field micrographs of indicated Karpas299 cells after treatment (right). e. Heat map showing fold changes (log2) in PUFA containing phosphatidylcholines (PCs) of indicated Karpas299 cell lines after incubation with Fer-1 (1 uM) and ML162 (200 nM) for 24 hours. f. Model depicting how loss of SQLE expression results in cholesterol auxotrophy and the accumulation of squalene in ALCLs. Excess squalene may in turn protect ALCLs from lipid peroxidation damage. In b and d, bars represent mean ± SD. In c, the boxes represent the median, and the first and third quartiles, and the whiskers represent the minimum and maximum of all data points. For b and d, n = 3 biologically independent samples. For c, n = 10–15 biologically independent samples. Statistical test used was two-tailed unpaired t-test.

References

    1. Goldstein JL & Brown MS Regulation of the mevalonate pathway. Nature 343, 425–430, doi:10.1038/343425a0 (1990). - DOI - PubMed
    1. Delage B et al. Arginine deprivation and argininosuccinate synthetase expression in the treatment of cancer. Int J Cancer 126, 2762–2772, doi:10.1002/ijc.25202 (2010). - DOI - PubMed
    1. Kidd JG Regression of transplanted lymphomas induced in vivo by means of normal guinea pig serum. II. Studies on the nature of the active serum constituent: histological mechanism of the regression: tests for effects of guinea pig serum on lymphoma cells in vitro: discussion. J Exp Med 98, 583–606 (1953). - PMC - PubMed
    1. Letouze E et al. SDH mutations establish a hypermethylator phenotype in paraganglioma. Cancer Cell 23, 739–752, doi:10.1016/j.ccr.2013.04.018 (2013). - DOI - PubMed
    1. Lu C & Thompson CB Metabolic regulation of epigenetics. Cell Metab 16, 9–17, doi:10.1016/j.cmet.2012.06.001 (2012). - DOI - PMC - PubMed

Publication types

MeSH terms