. 2019 Jan 29:10:6.
doi: 10.3389/fimmu.2019.00006. eCollection 2019.

LAYN Is a Prognostic Biomarker and Correlated With Immune Infiltrates in Gastric and Colon Cancers

Affiliations

LAYN Is a Prognostic Biomarker and Correlated With Immune Infiltrates in Gastric and Colon Cancers

Jing-Hua Pan et al. Front Immunol. .

Abstract

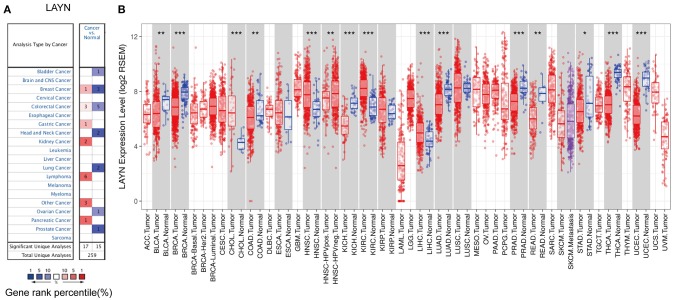
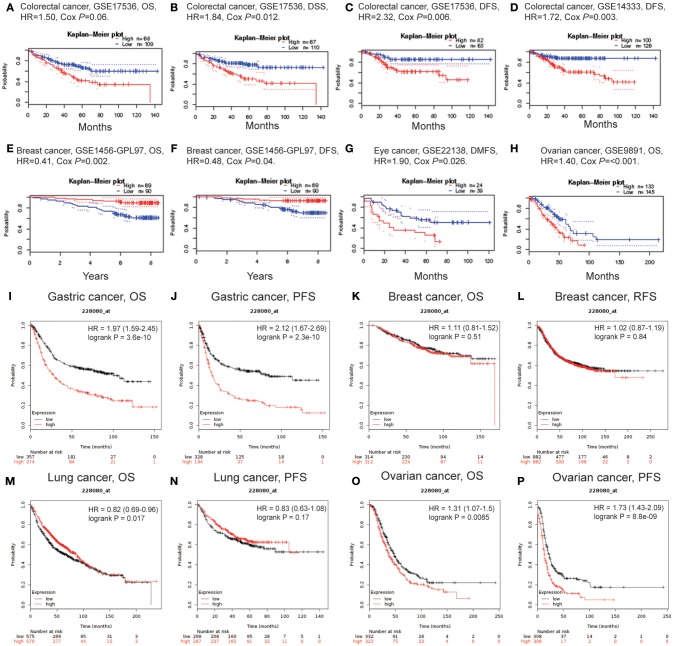
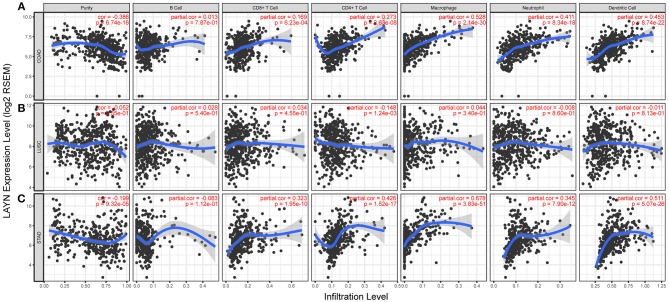
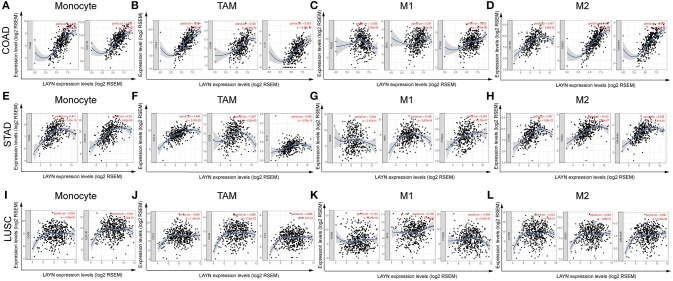
Background: Layilin (LAYN) is a critical gene that regulates T cell function. However, the correlations of LAYN to prognosis and tumor-infiltrating lymphocytes in different cancers remain unclear. Methods: LAYN expression was analyzed via the Oncomine database and Tumor Immune Estimation Resource (TIMER) site. We evaluated the influence of LAYN on clinical prognosis using Kaplan-Meier plotter, the PrognoScan database and Gene Expression Profiling Interactive Analysis (GEPIA). The correlations between LAYN and cancer immune infiltrates was investigated via TIMER. In addition, correlations between LAYN expression and gene marker sets of immune infiltrates were analyzed by TIMER and GEPIA. Results: A cohort (GSE17536) of colorectal cancer patients showed that high LAYN expression was associated with poorer overall survival (OS), disease-specific survival (DSS), and disease-free survival (DFS). In addition, high LAYN expression was significantly correlated with poor OS and progression-free survival (PFS) in gastric cancers (OS HR = 1.97, P = 3.6e-10; PFS HR = 2.12, P = 2.3e-10). Moreover, LAYN significantly impacts the prognosis of diverse cancers via The Cancer Genome Atlas (TCGA). Specifically, high LAYN expression was correlated with worse OS and PFS in stage 2 to 4 but not stage 1 and stage N0 gastric cancer patients (P = 0.28, 0.34; P = 0.073, 0.092). LAYN expression was positively correlated with infiltrating levels of CD4+ T and CD8+ T cells, macrophages, neutrophils, and dendritic cells (DCs) in colon adenocarcinoma (COAD) and stomach adenocarcinoma (STAD). LAYN expression showed strong correlations with diverse immune marker sets in COAD and STAD. Conclusions: These findings suggest that LAYN is correlated with prognosis and immune infiltrating levels of, including those of CD8+ T cells, CD4+ T cells, macrophages, neutrophils, and DCs in multiple cancers, especially in colon and gastric cancer patients. In addition, LAYN expression potentially contributes to regulation of tumor-associated macrophages (TAMs), DCs, T cell exhaustion and Tregs in colon and gastric cancer. These findings suggest that LAYN can be used as a prognostic biomarker for determining prognosis and immune infiltration in gastric and colon cancers.

Keywords: LAYN; colon cancer; gastric cancer; lymphocytes; prognosis; tumor-infiltrating.


Figures

Figure 1
Figure 1
LAYN expression levels in different types of human cancers. (A) Increased or decreased LAYN in data sets of different cancers compared with normal tissues in the Oncomine database. (B) Human LAYN expression levels in different tumor types from TCGA database were determined by TIMER (*P < 0.05, **P < 0.01, ***P < 0.001).
Figure 2
Figure 2
Kaplan-Meier survival curves comparing the high and low expression of LAYN in different types of cancer in the PrognoScan (A–H) and Kaplan-Meier plotter databases (I–P). (A–D) Survival curves of OS, DSS, and DFS in two colorectal cancer cohorts [GSE17536 (n = 177) and GSE14333 (n = 226)]. (E,F) Survival curves of OS and DFS in the breast cancer cohort (GSE1456-GPL97, n = 159). (G,H) High LAYN expression was correlated with poor DMFS in the eye cancer cohort (GSE22138, n = 63) and poor OS in the ovarian cancer cohort (GSE9891, n = 278). (I,J) OS and DFS survival curves of gastric cancer (n = 631, n = 522). (K,L) OS and RFS survival curves of breast cancer (n = 626, n = 1,764). (M,N) OS and PFS survival curves of lung cancer (n = 1,145, n = 596). (O,P) OS and PFS survival curves of ovarian cancer (n = 655, n = 614). OS, overall survival; DFS, disease-free survival; RFS, relapse-free survival; DSS, disease-specific survival. DMFS, distant metastasis-free survival.
Figure 3
Figure 3
Correlation of LAYN expression with immune infiltration level in COAD (colon adenocarcinoma), LUSC (lung squamous cell carcinoma), and STAD (stomach adenocarcinoma). (A) LAYN expression is significantly negatively related to tumor purity and has significant positive correlations with infiltrating levels of CD8+ T cells, CD4+ T cells, macrophages, neutrophils, and dendritic cells in COAD, other than B cells (n = 457). (B) LAYN expression has no significant correlations with tumor purity and infiltrating levels of B cells, CD8+ T cells, macrophages, neutrophils, and dendritic cells in LUSC. LAYN expression showed a very weak correlation with CD4+ T cell infiltration level in LUSC (n = 501). (C) LAYN expression is significantly negatively related to tumor purity and has significant positive correlations with infiltrating levels of CD8+ T cells, CD4+ T cells, macrophages, neutrophils, and dendritic cells in STAD but no significant correlation with infiltrating level of B cells (n = 415).
Figure 4
Figure 4
LAYN expression correlated with macrophage polarization in COAD (colon adenocarcinoma) and STAD (stomach adenocarcinoma). Markers include CD86 and CSF1R of monocytes; CCL2, CD68, and IL10 of TAMs (tumor-associated macrophages); NOS2, IRF5, and PTGS2 of M1 macrophages; and CD163, VSIG4, and MS4A4A of M2 macrophages. (A–D) Scatterplots of correlations between LAYN expression and gene markers of monocytes (A), TAMs (B), and M1 (C) and M2 macrophages (D) in COAD (n = 457). (E–H) Scatterplots of correlations between LAYN expression and gene markers of monocytes (E), TAMs (F), and M1 (G) and M2 macrophages (H) in STAD (n = 415). (I–L) The LUSC (lung squamous cell carcinoma) as the control group showed that LAYN expression has no significant correlation with macrophage polarization in LUSC (n = 501). Marker sets of macrophages in LUSC also include monocytes (I), TAMs (J), and M1 (K) and M2 macrophages (L).

References

    1. Siegel RL, Miller KD, Jemal A. Cancer statistics, 2017. CA Cancer J Clin. (2017) 67:7–30. 10.3322/caac.21387 - DOI - PubMed
    1. Procaccio L, Schirripa M, Fassan M, Vecchione L, Bergamo F, Prete AA, et al. . Immunotherapy in gastrointestinal cancers. J Gastrointest Oncol. (2017) 2017:4346576. 10.1155/2017/4346576 - DOI - PMC - PubMed
    1. Barbee MS, Ogunniyi A, Horvat TZ, Dang TO. Current status and future directions of the immune checkpoint inhibitors ipilimumab, pembrolizumab, and nivolumab in oncology. Ann Pharmacother. (2015) 49:907–37. 10.1177/1060028015586218 - DOI - PubMed
    1. Garon EB, Rizvi NA, Hui R, Leighl N, Balmanoukian AS, Eder JP, et al. . Pembrolizumab for the treatment of non–small-cell lung cancer. N Engl J Med. (2015) 372:2018–28. 10.1056/NEJMoa1501824 - DOI - PubMed
    1. Chung KY, Gore I, Fong L, Venook A, Beck SB, Dorazio P, et al. . Phase II study of the anti-cytotoxic T-lymphocyte-associated antigen 4 monoclonal antibody, tremelimumab, in patients with refractory metastatic colorectal cancer. J Clin Oncol. (2010) 28:3485–90. 10.1200/jco.2010.28.3994 - DOI - PubMed

Publication types

MeSH terms