. 2019 Jan 29:10:60.
doi: 10.3389/fimmu.2019.00060. eCollection 2019.

Repurposing of Drugs as Novel Influenza Inhibitors From Clinical Gene Expression Infection Signatures

Affiliations

Repurposing of Drugs as Novel Influenza Inhibitors From Clinical Gene Expression Infection Signatures

Andrés Pizzorno et al. Front Immunol. .

Abstract

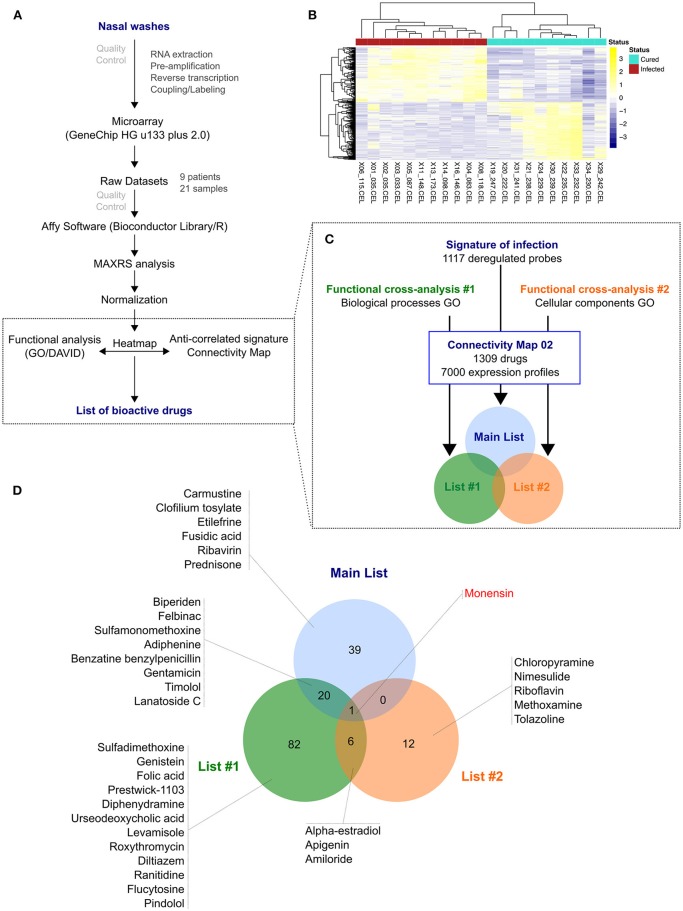
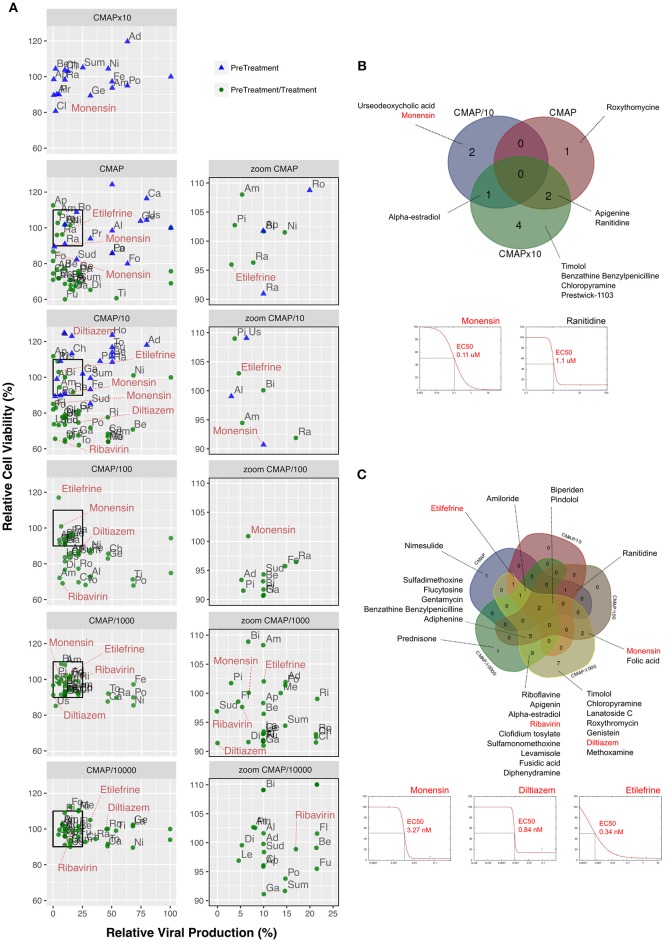
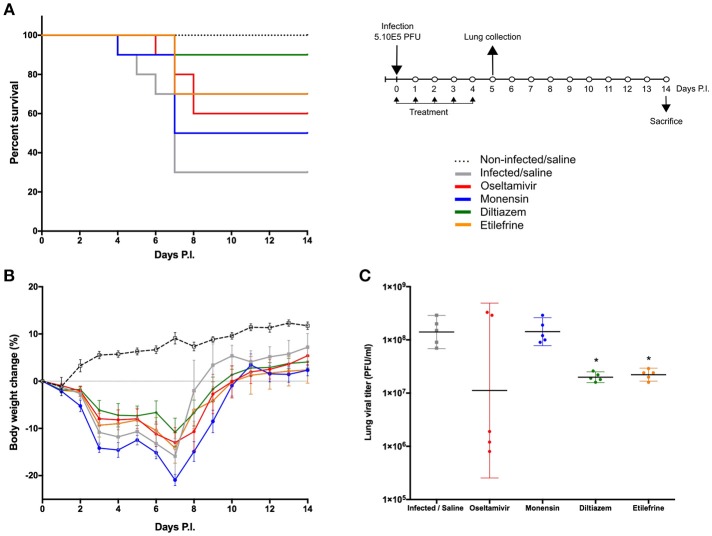
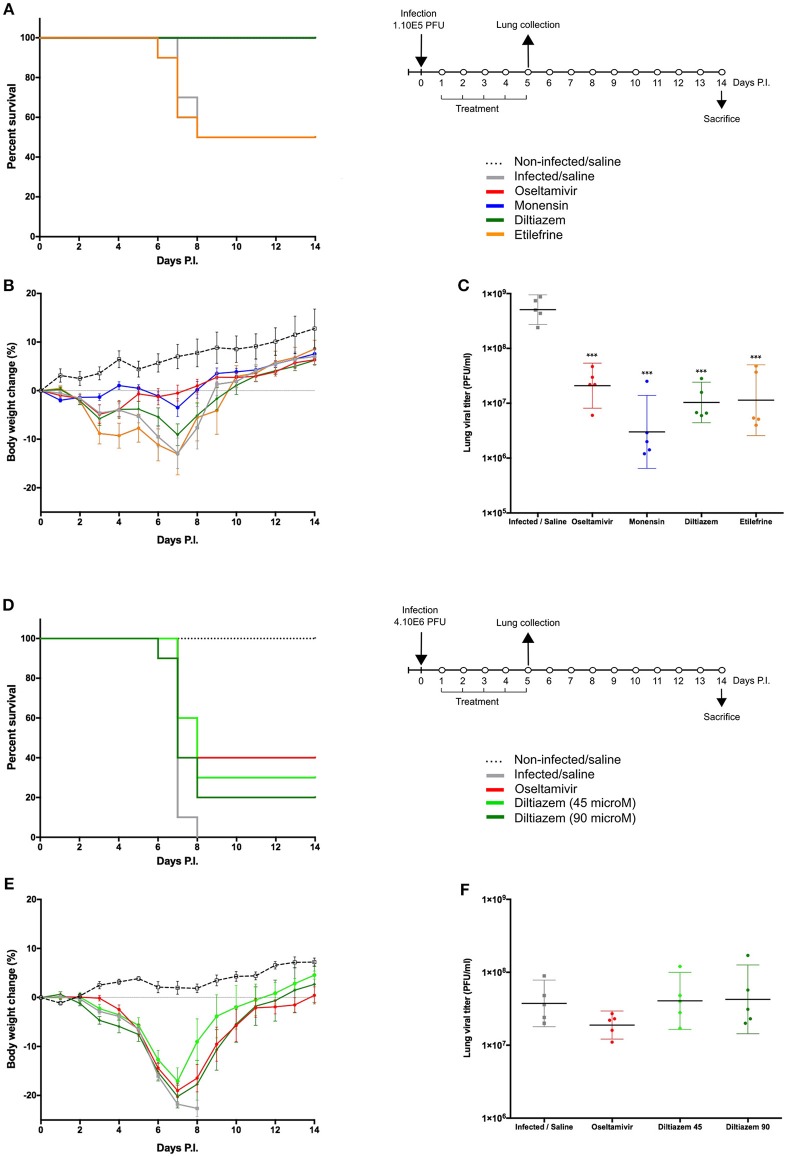
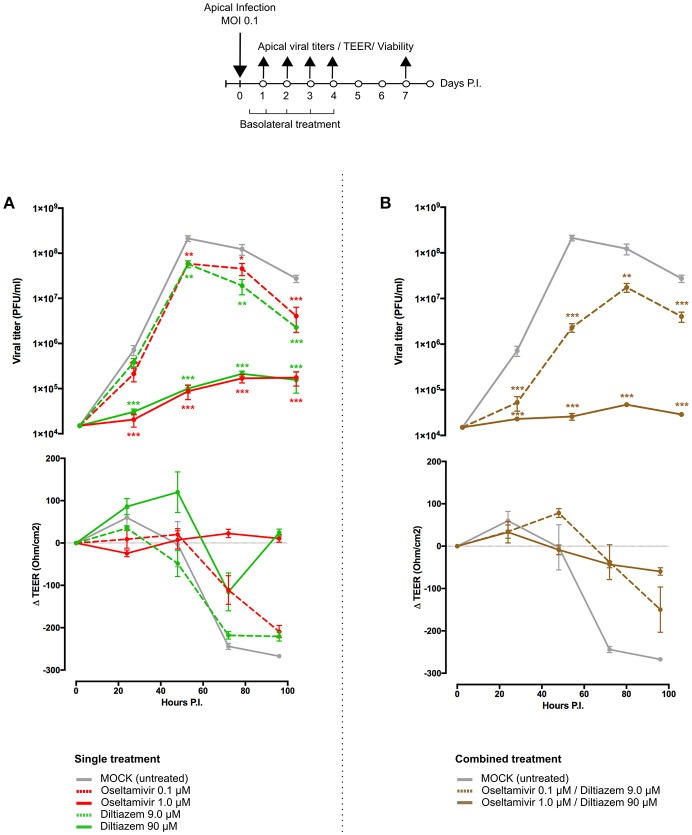
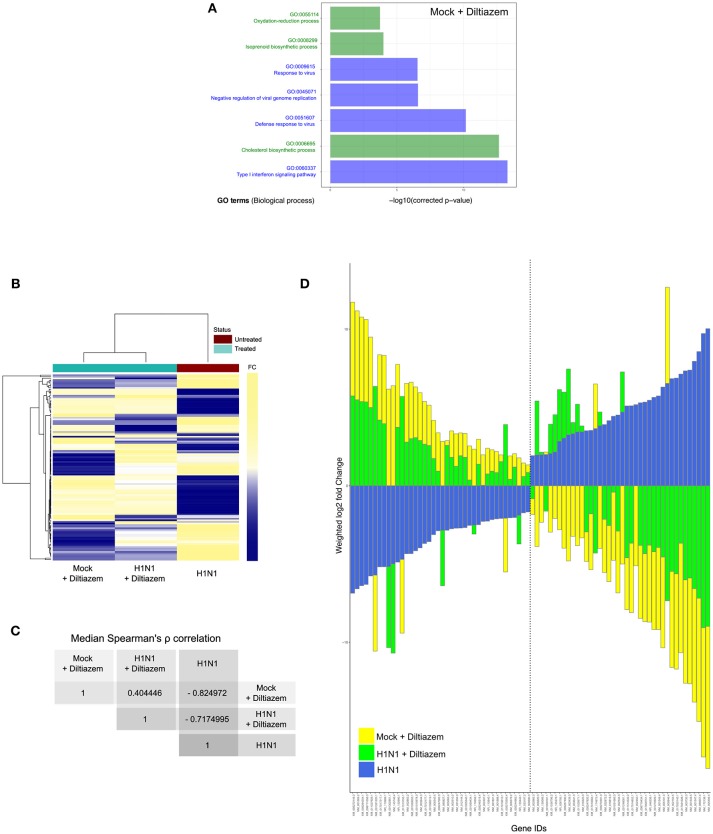
Influenza virus infections remain a major and recurrent public health burden. The intrinsic ever-evolving nature of this virus, the suboptimal efficacy of current influenza inactivated vaccines, as well as the emergence of resistance against a limited antiviral arsenal, highlight the critical need for novel therapeutic approaches. In this context, the aim of this study was to develop and validate an innovative strategy for drug repurposing as host-targeted inhibitors of influenza viruses and the rapid evaluation of the most promising candidates in Phase II clinical trials. We exploited in vivo global transcriptomic signatures of infection directly obtained from a patient cohort to determine a shortlist of already marketed drugs with newly identified, host-targeted inhibitory properties against influenza virus. The antiviral potential of selected repurposing candidates was further evaluated in vitro, in vivo, and ex vivo. Our strategy allowed the selection of a shortlist of 35 high potential candidates out of a rationalized computational screening of 1,309 FDA-approved bioactive molecules, 31 of which were validated for their significant in vitro antiviral activity. Our in vivo and ex vivo results highlight diltiazem, a calcium channel blocker currently used in the treatment of hypertension, as a promising option for the treatment of influenza infections. Additionally, transcriptomic signature analysis further revealed the so far undescribed capacity of diltiazem to modulate the expression of specific genes related to the host antiviral response and cholesterol metabolism. Finally, combination treatment with diltiazem and virus-targeted oseltamivir neuraminidase inhibitor further increased antiviral efficacy, prompting rapid authorization for the initiation of a Phase II clinical trial. This original, host-targeted, drug repurposing strategy constitutes an effective and highly reactive process for the rapid identification of novel anti-infectious drugs, with potential major implications for the management of antimicrobial resistance and the rapid response to future epidemic or pandemic (re)emerging diseases for which we are still disarmed.

Keywords: antivirals; drug repurposing; host targeting; influenza viruses; inhibitors of viral infection; transcriptome.


Figures

Figure 1
Figure 1
From nasal wash clinical samples to a shortlist of 35 candidate molecules. (A) Overview of the in silico strategy used in this study. A detailed description of the strategy is described in the Online Methods section. (B) Hierarchical clustering and heatmap of the 1,117 most differentially deregulated genes between “infected” (red) and “cured” (light green) samples. Raw median centered expression levels are color coded from blue to yellow. Dendrograms indicate the correlation between clinical samples (columns) or genes (rows). (C) Functional cross-analysis of candidate molecules obtained from Connectivity Map (CMAP). Three lists of candidate molecules were obtained using different set of genes in order to introduce functional bias and add more biological significance to this first screening: a Main List based on the complete list of differentially expressed genes, and two other lists (List #1 and #2) based on subsets of genes belonging to significantly enriched Gene Ontology (GO) terms. (D) Venn Diagram comparing the total 160 molecules obtained from the three lists described in (C), with monensin as the only common molecule. Only the candidates selected for in vitro screening and validation are depicted.
Figure 2
Figure 2
Screening and validation of the effect of selected molecules on A(H1N1)pdm09 viral growth in vitro. (A, left) Evaluation on A549 cells of the antiviral potency of the 35 candidates selected by in silico analysis. Relative viral production (%, X axis) and relative cell viability (%, Y axis) of both pre-treatment (blue triangles) and pre-treatment/treatment (green circles) regimens were evaluated. A 10-fold drug concentration range using CMAP as reference (CMAP × 10, CMAP, CMAP/10, CMAP/100, CMAP/1,000, and CMAP/10,000) was used. CMAP × 10 was only tested in the context of pre-treatment, by anticipation of a lower efficacy of molecules in this experimental setup. All experimental assays were performed in triplicate and mean values are represented. (A, right) Zoom panels depicting molecules defined as “inhibitors” according to the following two criteria: (i) induce a 75% or higher reduction on viral production, and (ii) have minor impact on cell viability, with relative values in the 90–110% range. For clarity purposes, with the exception of diltiazem, etilefrine, monensin, and ribavirin. Ad, Adiphenine; Al, Alpha-estradiol; Am, Amiloride; Ap, Apigenin; Be, Benzathine Benzylpenicilline; Bi, Biperiden; Ca, Carmustine; Ch, Chloropyramine; Cl, Clofidium tosylate; Di, Diphenydramine; Fe, Felbinac; Fl, Flucytosine; Fo, Folic acid; Fu, Fusidic acid; Ge, Genistein; Ga, Gentamycin; La, Lanatoside C; Le, Levamisole; Me, Methoxamine; Ni, Nimesulide; Pi, Pindolol; Po, Prednisone; Pr, Prestwick-1103; Ra, Ranitidine; Ri, Riboflavine; Ro, Roxythromycin; Sud, Sulfadimethoxine; Sum, Sulfamonomethoxine; Ti, Timolol; To, Tolazoline; Us, Urseodeoxycholic acid. Dose-response curves for all the 35 molecules are presented in Table S3. (B) Venn diagram of the 10 molecules identified in pre-treatment (10/35; 28.57%) and matching the “inhibitor” criteria, mainly when used at 10-fold CMAP concentration. EC50 curves for monensin and ranitidine are represented. (C) Venn diagram of the 30 “inhibitor” molecules identified in pre-treatment/treatment (30/35; 85.7%). EC50 curves for monensin, diltiazem, and etilefrine are represented.
Figure 3
Figure 3
Efficacy of oral administration of selected molecules in mice infected with influenza A(H1N1)pdm09 virus. C57BL/6N mice (n = 15/group) were intranasally inoculated with 5 × 10⁵ PFU of influenza A/Quebec/144147/09 virus on day 0 and treated by gavage with saline (gray), oseltamivir 10 mg/kg/day (red), monensin 10 mg/kg/day (blue), diltiazem 90 mg/kg/day (green), or etilefrine 3 mg/kg/day (orange). A mock-infected, saline-treated group (black dotted line, n = 6) was included as control. Treatments were initiated on day 0 (6 h before infection) and administered once daily for 5 consecutive days. (A) Survival rates (n = 10/group), (B) mean weight changes (±SEM, n = 10/group or remaining mice) and (C) median (±CI95, n = 5/group) lung viral titers on day 5 p.i. are shown. *p < 0.05, compared to the infected saline-treated group by one-way ANOVA with Tukey's post-test. Data are representative of two independent experiments.
Figure 4
Figure 4
Efficacy of post-infection oral treatment with diltiazem and etilefrine in mice infected with influenza A(H1N1)pdm09 virus. C57BL/6N mice (n = 15/group) were intranasally inoculated with 1 × 10⁵ (A–C) or 4 × 10⁶ (D–F) PFU of influenza A/Quebec/144147/09 virus on day 0 and treated by gavage with saline (gray), oseltamivir 10 mg/kg/day (red), monensin 10 mg/kg/day (blue, A only), diltiazem 45 mg/kg/day (light green, B only), diltiazem 90 mg/kg/day (dark green), or etilefrine 3 mg/kg/day (orange, (A) only). A mock-infected, saline-treated group (black dotted line, n = 6) was included as control. Treatments were initiated on day 1 (24 h after infection and administered once daily for 5 consecutive days. (A,D) Survival rates (n = 10/group), (B,E) mean weight changes (±SEM, n = 10/group or remaining mice), and (C,F) median (±CI95, n = 5/group) lung viral titers on day 5 p.i. are shown. ***p < 0.001, compared to the infected saline-treated group by one-way ANOVA with Tukey's post-test. Data are representative of two independent experiments.
Figure 5
Figure 5
Diltiazem significantly reduces viral replication in infected reconstituted human airway epithelia (HAE). Apical viral production (±SEM) and transepithelial electrical resistance (Δ TEER±SEM) in MucilAir® human airway epithelium infected on the apical pole with influenza A/Lyon/969/09 (H1N1) pdm09 virus at a MOI of 0.1 and subjected to (A) single or (B) combined treatments by the basolateral pole. Treatments with culture medium (mock, gray), oseltamivir 0.1 μM (red, dotted line), oseltamivir 1 μM (red, solid line), diltiazem 9 μM (green, dotted line), diltiazem 90 μM (green, solid line), oseltamivir 0.1 μM/diltiazem 9 μM (brown, dotted line) or oseltamivir 1 μM/diltiazem 90 μM (brown, solid line) were initiated 5 h after infection and administered once daily for 5 consecutive days. **p < 0.01 and ***p < 0.001 compared to the infected Mock-treated group by one-way ANOVA with Tukey's post-test. Data are representative of three independent experiments.
Figure 6
Figure 6
Diltiazem treatment effectively induces significant reversion of the viral infection signature. (A) DAVID gene enrichment analysis of the diltiazem transcriptional signature. The seven most significant biological processes (BP) are presented. BP related to antiviral response and cholesterol biosynthesis/metabolism are represented in blue and green, respectively. (B) Hierarchical clustering and heatmap of the 118 common differentially expressed transcripts (absolute fold change >2, Benjamini-Hochberg corrected p-value < 0.05) between mock-infected/diltiazem (“mock + diltiazem”), infected/mock-treated (“H1N1”), or infected/diltiazem (“H1N1 + diltiazem”) HAE. The mock-infected/mock-treated (“mock”) condition was used as baseline. Mean-weighted fold changes are color-coded from blue to yellow. (C) Median Spearman ρ correlation value calculations between the 3 conditions highlighted in the heatmap. (D) Stacked barplot representation of the 40 most up/down-regulated transcripts highlighted in the analysis. Barplots were constructed in R3.3.1 based on mean-weighted fold changes and ordered according to H1N1 values (blue). Mock + diltiazem and H1N1 + diltiazem conditions are represented in yellow and green, respectively.

Similar articles

Cited by

References

    1. Influenza Facts Sheet n°211 (2014) Available online at: http://www.who.int/mediacentre/factsheets/fs211/en/ (Accessed January 20, 2016).
    1. Loregian A, Mercorelli B, Nannetti G, Compagnin C, Palù G. Antiviral strategies against influenza virus: towards new therapeutic approaches. Cell Mol Life Sci CMLS (2014) 71:3659–83. 10.1007/s00018-014-1615-2 - DOI - PMC - PubMed
    1. Booth B, Zemmel R. Prospects for productivity. Nat Rev Drug Discov. (2004) 3:451–6. 10.1038/nrd1384 - DOI - PubMed
    1. Ashburn TT, Thor KB. Drug repositioning: identifying and developing new uses for existing drugs. Nat Rev Drug Discov. (2004) 3:673–83. 10.1038/nrd1468 - DOI - PubMed
    1. Law GL, Tisoncik-Go J, Korth MJ, Katze MG. Drug repurposing: a better approach for infectious disease drug discovery? Curr Opin Immunol. (2013) 25:588–92. 10.1016/j.coi.2013.08.004 - DOI - PMC - PubMed

Publication types

MeSH terms

Substances