

Secretion of IL-1β From Monocytes in Gout Is Redox Independent
- PMID: 30761138
- PMCID: PMC6361747
- DOI: 10.3389/fimmu.2019.00070
Secretion of IL-1β From Monocytes in Gout Is Redox Independent
Abstract
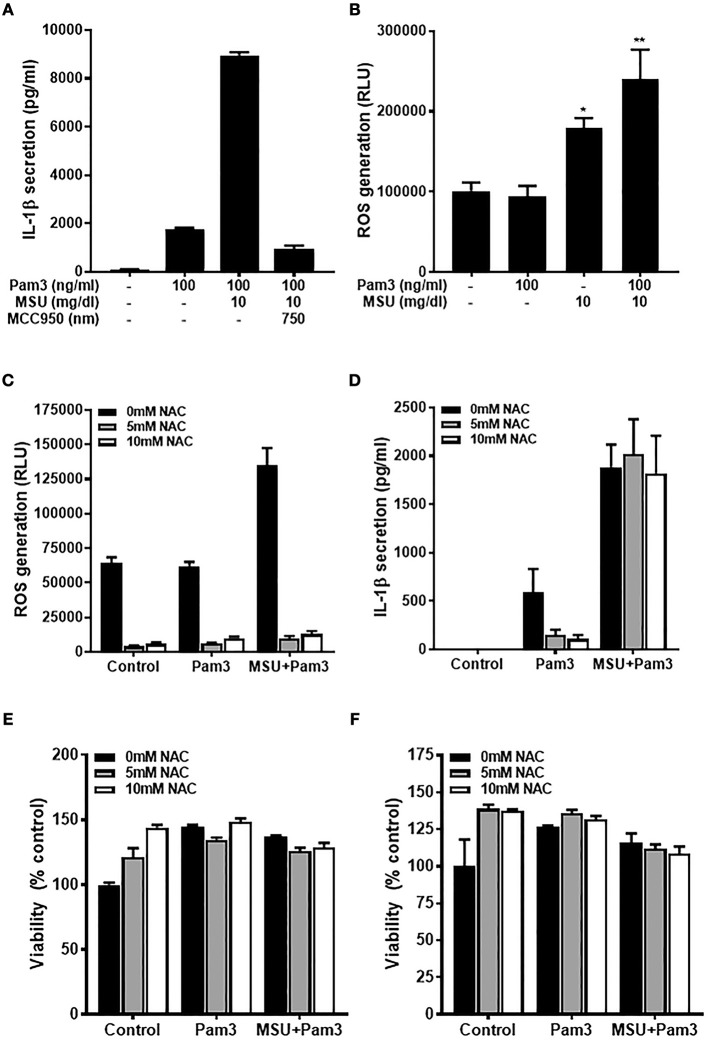
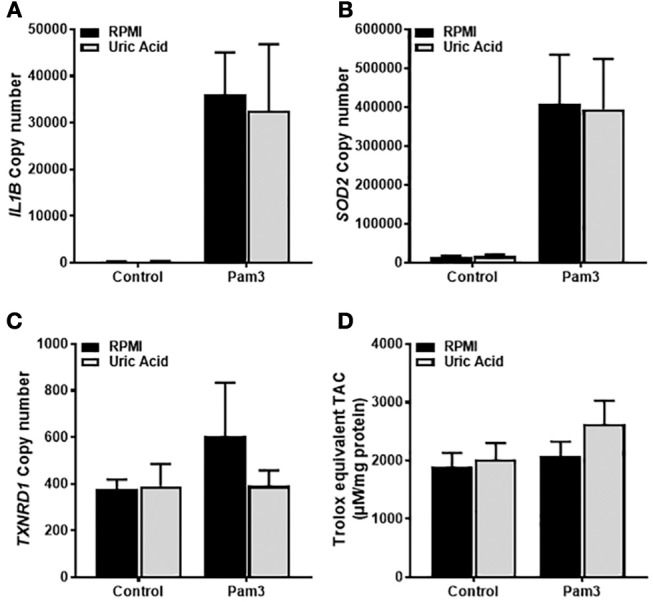
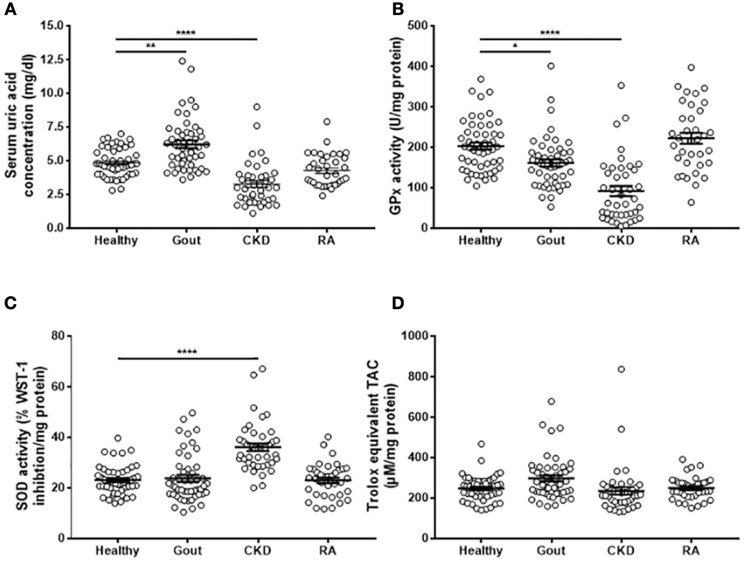
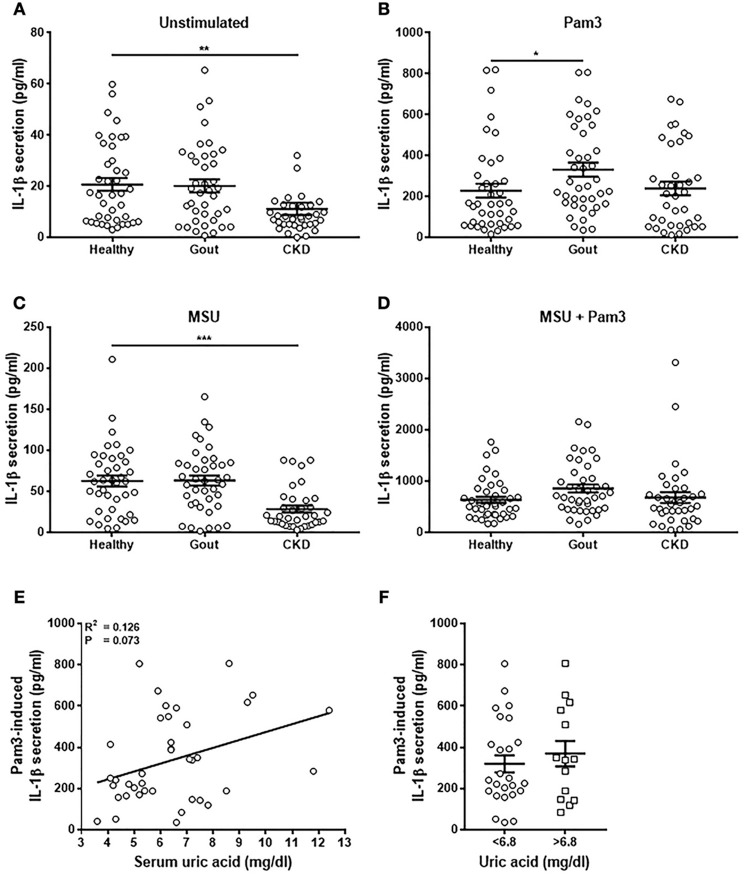
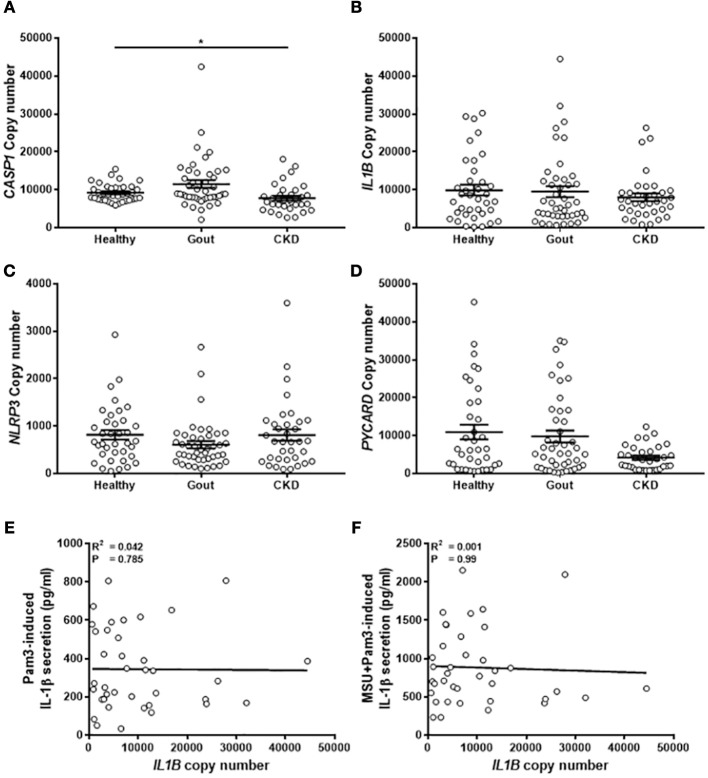
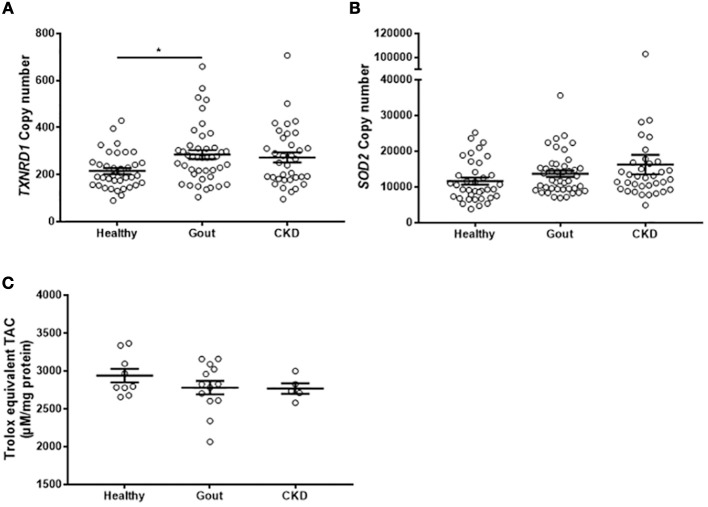
The pro-inflammatory cytokine interleukin-1β (IL-1β) plays important roles in immunity but is also implicated in autoimmune disease. The most well-established mechanism of IL-1β secretion is via activation of the NOD-like receptor family pyrin domain containing-3 (NLRP3) inflammasome which requires an initial priming signal followed by an activating signal. However, the precise mechanism by which the inflammasome is activated remains unclear. The role of reactive oxygen species (ROS) in this process is contradictory, with some studies suggesting that ROS are crucial while others describe opposite effects. In this study, we evaluated the effects of oxidative stress on IL-1β secretion. Gout is a disease driven solely by IL-1β secretion in response to monosodium urate (MSU) crystals which form during periods of hyperuricemia and thus presents an opportunity to study factors contributing to IL-1β secretion. Sera and monocytes were isolated from patients with gout to determine whether differences in antioxidant status could explain the susceptibility of these individuals to gout attacks. In addition, sera and monocytes were collected from patients with chronic kidney disease (CKD) for comparison as this condition is associated with high levels of oxidative stress and disturbances in serum uric acid levels. There were differences in some aspects of antioxidant defenses in gout patients and these were mainly due to higher serum uric acid. Monocytes from gout patients were more responsive to priming, but not activation, of the NLRP3 inflammasome. However, expression of the components of the NLRP3 inflammasome were unaffected by priming or activation of the inflammasome, nor were these expression levels differentially regulated in gout patients. Inhibition of ROS by N-Acetyl Cysteine inhibited TLR2-induced priming of the NLRP3 inflammasome, but had no effect on MSU-induced activation. Together these findings demonstrate that oxidative stress only affects priming of the NLRP3 inflammasome but does not influence activation.
Keywords: IL-1β; NLRP3 inflammasome; antioxidant capacity; chronic kidney disease; gout; reactive oxygen species; redox regulation.
Figures
Similar articles
-
Genetic and Epigenetic Regulation of the Innate Immune Response to Gout.Immunol Invest. 2023 Apr;52(3):364-397. doi: 10.1080/08820139.2023.2168554. Epub 2023 Feb 6. Immunol Invest. 2023. PMID: 36745138 Review.
-
Precipitation of Soluble Uric Acid Is Necessary for In Vitro Activation of the NLRP3 Inflammasome in Primary Human Monocytes.J Rheumatol. 2019 Sep;46(9):1141-1150. doi: 10.3899/jrheum.180855. Epub 2019 Mar 1. J Rheumatol. 2019. PMID: 30824640
-
Toll-Like Receptor 9 Is Involved in NLRP3 Inflammasome Activation and IL-1β Production Through Monosodium Urate-Induced Mitochondrial DNA.Inflammation. 2020 Dec;43(6):2301-2311. doi: 10.1007/s10753-020-01299-6. Inflammation. 2020. PMID: 32700178
-
Decoy Receptor 3 Inhibits Monosodium Urate-Induced NLRP3 Inflammasome Activation via Reduction of Reactive Oxygen Species Production and Lysosomal Rupture.Front Immunol. 2021 Mar 3;12:638676. doi: 10.3389/fimmu.2021.638676. eCollection 2021. Front Immunol. 2021. PMID: 33746978 Free PMC article.
-
Beneficial Properties of Phytochemicals on NLRP3 Inflammasome-Mediated Gout and Complication.J Agric Food Chem. 2018 Jan 31;66(4):765-772. doi: 10.1021/acs.jafc.7b05113. Epub 2018 Jan 17. J Agric Food Chem. 2018. PMID: 29293001 Review.
Cited by
-
Blockade of Autophagy Prevents the Progression of Hyperuricemic Nephropathy Through Inhibiting NLRP3 Inflammasome-Mediated Pyroptosis.Front Immunol. 2022 Mar 2;13:858494. doi: 10.3389/fimmu.2022.858494. eCollection 2022. Front Immunol. 2022. PMID: 35309342 Free PMC article.
-
NLRP3 inflammasome activation and cell death.Cell Mol Immunol. 2021 Sep;18(9):2114-2127. doi: 10.1038/s41423-021-00740-6. Epub 2021 Jul 28. Cell Mol Immunol. 2021. PMID: 34321623 Free PMC article. Review.
-
The emerging role of neutrophils in autoimmune-associated disorders: effector, predictor, and therapeutic targets.MedComm (2020). 2021 Jul 22;2(3):402-413. doi: 10.1002/mco2.69. eCollection 2021 Sep. MedComm (2020). 2021. PMID: 34766153 Free PMC article. Review.
-
The roles of NLRP3 inflammasome-mediated signaling pathways in hyperuricemic nephropathy.Mol Cell Biochem. 2021 Mar;476(3):1377-1386. doi: 10.1007/s11010-020-03997-z. Epub 2021 Jan 3. Mol Cell Biochem. 2021. PMID: 33389490 Review.
-
Cold-inducible RNA-binding protein (CIRP) potentiates uric acid-induced IL-1β production.Arthritis Res Ther. 2021 Apr 26;23(1):128. doi: 10.1186/s13075-021-02508-9. Arthritis Res Ther. 2021. PMID: 33902703 Free PMC article.
References
-
- Lipsky PE, Van Der Heijde DM, St Clair EW, Furst DE, Breedveld FC, Kalden JR, et al. . Infliximab and methotrexate in the treatment of rheumatoid arthritis. Anti-tumor necrosis factor trial in rheumatoid arthritis with concomitant therapy study group. N Engl J Med. (2000) 343:1594–602. 10.1056/NEJM200011303432202 - DOI - PubMed
-
- Weinblatt ME, Keystone EC, Furst DE, Moreland LW, Weisman MH, Birbara CA, et al. . Adalimumab, a fully human anti-tumor necrosis factor alpha monoclonal antibody, for the treatment of rheumatoid arthritis in patients taking concomitant methotrexate: the ARMADA trial. Arthr Rheum. (2003) 48:35–45. 10.1002/art.10697 - DOI - PubMed
-
- Illei GG, Shirota Y, Yarboro CH, Daruwalla J, Tackey E, Takada K, et al. . Tocilizumab in systemic lupus erythematosus: data on safety, preliminary efficacy, and impact on circulating plasma cells from an open-label phase I dosage-escalation study. Arthr Rheum. (2010) 62:542–52. 10.1002/art.27221 - DOI - PMC - PubMed
Publication types
MeSH terms
Substances
LinkOut - more resources
Full Text Sources
Medical