. 2019 Jan 30:10:95.
doi: 10.3389/fimmu.2019.00095. eCollection 2019.

Toll-Like Receptor Signaling Drives Btk-Mediated Autoimmune Disease

Affiliations

Toll-Like Receptor Signaling Drives Btk-Mediated Autoimmune Disease

Jasper Rip et al. Front Immunol. .

Abstract

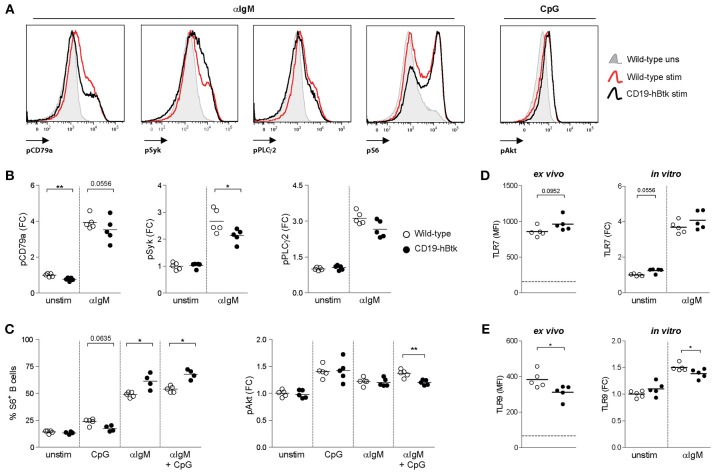
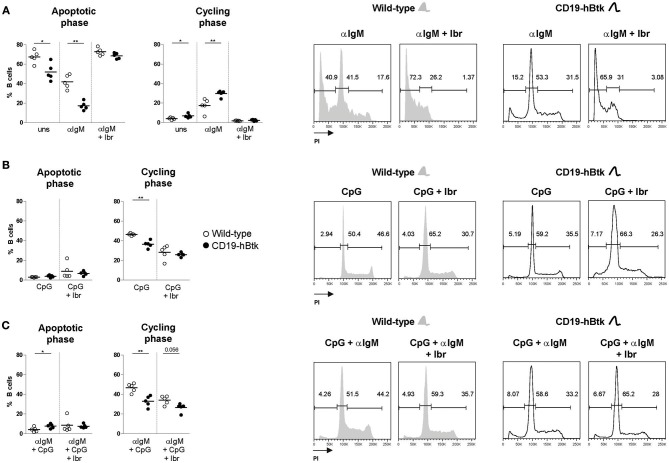
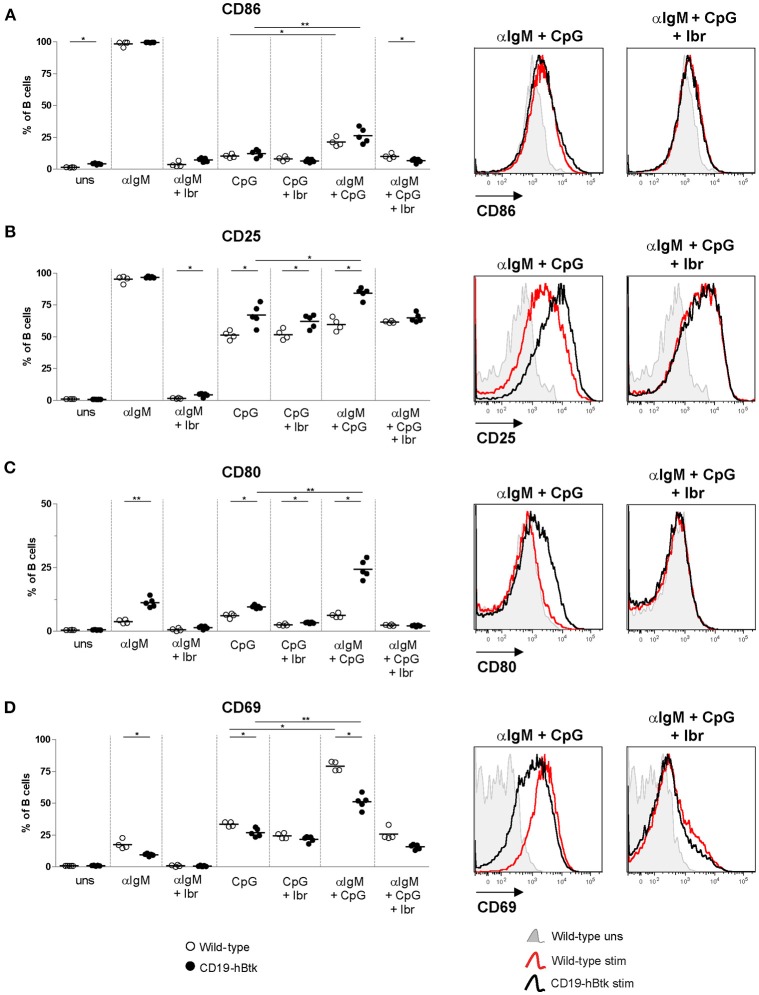
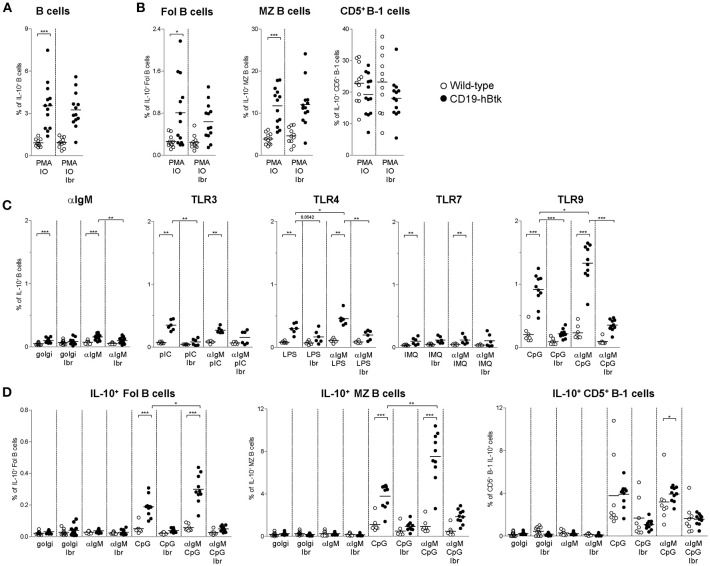
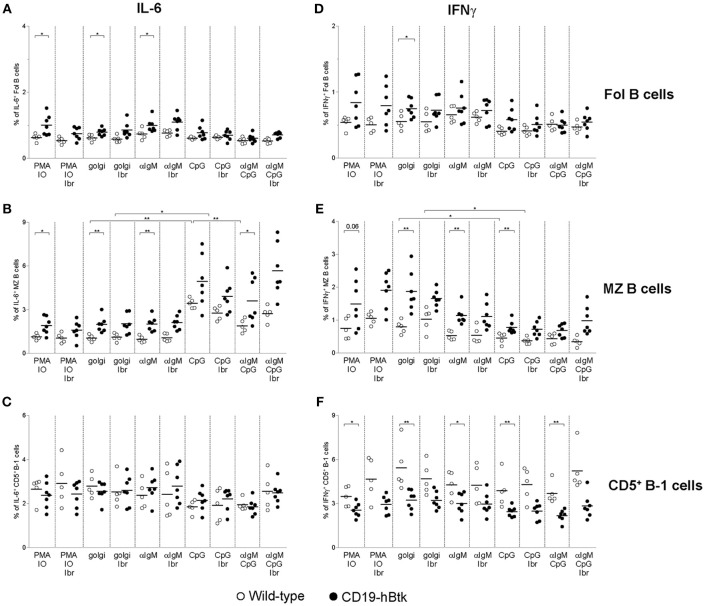
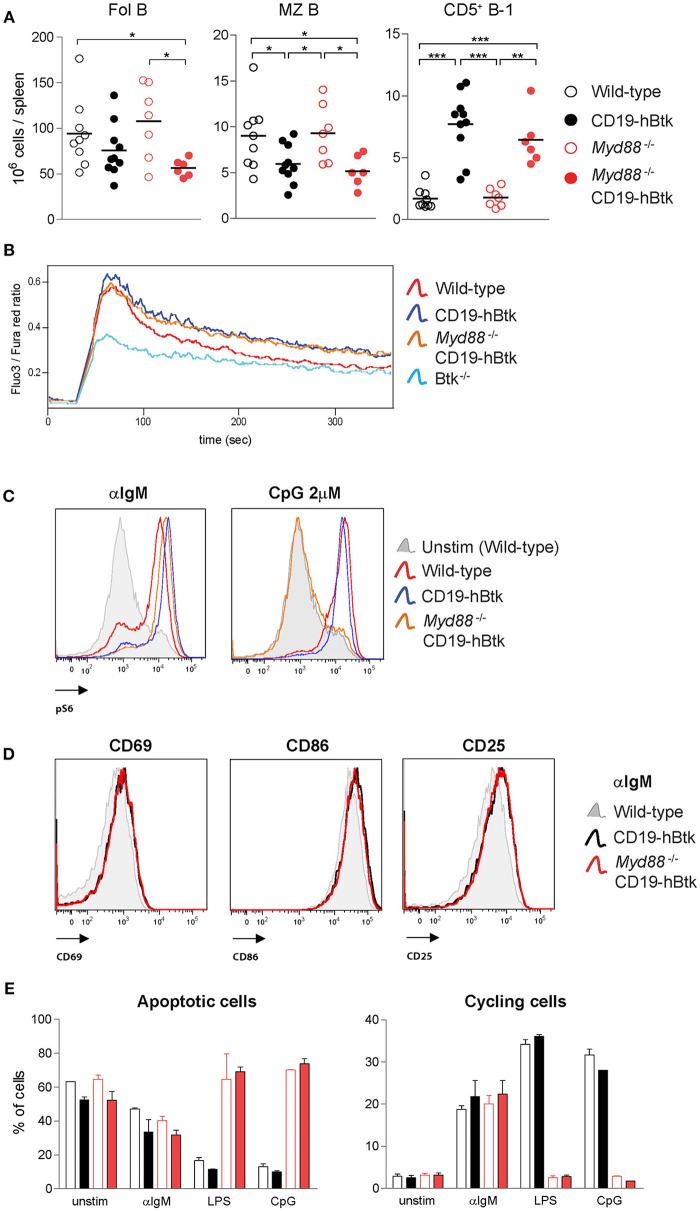
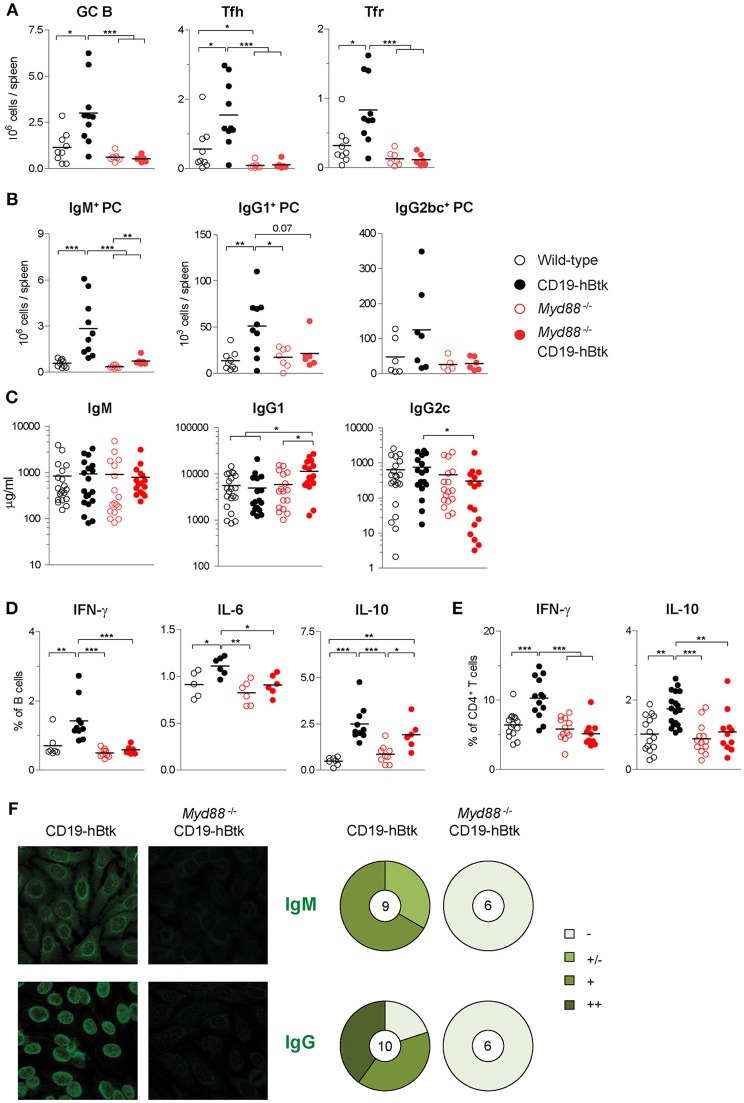
Bruton's tyrosine kinase (Btk) is a signaling molecule involved in development and activation of B cells through B-cell receptor (BCR) and Toll-like receptor (TLR) signaling. We have previously shown that transgenic mice that overexpress human Btk under the control of the CD19 promoter (CD19-hBtk) display spontaneous germinal center formation, increased cytokine production, anti-nuclear autoantibodies (ANAs), and systemic autoimsmune disease upon aging. As TLR and BCR signaling are both implicated in autoimmunity, we studied their impact on splenic B cells. Using phosphoflow cytometry, we observed that phosphorylation of ribosomal protein S6, a downstream Akt target, was increased in CD19-hBtk B cells following BCR stimulation or combined BCR/TLR stimulation, when compared with wild-type (WT) B cells. The CD19-hBtk transgene enhanced BCR-induced B cell survival and proliferation, but had an opposite effect following TLR9 or combined BCR/TLR9 stimulation. Although the expression of TLR9 was reduced in CD19-hBtk B cells compared to WT B cells, a synergistic effect of TLR9 and BCR stimulation on the induction of CD25 and CD80 was observed in CD19-hBtk B cells. In splenic follicular (Fol) and marginal zone (MZ) B cells from aging CD19-hBtk mice BCR signaling stimulated in vitro IL-10 production in synergy with TLR4 and particularly TLR9 stimulation, but not with TLR3 and TLR7. The enhanced capacity of CD19-hBtk Fol B cells to produce the pro-inflammatory cytokines IFNγ and IL-6 compared with WT B cells was however not further increased following in vitro BCR or TLR9 stimulation. Finally, we used crosses with mice deficient for the TLR-associated molecule myeloid differentiation primary response 88 (MyD88) to show that TLR signaling was crucial for spontaneous formation of germinal centers, increased IFNγ, and IL-6 production by B cells and anti-nuclear autoantibody induction in CD19-hBtk mice. Taken together, we conclude that high Btk expression does not only increase B cell survival following BCR stimulation, but also renders B cells more sensitive to TLR stimulation, resulting in increased expression of CD80, and IL-10 in activated B cells. Although BCR-TLR interplay is complex, our findings show that both signaling pathways are crucial for the development of pathology in a Btk-dependent model for systemic autoimmune disease.

Keywords: B cell; Bruton's tyrosine kinase; Toll-like receptor; autoimmune disease; phosphoflow cytometry.


Figures

Figure 1
Figure 1
Increased S6 phosphorylation upon BCR engagement in CD19-hBtk B cells. (A) Histogram overlays of representative examples of the phosphoprotein analyses are shown for αIgM-induced induction of pCD79a, pSyk, pPLCγ2 and pS6, as well as CpG-induced pAkt. (B–C) Splenic cells of wild-type (WT) and CD19-hBtk transgenic mice were stimulated for 5 min (CD79a, Syk, and PLCγ2) or 3 h (S6 and Akt) and gated for B cells after the indicated in vitro stimulation. Fold change (FC) increase of median fluoresence intensity (MFI) values compared to WT unstimulated are shown for phosphorylation of CD79a, Syk, PLCγ2 (B), and Akt (C). Phosphorylation of ribosomal protein S6 was quantified using percentages of positive cells compared to unstimulated cells (C). (D,E) MFI values of TLR7 (D) and TLR9 (E) protein in splenic B cells ex vivo and MFI FC induction of these TLRs on MACS-purified B cells after 48 h of stimulation with αIgM (dotted line indicates expression in T cells). Symbols represent individual mice and bars indicate mean values. Graphs represent one to two individual experiments, each with 4–5 mice per group; CD19-hBtk and WT mice were 8–10 weeks old; *p < 0.05, **p < 0.01 by Mann-Whitney U test.
Figure 2
Figure 2
BCR and TLR9 stimulation have different effects on CD19-hBtk B cells. Proportions of B cells in apoptotic or cycling fractions, as determined by propidium iodide (PI) DNA content staining of in vitro cultured purified naïve splenic B cells that were stimulated with 10 μg αIgM (A), 2 μM CpG (B), or αIgM and CpG combined (C), with or without ibrutinib (Ibr, 1 μM) as indicated (left). Symbols represent individual mice and bars indicate mean values. Representative flow cytometry graphs of WT and CD19-hBtk B cells are shown on the right, with the gating applied for apoptotic cells (sub-G1), resting cells (G0/G1), and dividing (S/G2/M) B cells. CD19-hBtk and WT mice were 8–10 weeks old; n = 4–5 per group; *p < 0.05, **p < 0.01 by Mann–Whitney U-test.
Figure 3
Figure 3
CD19-hBtk B cells show increased upregulation of activation markers upon synergistic BCR and TLR9 stimulation. Proportions of B cells positive for CD86 (A), CD25 (B), CD80 (C), and CD69 (D) upon 72 h of stimulation of MACS-purified naïve splenic B cells with 10 μg αIgM (αIgM) and/or 2 μM CpG, with or without ibrutinib (Ibr, 1 μM), as indicated (left). Symbols represent individual mice and bars indicate mean values. Representative histogram overlays are depicted on the right. CD19-hBtk and WT mice were 8–10 weeks old; n = 4–5 per group; *p < 0.05, **p < 0.01 by Mann–Whitney U-test.
Figure 4
Figure 4
Increased IL-10 expression following synergistic BCR and TLR9 stimulation of CD19-hBtk B cells. (A,B) Proportions of IL-10-expressing B cells after 4 h of in vitro stimulation of total splenocytes from the indicated mice with PMA/ionomycin in the presence of monensin (golgi), as determined by intracellular flow cytometry. Shown are data for gated total CD19+B220+CD3 B cells (A), or for gated B cell subpopulations (B), as indicated: follicular (Fol) B cells, marginal zone (MZ) B cells and CD5+ B-1 cells. (C) Proportions of IL-10-expressing B cells after 4 h of in vitro stimulation of total splenocytes from the indicated mice with αIgM, the indicated TLR ligands, or combinations thereof in the presence of monensin (golgi), as determined by intracellular flow cytometry. (D) Proportions of IL-10-expressing B cells after 4 h of in vitro stimulation of total splenocytes from the indicated mice with αIgM (αIgM), CpG, or combinations thereof, with or without ibrutinib (Ibr, 1 μM), in the presence of monensin (golgi), as determined by intracellular flow cytometry. CD19-hBtk and WT mice were 28–33 weeks old. Symbols represent individual mice and bars indicate mean values. Graphs represent two to three individual experiments; *p < 0.05, **p < 0.01, ***p < 0.001 by Mann–Whitney U-test.
Figure 5
Figure 5
Analysis of IL-6 and IFNγ expression in B cell subsets from CD19-hBtk B cells. Proportions of IL-6+ (A–C) and IFNγ+ (D–F) B cells upon stimulation with the indicated stimuli, with or without ibrutinib (Ibr, 1 μM) in the presence of monensin (golgi), within gated B cell subsets: follicular (Fol) B cells (A,D), MZ B cells (B,E), and CD5+ B-1 cells (C,F). CD19-hBtk and WT mice were 28–33 weeks old. Symbols represent individual mice and bars indicate mean values. Graphs are representative for one to two individual experiments; *p < 0.05, **p < 0.01 by Mann–Whitney U-test.
Figure 6
Figure 6
Increased BCR responsiveness in CD19-hBtk B cells is independent of MyD88 expression. (A) Quantification of the absolute numbers of Fol B cells (CD19+CD21CD23+), MZ B cells (CD19+CD21+CD23), and CD5+ B-1 cells (CD19highB220intCD5+) in spleens from the indicated aged mice. (B) Ca2+ influx assay in B cells after stimulation with 25 μg F(ab')2 anti-IgM in the indicated mouse groups. Data are representative for three mice analyzed. (C) Representative histogram overlays of phosphorylated S6 (pS6) upon 20 μg/mL αIgM or 2 μM CpG stimulation in the indicated mouse groups. Data are representative for two to three mice analyzed. (D) Representative histogram overlays of the expression of activation markers CD69, CD86, and CD25 in Myd88−/− CD19-hBtk (red), CD19-hBtk (black), and WT mice (gray). Data are representative for two mice analyzed. (E) Proportions of B cells in apoptotic (left) or cycling (right) fractions, as determined by PI staining for DNA content, after 2 days of in vitro stimulation with the indicated stimuli. CD19-hBtk and WT mice were 28–33 weeks old (A) or eight weeks old (B–E). Data (mean values + SD) represent one to three individual experiments; *p < 0.05, **p < 0.01, ***p < 0.001 by Mann–Whitney U-test.
Figure 7
Figure 7
MyD88 is required for Btk-mediated autoimmune disease. (A) Absolute numbers of splenic germinal center B cells (GC; CD19+IgDCD95+), Fol T helper cells (Tfh; CD3+CD4+CXCR5+PD1+ FoxP3) and Fol T regulatory cells (Tfr; CD3+CD4+CXCR5+PD1+ FoxP3+). (B) Absolute numbers of splenic IgM+, IgG1+, and IgG2bc+ plasma cells (PC; CD11bIgG1IgGbcIgM+CD138+, CD11bIgG1+CD138+, and CD11bIgG2bc+CD138+, respectively). (C) Serum concentrations of IgM, IgG1, and IgG2c, as determined by ELISA. (D,E) IFNγ, IL-6, and IL-10 expression in gated B cell fractions (D) and CD3+CD4+ T cell fractions (E) upon in vitro stimulation with PMA/ionomycin for 4 h in the presence of monensin. Symbols represent individual mice and bars indicate mean values. Graphs represent two to three individual experiments. (F) Representative pictures of serum IgM (upper panel) and IgG (lower panel) reactivity with HEp-2 cells and quantification of autoreactivity. Total number of mice analyzed are indicated within the pie charts; –, no staining; +/–, mild staining; +, moderate staining; ++, strong staining. CD19-hBtk and WT mice were 28–33 weeks old; *p < 0.05, **p < 0.01, ***p < 0.001 by Mann–Whitney U-test.

References

    1. Edwards JC, Szczepanski L, Szechinski J, Filipowicz-Sosnowska A, Emery P, Close DR, et al. . Efficacy of B-cell-targeted therapy with rituximab in patients with rheumatoid arthritis. N Engl J Med. (2004) 350:2572–81. 10.1056/NEJMoa032534 - DOI - PubMed
    1. Gottenberg JE, Cinquetti G, Larroche C, Combe B, Hachulla E, Meyer O, et al. . Efficacy of rituximab in systemic manifestations of primary Sjogren's syndrome: results in 78 patients of the AutoImmune and Rituximab registry. Ann Rheum Dis. (2013) 72:1026–31. 10.1136/annrheumdis-2012-202293 - DOI - PubMed
    1. Rip J, Van Der Ploeg EK, Hendriks RW, Corneth OBJ. The role of bruton's tyrosine kinase in immune cell signaling and systemic autoimmunity. Crit Rev Immunol. (2018) 38:17–62. 10.1615/CritRevImmunol.2018025184 - DOI - PubMed
    1. Rawlings DJ, Metzler G, Wray-Dutra M, Jackson SW. Altered B cell signalling in autoimmunity. Nat Rev Immunol. (2017) 17:421–36. 10.1038/nri.2017.24 - DOI - PMC - PubMed
    1. Smith CI, Baskin B, Humire-Greiff P, Zhou JN, Olsson PG, Maniar HS, et al. . Expression of Bruton's agammaglobulinemia tyrosine kinase gene, BTK, is selectively down-regulated in T lymphocytes and plasma cells. J Immunol. (1994) 152:557–65. - PubMed

Publication types