Genotoxic stress causes the accumulation of DNA-dependent protein kinase catalytic subunit phosphorylated at serine 2056 at nuclear speckles and alters pre-mRNA alternative splicing
- PMID: 30761255
- PMCID: PMC6356181
- DOI: 10.1002/2211-5463.12569
Genotoxic stress causes the accumulation of DNA-dependent protein kinase catalytic subunit phosphorylated at serine 2056 at nuclear speckles and alters pre-mRNA alternative splicing
Abstract
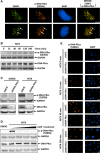
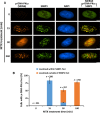
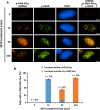
RNA splicing has emerged as a critical player in the DNA damage response (DDR). However, the underlying mechanism(s) by which pre-mRNA splicing is coordinately regulated by genotoxic stress has remained largely unclear. Here, we show that a DDR factor, DNA-dependent protein kinase (DNA-PK), participates in the modulation of pre-mRNA splicing in the presence of DNA double-strand break (DSB)-induced genotoxic stress. Through indirect immunostaining, we made the surprising discovery that DNA-PK catalytic subunits (DNA-PKcs) autophosphorylated at serine 2056 (S2056) accumulate at nuclear speckles (dynamic nuclear structures that are enriched with splicing factors), following their dissociation from DSB lesions. Inactivation of DNA-PKcs, either using a small molecule inhibitor or by RNA interference, alters alternative splicing of a set of pre-mRNAs in A549 cells treated with the topoisomerase II inhibitor mitoxantrone, indicative of an involvement of DNA-PKcs in modulating pre-mRNA splicing following genotoxic stress. These findings indicate a novel physical and functional connection between the DNA damage response and pre-mRNA splicing, and enhance our understanding of how mRNA splicing is involved in the cellular response to DSB lesions.
Keywords: DNA damage response; DNA‐PKcs; genotoxic stress; nuclear speckles; pre‐mRNA splicing.
Figures


Similar articles
-
DNA-PKcs, a player winding and dancing with RNA metabolism and diseases.Cell Mol Biol Lett. 2025 Mar 4;30(1):25. doi: 10.1186/s11658-025-00703-z. Cell Mol Biol Lett. 2025. PMID: 40038612 Free PMC article. Review.
-
ATR-dependent phosphorylation of DNA-dependent protein kinase catalytic subunit in response to UV-induced replication stress.Mol Cell Biol. 2006 Oct;26(20):7520-8. doi: 10.1128/MCB.00048-06. Epub 2006 Aug 14. Mol Cell Biol. 2006. PMID: 16908529 Free PMC article.
-
Regulation of DNA-dependent protein kinase by protein kinase CK2 in human glioblastoma cells.Oncogene. 2010 Nov 11;29(45):6016-26. doi: 10.1038/onc.2010.337. Epub 2010 Aug 16. Oncogene. 2010. PMID: 20711232
-
PDIP38 is translocated to the spliceosomes/nuclear speckles in response to UV-induced DNA damage and is required for UV-induced alternative splicing of MDM2.Cell Cycle. 2013 Oct 1;12(19):3184-93. doi: 10.4161/cc.26221. Epub 2013 Sep 3. Cell Cycle. 2013. PMID: 23989611 Free PMC article.
-
Genotoxic stress response: What is the role of cytoplasmic mRNA fate?Bioessays. 2021 Aug;43(8):e2000311. doi: 10.1002/bies.202000311. Epub 2021 Jun 7. Bioessays. 2021. PMID: 34096096 Review.
Cited by
-
Huntingtin interactome reveals huntingtin role in regulation of double strand break DNA damage response (DSB/DDR), chromatin remodeling and RNA processing pathways.bioRxiv [Preprint]. 2024 Dec 27:2024.12.27.630542. doi: 10.1101/2024.12.27.630542. bioRxiv. 2024. PMID: 39763784 Free PMC article. Preprint.
-
DNA-PKcs, a player winding and dancing with RNA metabolism and diseases.Cell Mol Biol Lett. 2025 Mar 4;30(1):25. doi: 10.1186/s11658-025-00703-z. Cell Mol Biol Lett. 2025. PMID: 40038612 Free PMC article. Review.
-
DNA Damage Regulates the Functions of the RNA Binding Protein Sam68 through ATM-Dependent Phosphorylation.Cancers (Basel). 2022 Aug 9;14(16):3847. doi: 10.3390/cancers14163847. Cancers (Basel). 2022. PMID: 36010841 Free PMC article.
-
Reciprocal regulation between alternative splicing and the DNA damage response.Genet Mol Biol. 2020 Mar 27;43(1 suppl. 1):e20190111. doi: 10.1590/1678-4685-GMB-2019-0111. eCollection 2020. Genet Mol Biol. 2020. PMID: 32236390 Free PMC article.
-
DNA-PKcs restricts Zika virus spreading and is required for effective antiviral response.Front Immunol. 2022 Oct 13;13:1042463. doi: 10.3389/fimmu.2022.1042463. eCollection 2022. Front Immunol. 2022. PMID: 36311766 Free PMC article.
References
-
- Khanna KK and Jackson SP (2001) DNA double‐strand breaks: signaling, repair and the cancer connection. Nat Genet 27, 247–254. - PubMed
-
- Burma S, Chen BP and Chen DJ (2006) Role of non‐homologous end joining (NHEJ) in maintaining genomic integrity. DNA Repair 5, 1042–1048. - PubMed
-
- Weterings E and van Gent DC (2004) The mechanism of non‐homologous end‐joining: a synopsis of synapsis. DNA Repair 3, 1425–1435. - PubMed
Publication types
MeSH terms
Substances
LinkOut - more resources
Full Text Sources

