. 2019 Feb 13;21(2):30.
doi: 10.1208/s12248-019-0303-4.

Activation of Protein Kinase A Stimulates SUMOylation, Expression, and Transport Activity of Organic Anion Transporter 3

Affiliations

Activation of Protein Kinase A Stimulates SUMOylation, Expression, and Transport Activity of Organic Anion Transporter 3

Haoxun Wang et al. AAPS J. .

Abstract

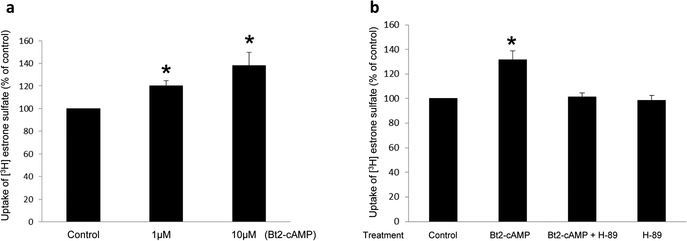
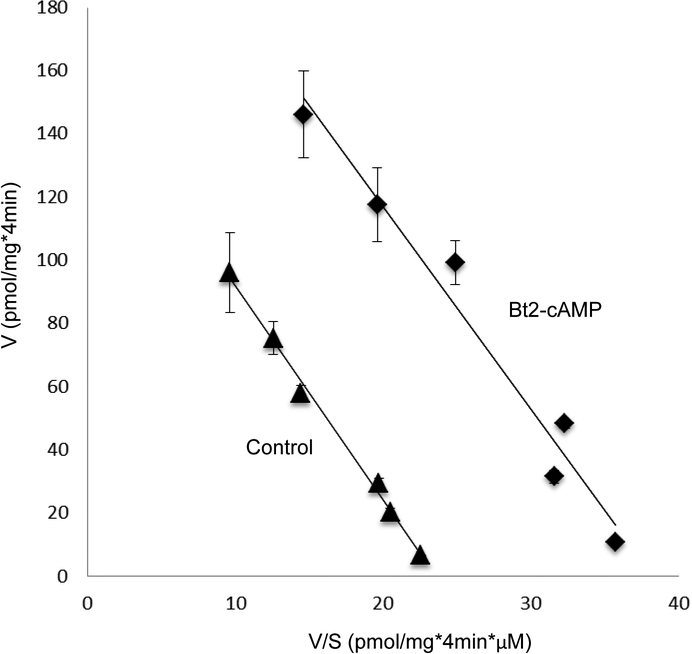
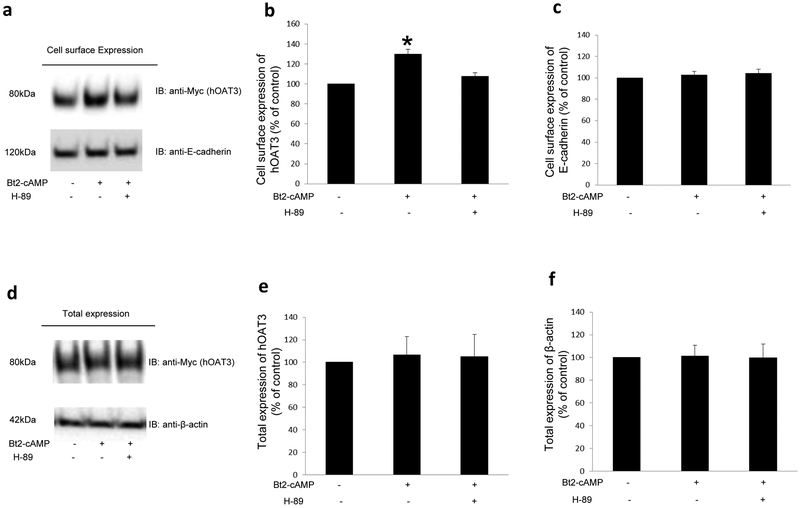
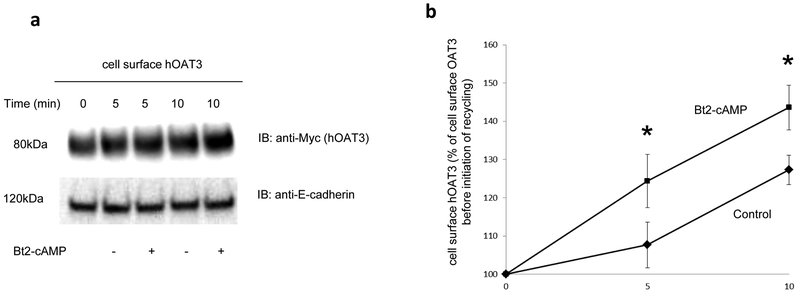
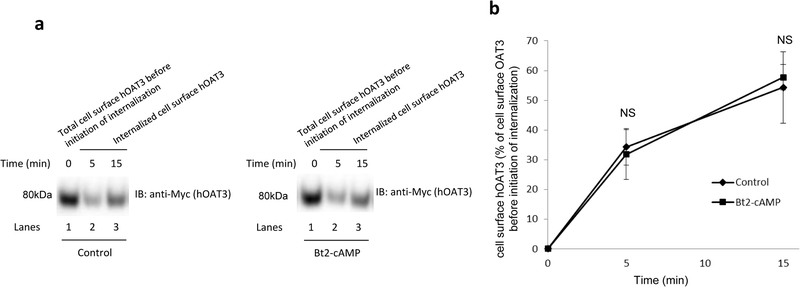
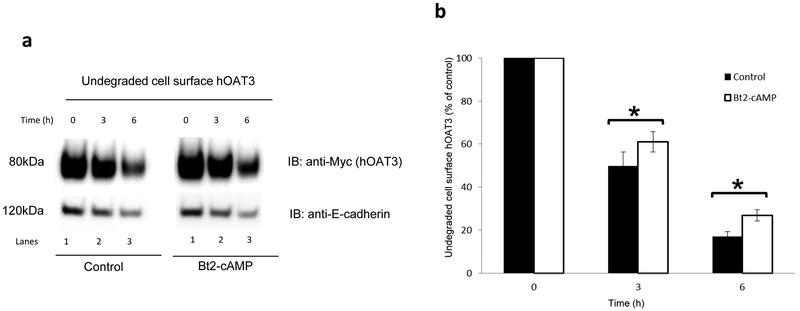
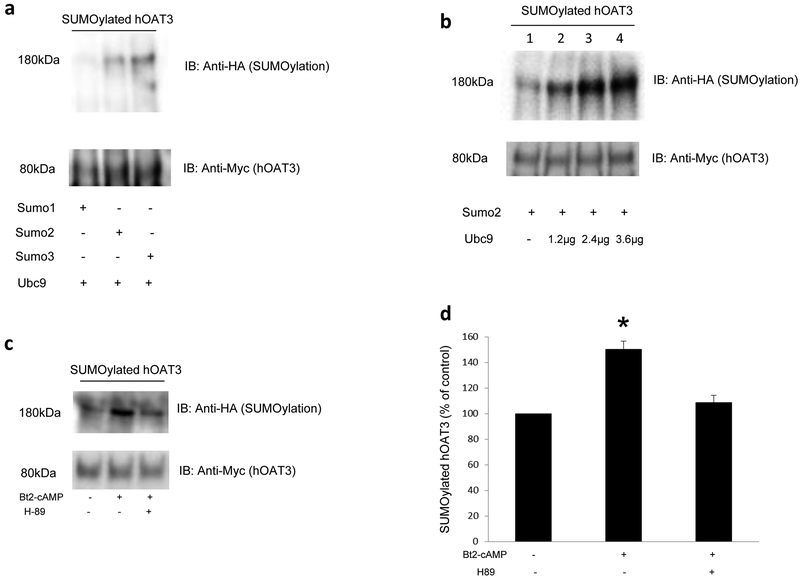
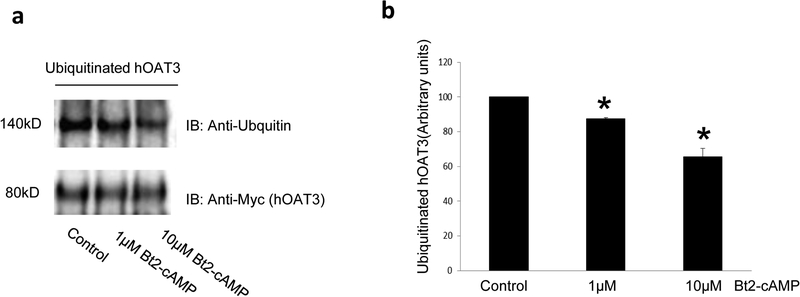
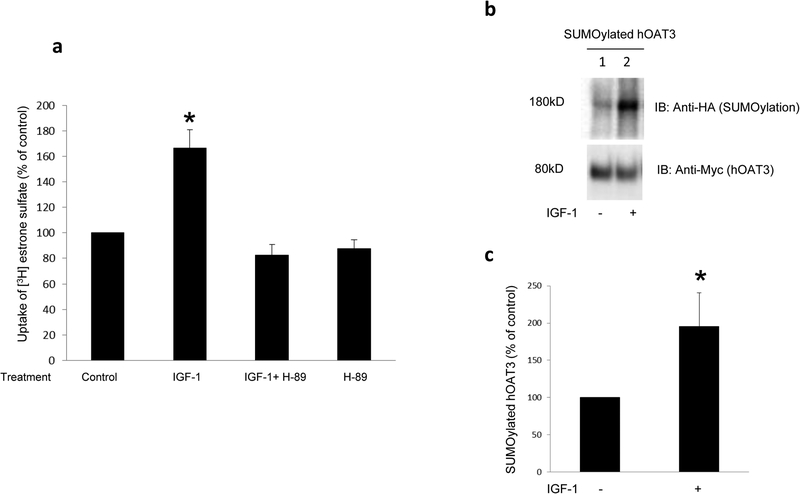
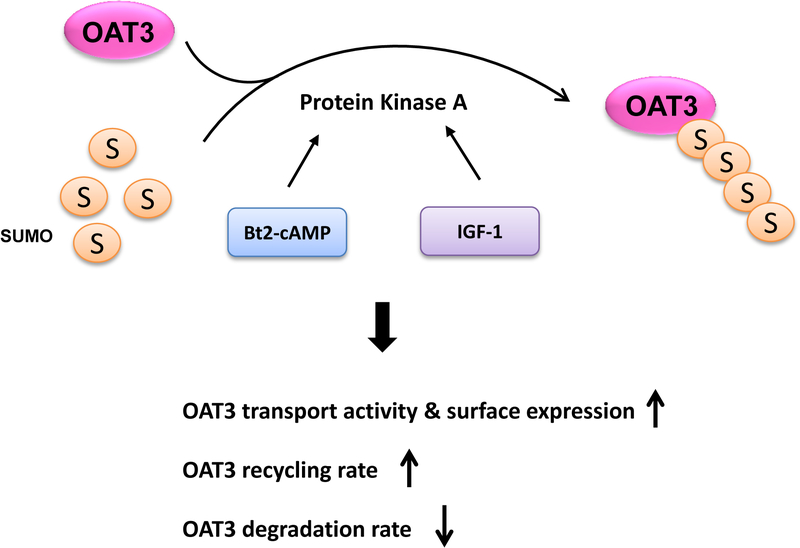
Organic anion transporter 3 (OAT3) plays a vital role in removing a broad variety of anionic drugs from kidney, thus avoiding their possible toxicity in the body. We earlier established that activation of protein kinase C (PKC) enhances OAT3 ubiquitination, which promotes OAT3 internalization from the cell plasma membrane to intracellular endosomes and consequent degradation. As a result, OAT3 expression and transport activity are reduced. In the current study, we discovered that protein kinase A (PKA) had an opposite effect to PKC on the regulation of OAT3. We showed that activation of PKA by Bt2-cAMP stimulated OAT3 transport activity, which was largely caused by an enhanced plasma membrane expression of the transporter, kinetically reflected as an augmented maximal transport velocity Vmax without notable alteration in substrate-binding affinity Km. Additionally, we showed that PKA activation accelerated the rate of OAT3 recycling from intracellular compartments to the plasma membrane and decelerated the rate of OAT3 degradation. We further showed that OAT3 is subjected to post-translational modification by SUMO-2 and SUMO-3 not by SUMO-1. PKA activation enhanced OAT3 SUMOylation, which was accompanied by a reduced OAT3 ubiquitination. Finally, insulin-like growth factor 1 significantly stimulated OAT3 transport activity and SUMOylation through PKA signaling pathway. In conclusion, this is the first demonstration that PKA stimulated OAT3 expression and transport activity by altering the trafficking kinetics of OAT3 possibly through the crosstalk between SUMOylation and ubiquitination. Our studies are consistent with a remote sensing and signaling model for transporters (Wu et al. in Mol Pharmacol. 79(5):795-805, 2011).

Keywords: SUMOylation; drug transport; organic anion transporter; protein kinase A; regulation.


Conflict of interest statement

Conflict of Interest

The authors have declared that there is no conflict of interest

Figures

Fig. 1.
Fig. 1.
(a)Effect of PKA activator Bt2-cAMP on hOAT3 transport activity. hOAT3-expressing cells were treated with Bt2-cAMP at various doses for 30 min. 4-min uptake of [3H]-estrone sulfate (ES, 0.3 μM) was then determined. Transport activity was expressed as % of the uptake in control cells (mock cells). The data correspond to the uptake into hOAT3-expressing cells minus uptake into mock cells and was normalized to protein concentration. Values are mean ± S.D. (n = 3). *P<0.05. (b) Selectivity of PKA on hOAT3 transport activity. hOAT3-expressing cells were pretreated with or without a PKA inhibitor H-89 (4μM, 10min). After that, the cells were treated with PKA activator Bt2-cAMP (10μM, 30min) with or without PKA inhibitor H-89 (4μM, 30min), or H-89 alone, followed by measuring the uptake of [3H] estrone sulfate (ES, 4min, 0.3 μM). Transport activity was expressed as % of the uptake in control cells. The data correspond to the uptake into hOAT3-expressing cells minus uptake into mock cells and was normalized to protein concentration. Values are mean ± S.D. (n = 3). *P<0.05.
Fig. 2.
Fig. 2.. Effect of PKA activator Bt2-cAMP on the kinetics of hOAT3-mediated transport of estrone sulfate
hOAT3-expressing cells were treated with the Bt2-cAMP (10μM, 30min), and initial uptake (4 min) of [3H] estrone sulfate was determined at the concentration of 0.1–10 μM. The data correspond to uptake into hOAT3-expressing cells minus uptake into mock cells. Values are means ± S.D. (n = 3). V, velocity; S, substrate concentration.
Fig. 3.
Fig. 3.. Effect of PKA activator Bt2-cAMP on hOAT3 expression
(a). Cell surface expression of hOAT3. Top panel: hOAT3-expressing cells were pretreated with or without H-89 (4μM, 10min). After that, cells were treated with Bt2-cAMP (10μM, 30min) in the presence and absence of PKA inhibitor H-89 (4μM, 30min). Biotinylation of treated cells was then performed, as described in the section of “Materials and Methods” followed by immunoblotting (IB) with an anti-Myc antibody (hOAT3 was tagged with the Myc epitope to facilitate the immunodetection). Bottom panel: The identical blot as the top panel was re-probed with anti-E-cadherin antibody. E-cadherin is a cell membrane marker protein. (b). Densitometry analyses of results from Fig. 3a, Top panel, along with other experiments. The values are mean ± S.D. (n = 3). *P<0.05. (c) Densitometry analyses of results from Fig. 3a, Bottom panel, along with other experiments. The values are mean ± S.D. (n = 3). (d). Total expression of hOAT3. hOAT3-expressing cells were pretreated with or without H-89 (4μM, 10min). After that, cells were treated with the Bt2-cAMP (10μM, 30min) in the presence and absence of PKA inhibitor H-89 (4μM, 30min). Cells were immunoblotted (IB) with an anti-Myc antibody. (e). Densitometry analyses of results from Fig. 3d, Top panel, along with other experiments. The values are mean ± S.D. (n = 3). (f) Densitometry analyses of results from Fig. 3d, Bottom panel, along with other experiments. The values are mean ± S.D. (n = 3).
Fig. 4.
Fig. 4.. Biotinylation analysis of Bt2-cAMP-modulated hOAT3 recycling
(a). Top panel: hOAT3 recycling (5 min and 10 min) was analyzed as described in the section of “Materials and Methods” in the presence and the absence of Bt2-cAMP (10μM), in conjunction with immunoblotting (IB) using anti-Myc antibody (1:100). hOAT3 was tagged with the Myc epitope to facilitate the immunodecetion. Bottom panel: The identical blot as the top panel was re-probed with anti-E-cadherin antibody. E-cadherin is a cell membrane marker protein. (b) Densitometry analyses of results from Fig. 4a, Top panel along with other experiments. Total biotin-labeled hOAT3 was expressed as % of OAT3 biotinylated at 4 °C. Values are mean ± S.D. (n = 3). *P<0.05.
Fig. 5.
Fig. 5.. Biotinylation analysis of hOAT3 internalization
(a). hOAT3 internalization was examined as described in the section of “Materials and Methods”, in the presence and the absence of Bt2-cAMP (10μM), in conjunction with immunoblotting (IB) using anti-Myc antibody (1:100). (b). Densitometry analyses of results from Fig. 5a along with other experiments. Internalized hOAT3 was expressed as % of total initial cell surface hOAT3 pool. Values are mean ± S.D. (n = 3). NS: statistically not significant.
Fig. 6
Fig. 6. Effect of Bt2-cAMP on the degradation of cell surface hOAT3
(a) Top panel: COS-7 cells expressing hOAT3 were treated with the Bt2-cAMP (10μM). Cell surface hOAT3 degradation was then examined as described in the section of “Materials and Methods”, in conjunction with immunoblotting (IB) using anti-Myc antibody. Bottom panel: The identical blot as the top panel was re-probed with anti-E-cadherin antibody. E-cadherin is a cell membrane marker protein. (b) Densitometry analyses of results from Fig. 6a top panel along with other experiments. The amount of undegraded cell surface hOAT3 was expressed as % of total initial cell surface hOAT3 pool. Values are mean ± S.D. (n = 3). *P<0.05.
Fig. 7.
Fig. 7.
(a) Effects of SUMO1, SUMO2, SUMO3 and Ubc9 on hOAT3 SUMOylation. Top panel: cDNAs for HA-tagged SUMO1, SUMO2, or SUMO3 were transfected into COS-7 cells separately with 2.4μg of Ubc9, a SUMO-conjugating enzyme. 48 hrs after transfection, hOAT3 was pulled down by anti-Myc antibody (hOAT3 was tagged with the Myc epitope), with subsequent immunoblotting (IB) using anti-HA antibody. Bottom panel: The same blot from the top panel was re-probed with anti-Myc antibody to detect the amount of hOAT3 pulled down. (b) Effects of Ubc9 on hOAT3 SUMOylation. Top panel: cDNAs for HA-tagged SUMO2 was transfected into COS-7 cells with different amount of Ubc9 for 48 hrs. After transfection, hOAT3 was pulled down by anti-Myc antibody (hOAT3 was tagged with the Myc epitope), with subsequent immunoblotting (IB) using anti-HA antibody. Bottom panel: The same blot from the top panel was re-probed with anti-Myc antibody to detect the amount of hOAT3 pulled down. (c) PKA Specificity on hOAT3 SUMOylation. Top panel: hOAT3-expressing cells were transfected with HA-SUMO2 and 2.4μg of Ubc9 for 48h, then pretreated with or without H-89 (4μM, 10min). After that, cells were treated with the Bt2-cAMP (10μM, 30min) in the presence and absence of PKA inhibitor H-89 (4μM, 30min). hOAT3 was pulled down by anti-Myc antibody, with subsequent immunoblotting (IB) using anti-HA antibody. Bottom panel: The identical blot from the top panel was re-probed with anti-Myc antibody. (d) Densitometry analyses of results from Fig. 7c. Values are mean ± S.D. (n = 3). *P<0.05.
Fig. 8.
Fig. 8.. The effect of PKA activator Bt2-cAMP on OAT3 ubiquitination
(a). Top panel: hOAT3-expressing cells were treated with the Bt2-cAMP (1μM or 10μM, 30min). Cells were then treated with the PKC activator PMA (1 μM) for 30 min to enhance hOAT3 ubiquitination. hOAT3 was pulled down by anti-Myc antibody (hOAT3 was tagged with the Myc epitope), with subsequent immunoblotting (IB) using anti-ubiquitin antibody. Bottom panel: The identical immunoblot from Fig. 8a, Top panel was reprobed by anti-Myc antibody. (b). Densitometry analyses of results from Fig. 8a. The values are mean ± S.D. (n = 3). *P<0.05.
Fig. 9.
Fig. 9.. The effect of IGF-1 on OAT3 transport activity and SUMOylation
(a) The effect of IGF-1 on hOAT3 transport activity. hOAT3-expressing cells were pretreated with or without a PKA inhibitor H-89 (20μM, 10min). After that, the cells were treated with IGF-1 (100nM, 3hrs) in the presence and absence of PKA inhibitor H-89 (20μM, 3hrs), or H-89 alone, followed by [3H] estrone sulfate uptake (4min, 0.3 μM). Uptake activity was expressed as % of the uptake in control cells. The data correspond to the uptake into hOAT3-expressing cells minus uptake into mock cells and was normalized to protein concentration. Values are mean ± S.D. (n = 3). *P<0.05. (b) The effect of IGF-1 on OAT3 SUMOylation. hOAT3-expressing cells were transfected with HA-SUMO2 and 2.4μg of Ubc9 for 48hrs, then treated with the IGF-1 (100nM, 3hrs). hOAT3 was pulled down by anti-Myc antibody, in conjunction with immunoblotting (IB) using anti-HA antibody. (c) Densitometry analyses of results from Fig. 9b. Values are mean ± S.D. (n = 3). *P<0.05.
Fig. 10.
Fig. 10.
The role of PKA in OAT3 transport activity, trafficking and SUMOylation. S: SUMO, IGF-1: insulin-like growth factor 1

Similar articles

Cited by

References

    1. Structure You G., function, and regulation of renal organic anion transporters. Med Res Rev. 2002;22(6):602–16. doi: 10.1002/med.10019. - DOI - PubMed
    1. Srimaroeng C, Perry JL, Pritchard JB. Physiology, structure, and regulation of the cloned organic anion transporters. Xenobiotica. 2008;38(7–8):889–935. doi: 10.1080/00498250801927435. - DOI - PMC - PubMed
    1. Dantzler WH, Wright SH. The molecular and cellular physiology of basolateral organic anion transport in mammalian renal tubules. Biochim Biophys Acta. 2003;1618(2):185–93. - PubMed
    1. VanWert AL, Gionfriddo MR, Sweet DH. Organic anion transporters: discovery, pharmacology, regulation and roles in pathophysiology. Biopharm Drug Dispos. 2010;31(1):1–71. doi: 10.1002/bdd.693. - DOI - PubMed
    1. Ahn SY, Nigam SK. Toward a systems level understanding of organic anion and other multispecific drug transporters: a remote sensing and signaling hypothesis. Mol Pharmacol. 2009;76(3):481–90. doi: 10.1124/mol.109.056564. - DOI - PMC - PubMed

Publication types

MeSH terms

Substances