

Goal-directed unequal attention allocation during multiple object tracking
- PMID: 30761503
- PMCID: PMC6647460
- DOI: 10.3758/s13414-019-01674-y
Goal-directed unequal attention allocation during multiple object tracking
Abstract
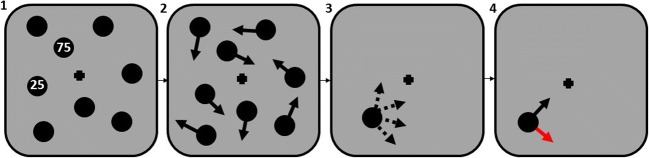
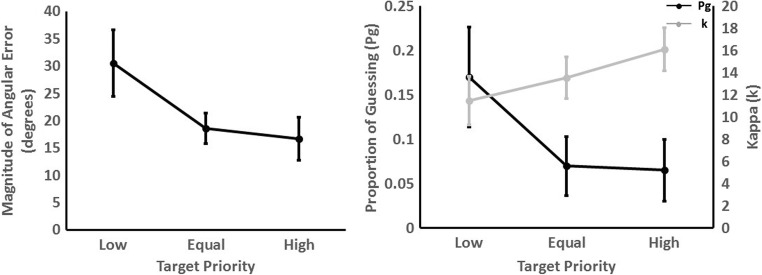
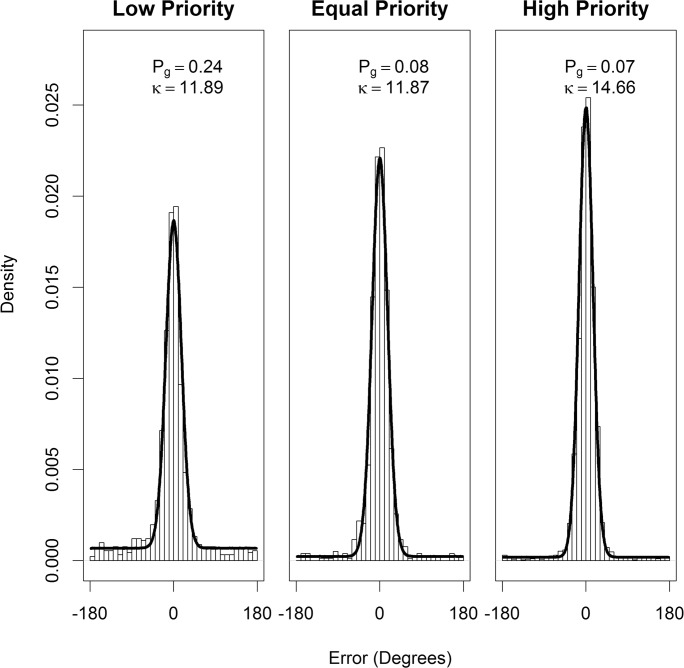
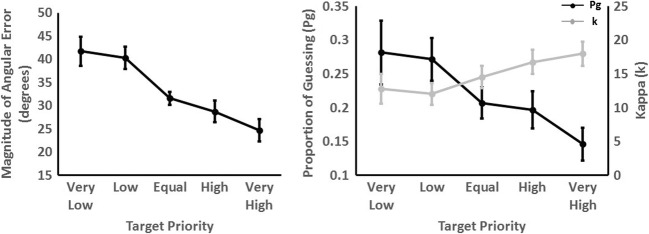
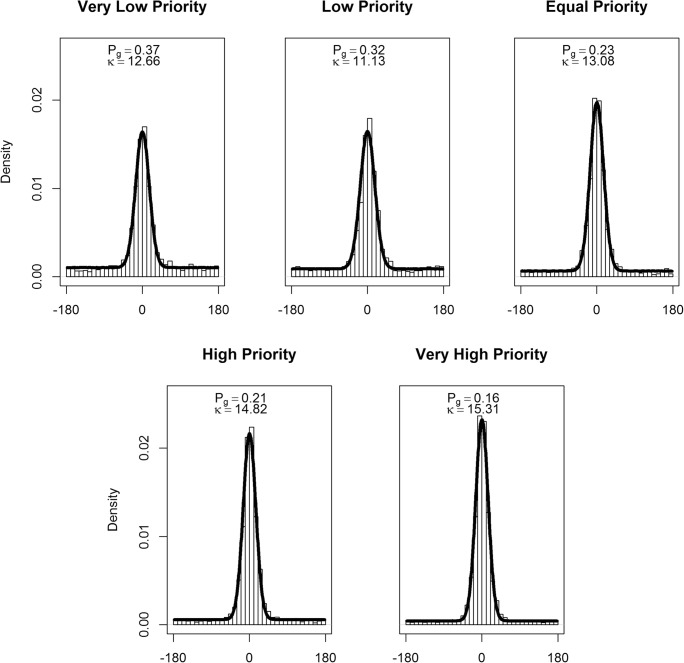
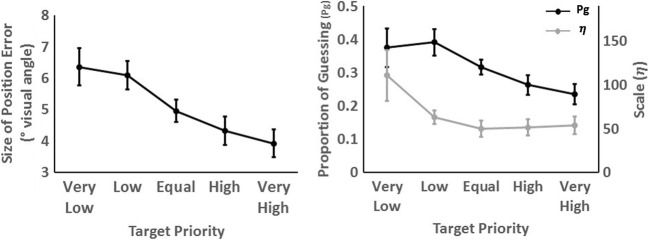
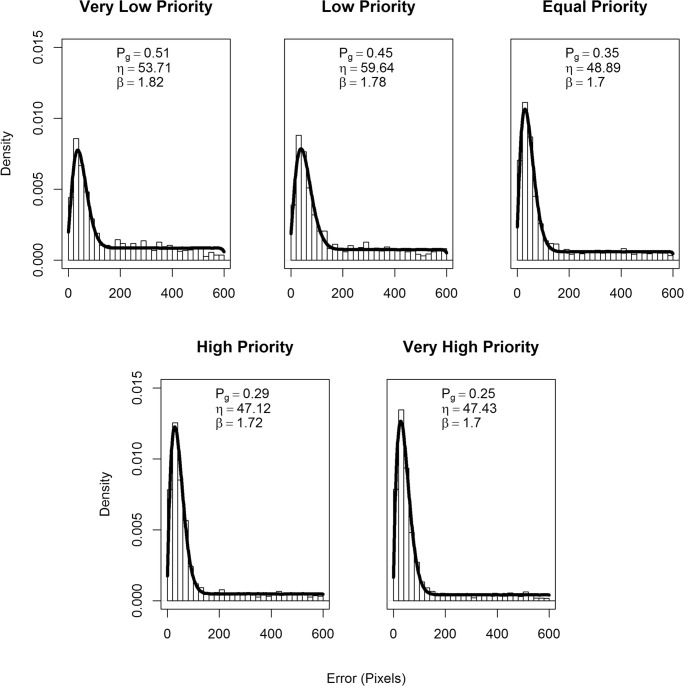
In standard multiple object tracking (MOT) tasks the relative importance of the targets being tracked is equal. This is atypical of everyday situations in which an individual may need to prioritize one target relative to another and so allocate attention unequally. We report three experiments that examined whether participants could unequally split attention using a modified MOT task in which target priority was manipulated. Specifically, we examined the effect of priority on participants' magnitude of error and used a distribution mixture analysis to investigate how priority affected both participants' probability of losing an item and tracking precision. Experiment 1 (trajectory tracking) revealed a higher magnitude of error and higher proportion of guessing for low- compared with high-priority targets. Experiments 2 (trajectory tracking) and 3 (position tracking) examined how fine-grained this ability is by manipulating target priority at finer increments. In line with Experiment 1, results from both these experiments indicated that participants could split attention unequally. There was some evidence that participants could allocate attention unequally at fine increments, but this was less conclusive. Taken together, these experiments demonstrate participants' ability to distribute attention unequally across multiple moving objects but suggest some limitation with the flexibility of attention allocation.
Keywords: Attention; Goal-directed; Multiple object tracking; Target priority; Unequal attention splitting.
Figures
Similar articles
-
Unequal allocation of overt and covert attention in Multiple Object Tracking.Atten Percept Psychophys. 2022 Jul;84(5):1519-1537. doi: 10.3758/s13414-022-02501-7. Epub 2022 May 13. Atten Percept Psychophys. 2022. PMID: 35562630 Free PMC article.
-
All eyes on relevance: strategic allocation of attention as a result of feature-based task demands in multiple object tracking.Atten Percept Psychophys. 2016 Oct;78(7):2090-109. doi: 10.3758/s13414-016-1129-0. Atten Percept Psychophys. 2016. PMID: 27276889
-
Position representations lag behind targets in multiple object tracking.Vision Res. 2011 Sep 1;51(17):1907-19. doi: 10.1016/j.visres.2011.07.001. Epub 2011 Jul 6. Vision Res. 2011. PMID: 21762715
-
Evaluating the Influence of Visual Attentional Tracking on Pointing Movement Precision.J Mot Behav. 2022;54(2):237-255. doi: 10.1080/00222895.2021.1944972. Epub 2021 Jul 12. J Mot Behav. 2022. PMID: 34251999
-
Selecting and tracking multiple objects.Wiley Interdiscip Rev Cogn Sci. 2015 Mar-Apr;6(2):109-118. doi: 10.1002/wcs.1328. Epub 2014 Dec 15. Wiley Interdiscip Rev Cogn Sci. 2015. PMID: 26263067 Review.
Cited by
-
Motion disrupts dynamic visual search for an orientation change.Cogn Res Princ Implic. 2021 Jun 26;6(1):47. doi: 10.1186/s41235-021-00312-2. Cogn Res Princ Implic. 2021. PMID: 34175977 Free PMC article.
-
Retrieval-induced forgetting of spatial position depends on access to multiple shared features within categories.Mem Cognit. 2023 Jul;51(5):1090-1102. doi: 10.3758/s13421-022-01384-1. Epub 2023 Jan 9. Mem Cognit. 2023. PMID: 36622504 Free PMC article.
-
Unequal allocation of overt and covert attention in Multiple Object Tracking.Atten Percept Psychophys. 2022 Jul;84(5):1519-1537. doi: 10.3758/s13414-022-02501-7. Epub 2022 May 13. Atten Percept Psychophys. 2022. PMID: 35562630 Free PMC article.
-
Effectiveness of "rescue saccades" on the accuracy of tracking multiple moving targets: An eye-tracking study on the effects of target occlusions.J Vis. 2020 Nov 2;20(12):5. doi: 10.1167/jov.20.12.5. J Vis. 2020. PMID: 33196768 Free PMC article.
-
Examining the roles of working memory and visual attention in multiple object tracking expertise.Cogn Process. 2020 May;21(2):209-222. doi: 10.1007/s10339-020-00954-y. Epub 2020 Feb 3. Cogn Process. 2020. PMID: 32016685 Free PMC article.
References
-
- Agostinelli, C. & Lund, U. (2017). R package 'circular': Circular Statistics (version 0.4-93). https://r-forge.r-project.org/projects/circular/
-
- Alvarez GA, Cavanagh P. The capacity of visual short-term memory is set both by visual information load and by number of objects. Psychological Science. 2004;15:106–111. - PubMed
-
- Alvarez GA, Franconeri S, L. How many objects can you track? Evidence for a resource-limited attentive tracking mechanism. Journal of Vision. 2007;7:1–10. - PubMed
-
- Awh E, Barton B, Vogel EK. Visual working memory represents a fixed number of items regardless of complexity. Psychological science. 2007;18:622–628. - PubMed
MeSH terms
Grants and funding
LinkOut - more resources
Full Text Sources
