

Highly-expressed P2X7 receptor promotes growth and metastasis of human HOS/MNNG osteosarcoma cells via PI3K/Akt/GSK3β/β-catenin and mTOR/HIF1α/VEGF signaling
- PMID: 30761524
- PMCID: PMC6618011
- DOI: 10.1002/ijc.32207
Highly-expressed P2X7 receptor promotes growth and metastasis of human HOS/MNNG osteosarcoma cells via PI3K/Akt/GSK3β/β-catenin and mTOR/HIF1α/VEGF signaling
Abstract
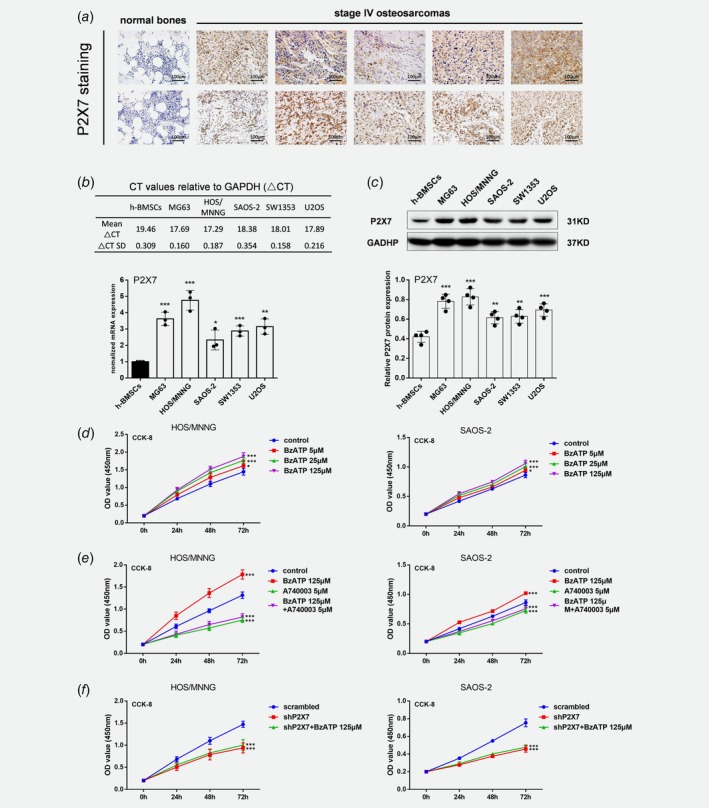
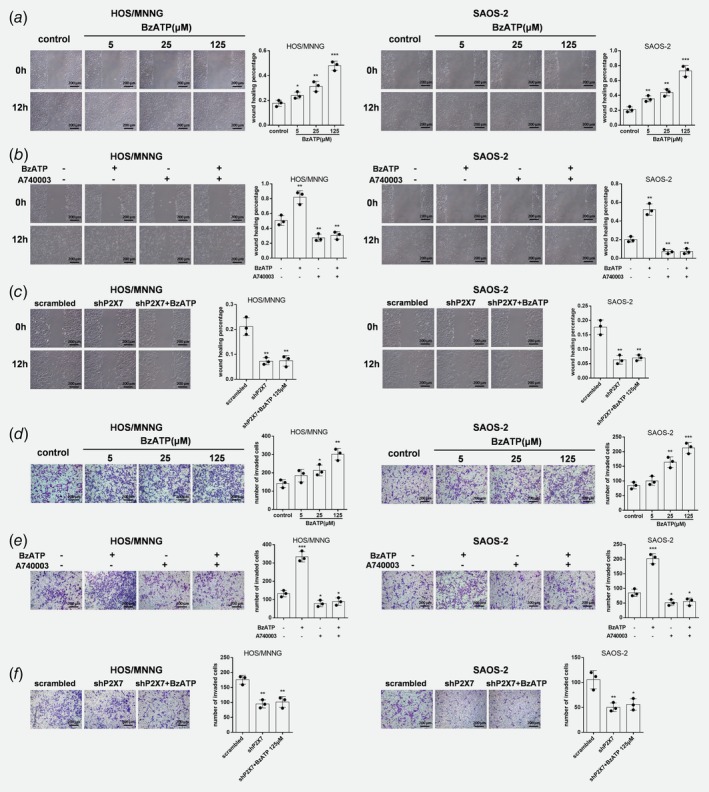
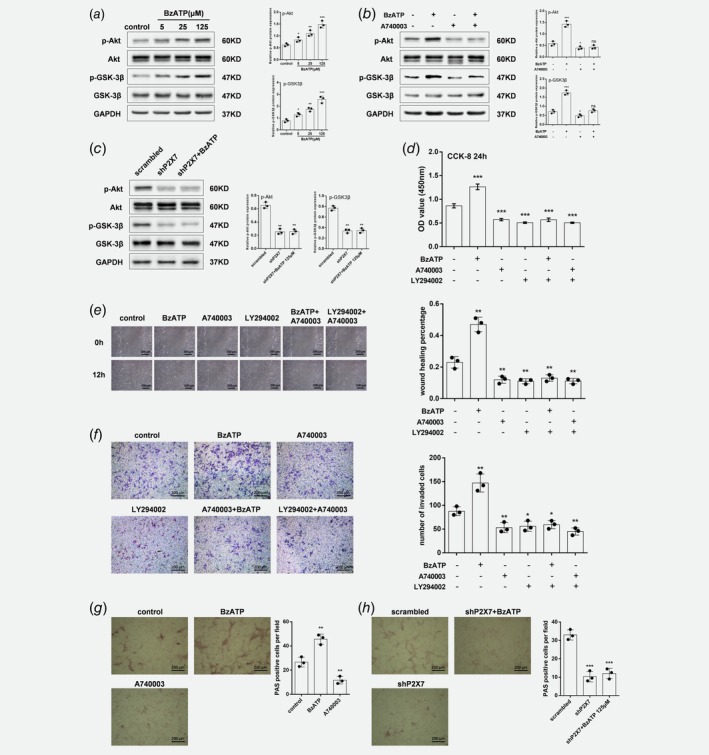
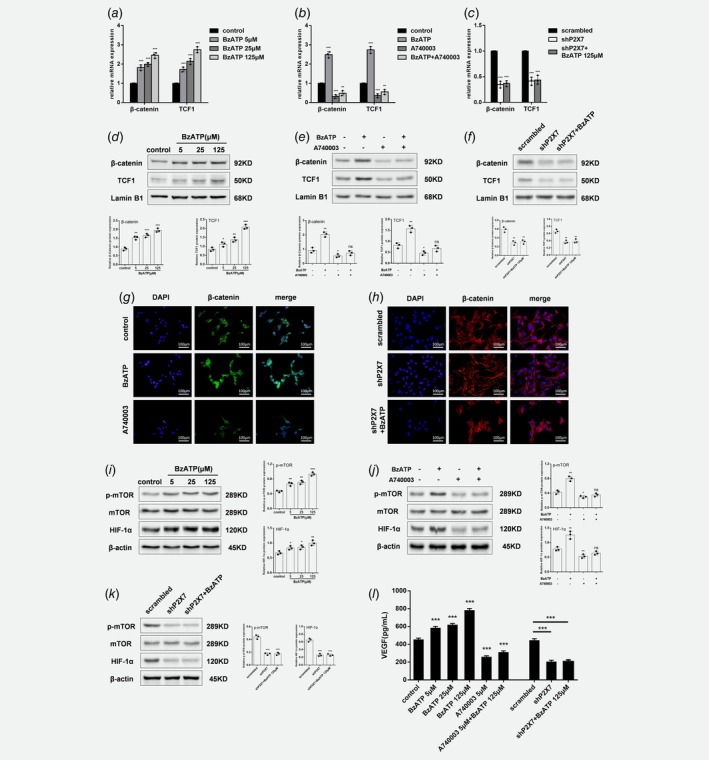
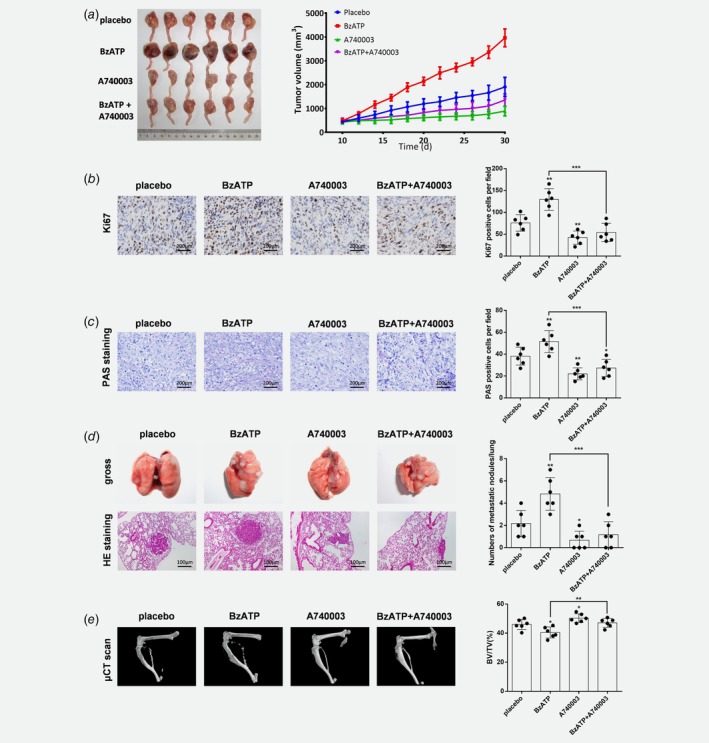
The P2X7 receptor, an ATP-gated ion channel, is critical for cancer cell growth, invasiveness, and angiogenesis. Previous studies indicate that P2X7 regulates osteoblast proliferation and osteodeposition and that high P2X7 expression has a pro-growth effect in osteosarcoma. However, how it functions in osteosarcoma cell growth and metastasis is not clear. Thus, we elucidated molecular mechanisms of P2X7-dependent positive regulation of osteosarcoma cell proliferation, invasion, migration, epithelial to mesenchymal transition (EMT), and angiogenesis using in vitro and in vivo models. We confirm that P2X7 is highly-expressed in human osteosarcoma tumor tissues and HOS/MNNG, MG63, U2OS, SW1353 and SAOS-2 cell lines. P2X7 receptor stimulation enhanced HOS/MNNG and SAOS-2 cell proliferation, migration and invasion; but knockdown of P2X7 expression or receptor inhibition had opposite effects. P2X7 positively regulated glycogen content, epithelial to mesenchymal transition and stemness of HOS/MNNG cells. P2X7 activation promoted PI3K/Akt/GSK3β/β-catenin and mTOR/HIF1α/VEGF signaling, thereby mediating pro-tumor effects of osteosarcoma cells. Consistent with data from in vitro experiments, systemic administration of P2X7 agonist induced tumor growth, metastasis and tumor-associated bone destruction in osteosarcoma-bearing nude mice, whereas a P2X7 antagonist reversed these effects. Thus, the P2X7 receptor participates in regulation of osteosarcoma growth and metastasis and we offer evidence that P2X7 may be a promising therapeutic target for treating osteosarcoma.
Keywords: P2X7 receptor; PI3K/Akt signaling pathway; angiogenesis; epithelial to mesenchymal transition; osteosarcoma.
© 2019 The Authors. International Journal of Cancer published by John Wiley & Sons Ltd on behalf of UICC.
Figures

Similar articles
-
LINC00968 functions as an oncogene in osteosarcoma by activating the PI3K/AKT/mTOR signaling.J Cell Physiol. 2018 Nov;233(11):8639-8647. doi: 10.1002/jcp.26624. Epub 2018 Jun 15. J Cell Physiol. 2018. PMID: 29904919
-
AIM2 inhibits the proliferation, invasion and migration, and promotes the apoptosis of osteosarcoma cells by inactivating the PI3K/AKT/mTOR signaling pathway.Mol Med Rep. 2022 Feb;25(2):53. doi: 10.3892/mmr.2021.12569. Epub 2021 Dec 16. Mol Med Rep. 2022. PMID: 34913077 Free PMC article.
-
TGF-β is associated with poor prognosis and promotes osteosarcoma progression via PI3K/Akt pathway activation.Cell Cycle. 2020 Sep;19(18):2327-2339. doi: 10.1080/15384101.2020.1805552. Epub 2020 Aug 17. Cell Cycle. 2020. Retraction in: Cell Cycle. 2022 Apr;21(8):879. doi: 10.1080/15384101.2022.2046822. PMID: 32804027 Free PMC article. Retracted.
-
Wnt and PI3K/Akt/mTOR Survival Pathways as Therapeutic Targets in Glioblastoma.Int J Mol Sci. 2022 Jan 25;23(3):1353. doi: 10.3390/ijms23031353. Int J Mol Sci. 2022. PMID: 35163279 Free PMC article. Review.
-
ATP-gated P2X7 receptor as a potential target for prostate cancer.Hum Cell. 2022 Sep;35(5):1346-1354. doi: 10.1007/s13577-022-00729-x. Epub 2022 Jun 3. Hum Cell. 2022. PMID: 35657562 Review.
Cited by
-
Antifibrotic effect of the P2X7 receptor antagonist A740003 against acute myocardial infarction-induced fibrotic remodelling.Saudi Pharm J. 2024 Jul;32(7):102102. doi: 10.1016/j.jsps.2024.102102. Epub 2024 May 16. Saudi Pharm J. 2024. PMID: 39035363 Free PMC article.
-
PI3K/AKT/mTOR pathway and its related molecules participate in PROK1 silence-induced anti-tumor effects on pancreatic cancer.Open Life Sci. 2023 Apr 10;18(1):20220538. doi: 10.1515/biol-2022-0538. eCollection 2023. Open Life Sci. 2023. PMID: 37070074 Free PMC article.
-
Effect of P2X purinergic receptors in tumor progression and as a potential target for anti-tumor therapy.Purinergic Signal. 2021 Mar;17(1):151-162. doi: 10.1007/s11302-020-09761-8. Epub 2021 Jan 9. Purinergic Signal. 2021. PMID: 33420658 Free PMC article. Review.
-
Dihydrotanshinone, a Natural Diterpenoid, Preserves Blood-Retinal Barrier Integrity via P2X7 Receptor.Int J Mol Sci. 2020 Dec 6;21(23):9305. doi: 10.3390/ijms21239305. Int J Mol Sci. 2020. PMID: 33291318 Free PMC article.
-
Downregulation of miRNA‑328 promotes the angiogenesis of HUVECs by regulating the PIM1 and AKT/mTOR signaling pathway under high glucose and low serum condition.Mol Med Rep. 2020 Aug;22(2):895-905. doi: 10.3892/mmr.2020.11141. Epub 2020 May 12. Mol Med Rep. 2020. PMID: 32626978 Free PMC article.
References
-
- Hayden JB, Hoang BH. Osteosarcoma: basic science and clinical implications. Orthop Clin North Am 2006;37:1–7. - PubMed
-
- Bielack SS, Kempf‐Bielack B, Delling G, et al. Prognostic factors in high‐grade osteosarcoma of the extremities or trunk: an analysis of 1,702 patients treated on neoadjuvant cooperative osteosarcoma study group protocols. J Clin Oncol 2002;20:776–90. - PubMed
-
- Chou AJ, Geller DS, Gorlick R. Therapy for osteosarcoma: where do we go from here? Paediatr Drugs 2008;10:315–27. - PubMed
-
- Link MP, Goorin AM, Miser AW, et al. The effect of adjuvant chemotherapy on relapse‐free survival in patients with osteosarcoma of the extremity. N Engl J Med 1986;314:1600–6. - PubMed
Publication types
MeSH terms
Substances
LinkOut - more resources
Full Text Sources
Medical
Molecular Biology Databases
Miscellaneous
