. 2019 May;46(5):2477-2486.
doi: 10.1002/mp.13446. Epub 2019 Mar 12.

Technical Note: Simplified and practical pretherapy tumor dosimetry - A feasibility study for 131 I-MIBG therapy of neuroblastoma using 124 I-MIBG PET/CT

Affiliations

Technical Note: Simplified and practical pretherapy tumor dosimetry - A feasibility study for 131 I-MIBG therapy of neuroblastoma using 124 I-MIBG PET/CT

Youngho Seo et al. Med Phys. 2019 May.

Abstract

Purpose: Radiation dose calculated on tumors for radiopharmaceutical therapy varies significantly from tumor to tumor and from patient to patient. Accurate estimation of radiation dose requires multiple time point measurements using radionuclide imaging modalities such as SPECT or PET. In this report, we show our technical development of reducing the number of scans needed for reasonable estimation of tumor and normal organ dose in our pretherapy imaging and dosimetry platform of 124 I-metaiodobenzylguanidine (MIBG) positron emission tomography/computed tomography (PET/CT) for 131 I-MIBG therapy of neuroblastoma.

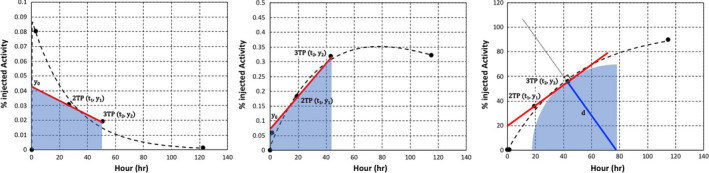
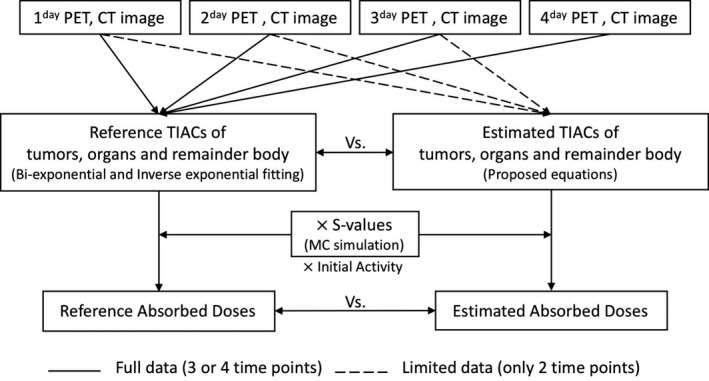
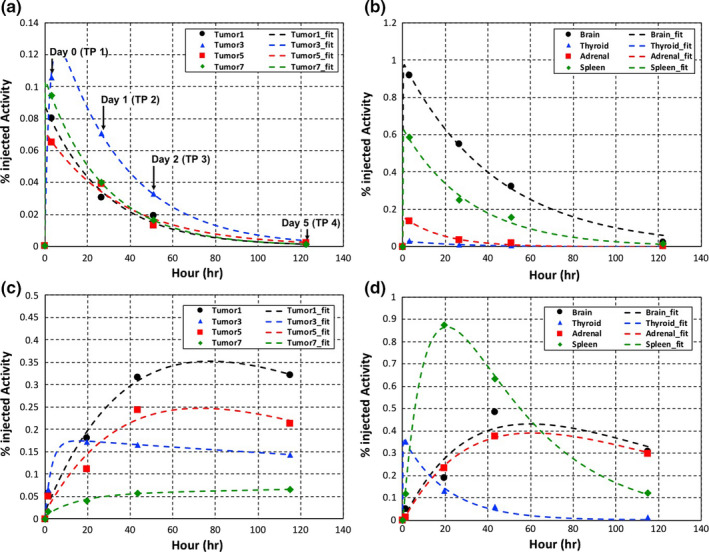
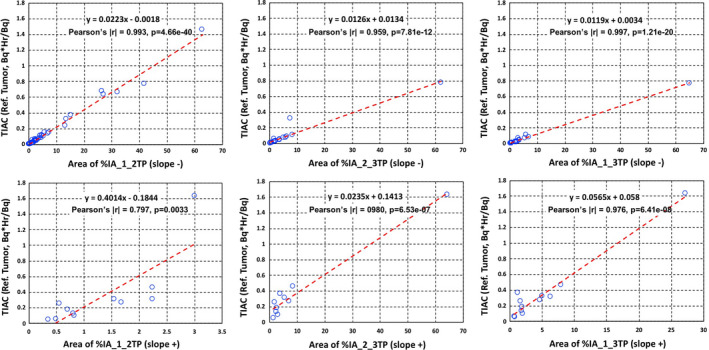
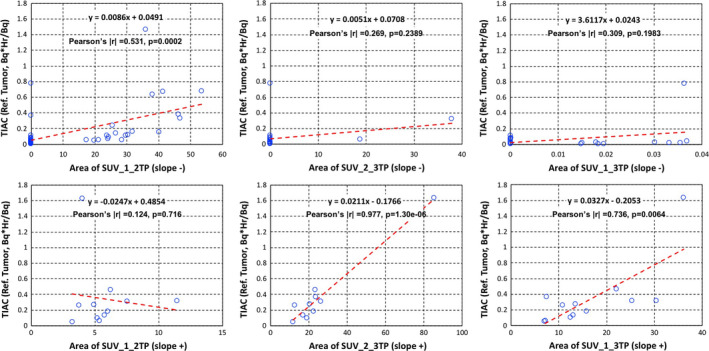
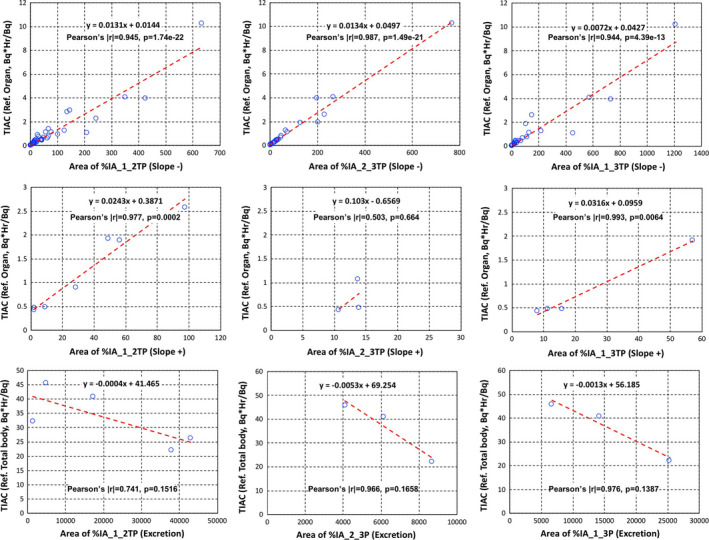
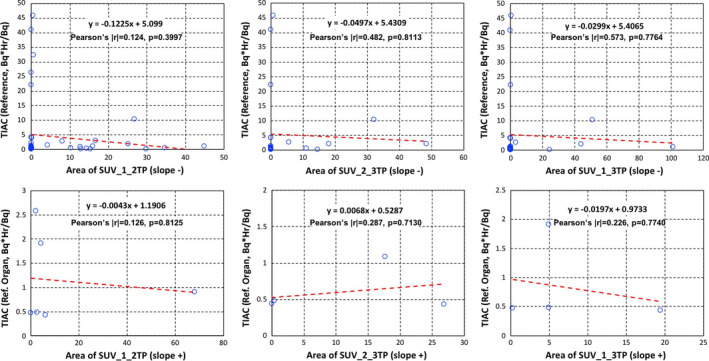
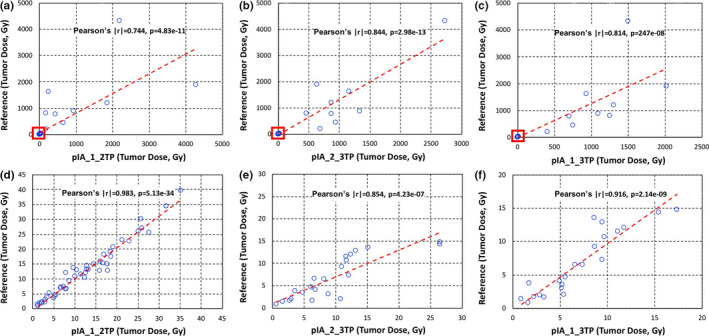
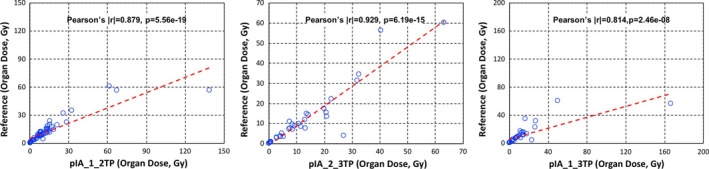
Methods: We analyzed the simplest kinetic data, areas of two-time point data for five patients with neuroblastoma who underwent 3 or 4 times of 124 I-MIBG PET/CT scan prior to 131 I-MIBG therapy. The data for which we derived areas were percent of injected activity (%IA) and standardized uptake value of tumors. These areas were correlated with time-integrated activity coefficients (TIACs) from full data (3 or 4 time points). TIACs are direct correlates with radiation dose as long as the volume and the radionuclide are known.

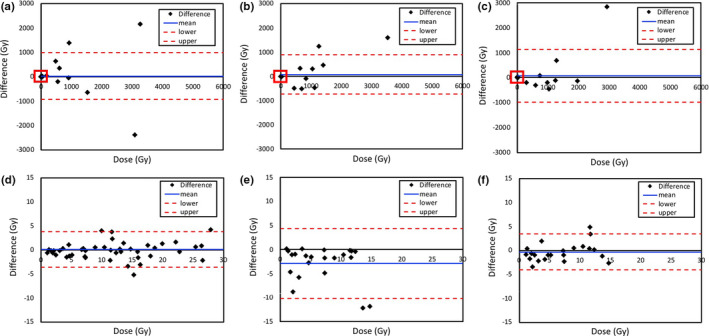
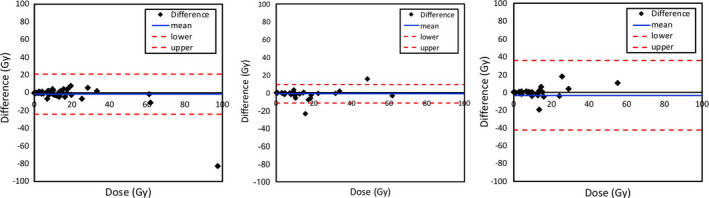
Results: The areas of %IAs between data obtained from all the two-time points with time points 1 and 2 (day 0 and day 1), time points 2 and 3 (day 1 and day 2), and time points 1 and 3 (day 0 and day 2) showed reasonable correlation (Pearson's correlation coefficient |r| > 0.5) with not only tumor and organ TIACs but also tumor and organ absorbed doses. The tumor and organ doses calculated using %IA areas of time point 1 and time point 2 were our best fits at about 20% individual percent difference compared to doses calculated using 3 or 4 time points.

Conclusions: We could achieve reasonable accuracy of estimating tumor doses for subsequent radiopharmaceutical therapy using only the two-time point imaging sessions. Images obtained from these time points (within the 48-h after administration of radiopharmaceutical) were also viewed as useful for diagnostic reading. Although our analysis was specific to 124 I-MIBG PET/CT pretherapy imaging data for 131 I-MIBG therapy of neuroblastoma and the number of imaging datasets was not large, this feasible methodology would generally be applicable to other imaging and therapeutic radionuclides with an appropriate data analysis similar to our analysis to other imaging and therapeutic radiopharmaceuticals.

Keywords: MIBG; dosimetry; neuroblastoma; radionuclide therapy; tumor dosimetry.


Conflict of interest statement

The authors have no conflict to disclose.

Figures

Figure 1
Figure 1
Examples of the calculation of the area under the two‐time points (2 and 3) at slope− (a), slope+ (b), and slope+ of excretion for calculating the time‐integrated activity coefficients of the remainder of the body (c). Note the different y scales. [Color figure can be viewed at wileyonlinelibrary.com]
Figure 2
Figure 2
Absorbed dose calculation flowchart of tumors and organs using reference or estimated time‐integrated activity coefficients and S‐values for comparing between them.
Figure 3
Figure 3
Time–activity curves and biexponential fits for tumors (a, c) and organs (b, d) from two representative patients (upper and bottom). The bottom patient has time–activity curves with slope+ between two time points for percent of injected activities. [Color figure can be viewed at wileyonlinelibrary.com]
Figure 4
Figure 4
Time‐integrated activity coefficients (Bq·hr/Bq) vs areas of percent of injected activities (%IAs) slope− (upper) and slope+ (bottom) in tumors with: %IA areas between time point 1 and time point 2 (left column), %IA areas between time point 2 and time point 3 (middle column), and (c) %IA areas between time point 1 and time point 3 (right column). Both the linear equation from least squares fits and the Pearson's coefficient values are shown on each plot. [Color figure can be viewed at wileyonlinelibrary.com]
Figure 5
Figure 5
Time‐integrated activity coefficients (Bq·hr/Bq) vs areas of standardized uptake values (SUVs) slope− (upper) and slope+ (bottom) in tumors with: SUV areas between time point 1 and time point 2 (left column), SUV areas between time point 2 and time point 3 (middle column), and (c) SUV areas between time point 1 and time point 3 (right column). Both the linear equation from least squares fits and the Pearson's coefficient values are shown on each plot. [Color figure can be viewed at wileyonlinelibrary.com]
Figure 6
Figure 6
Time‐integrated activity coefficients (Bq·hr/Bq) vs areas of percent of injected activities (%IAs) slope− (upper), slope+ (middle) for organs, and slope+ of excretion (bottom). %IA areas between time point 1 and time point 2 (left column), %IA areas between time point 2 and time point 3 (middle column), and %IA areas between time point 1 and time point 3 (right column). Both the linear equation from least squares fits and the Pearson's coefficient values are shown on each plot. [Color figure can be viewed at wileyonlinelibrary.com]
Figure 7
Figure 7
Time‐integrated activity coefficients (Bq·hr/Bq) vs areas of standardized uptake values (SUVs) slope− (upper), slope+ (middle) for organs. SUV areas between time point 1 and time point 2 (left column), SUV areas between time point 2 and time point 3 (middle column), and SUV areas between time point 1 and time point 3 (right column). Both the linear equation from least squares fits and the Pearson's coefficient values are shown on each plot. [Color figure can be viewed at wileyonlinelibrary.com]
Figure 8
Figure 8
Difference in calculated doses between reference tumor doses using the 3 or 4 time points and tumor doses calculated using the two‐time points with percent of injected activities (%IAs) 1_2TP (a, d), %IAs 2_3TP (b, e), and %IAs 1_3TP (c, f). The enlarged portions of plots (d, e, f) from the red box in the upper plots (a, b, c) show the difference in calculated doses under 100 Gy. [Color figure can be viewed at wileyonlinelibrary.com]
Figure 9
Figure 9
Reference tumor dose (Gy) vs tumor doses calculated using the two‐time points (Gy) with percent of injected activities areas between time point 1 and time point 2 (a, d), time point 2 and time point 3 (b, e), and time point 1 and time point 3 (c, f). The enlarged portions of plots (d, e, f) from the red box in the upper plots (a, b, c) show the difference in calculated doses under 100 Gy. [Color figure can be viewed at wileyonlinelibrary.com]
Figure 10
Figure 10
Difference in calculated doses between reference organ doses using the 3 or 4 time points and organ doses calculated using the two‐time points with percent of injected activities (%IAs) 1_2TP (left), %IAs 2_3TP (middle) and %IAs 1_3TP (right). [Color figure can be viewed at wileyonlinelibrary.com]
Figure 11
Figure 11
Reference organ doses (Gy) vs organ doses calculated using the two‐time points (Gy) with percent of injected activity areas between time point 1 and time point 2 (left), time point 2 and time point 3 (middle), and time point 1 and time point 3 (right). [Color figure can be viewed at wileyonlinelibrary.com]

References

    1. Matthay KK, Panina C, Huberty J, et al. Correlation of tumor and whole‐body dosimetry with tumor response and toxicity in refractory neuroblastoma treated with (131)I‐MIBG. J Nucl Med. 2001;42:1713–1721. - PubMed
    1. Huang SY, Bolch WE, Lee C, et al. Patient‐specific dosimetry using pretherapy [(1)(2)(4)I]m‐iodobenzylguanidine ([(1)(2)(4)I]mIBG) dynamic PET/CT imaging before [(1)(3)(1)I]mIBG targeted radionuclide therapy for neuroblastoma. Mol Imaging Biol. 2015;17:284–294. - PMC - PubMed
    1. Seo Y, Gustafson WC, Dannoon SF, et al. Tumor dosimetry using [124I]m‐iodobenzylguanidine microPET/CT for [131I]m‐iodobenzylguanidine treatment of neuroblastoma in a murine xenograft model. Mol Imaging Biol. 2012;14:735–742. - PMC - PubMed
    1. Sgouros G, Kolbert KS, Sheikh A, et al. Patient‐specific dosimetry for 131I thyroid cancer therapy using 124I PET and 3‐dimensional‐internal dosimetry (3D‐ID) software. J Nucl Med. 2004;45:1366–1372. - PubMed
    1. Sgouros G, Squeri S, Ballangrud AM, et al. Patient‐specific, 3‐dimensional dosimetry in non‐Hodgkin's lymphoma patients treated with 131I‐anti‐B1 antibody: assessment of tumor dose‐response. J Nucl Med. 2003;44:260–268. - PubMed