. 2019 Jun;25(6):1982-1994.
doi: 10.1111/gcb.14592. Epub 2019 Mar 22.

Spatial and habitat variation in aphid, butterfly, moth and bird phenologies over the last half century

Affiliations

Spatial and habitat variation in aphid, butterfly, moth and bird phenologies over the last half century

James R Bell et al. Glob Chang Biol. 2019 Jun.

Abstract

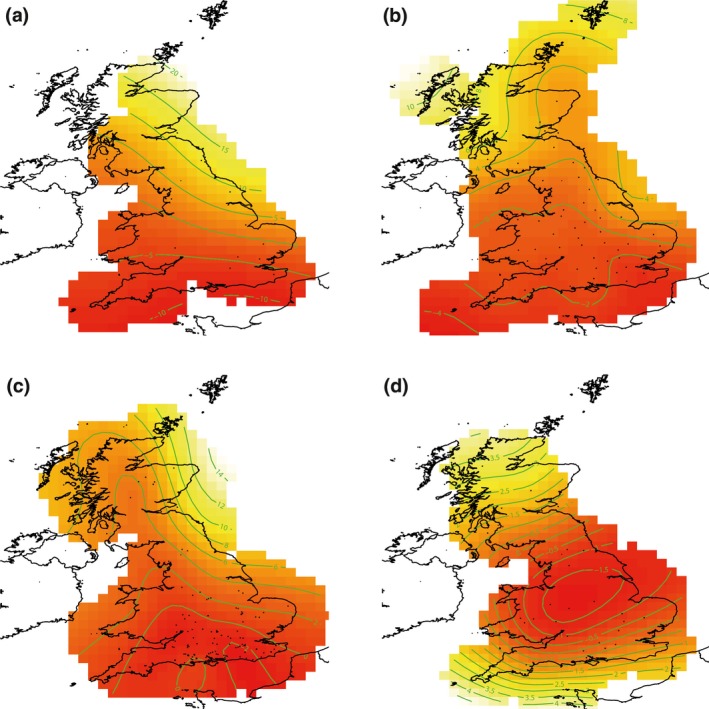
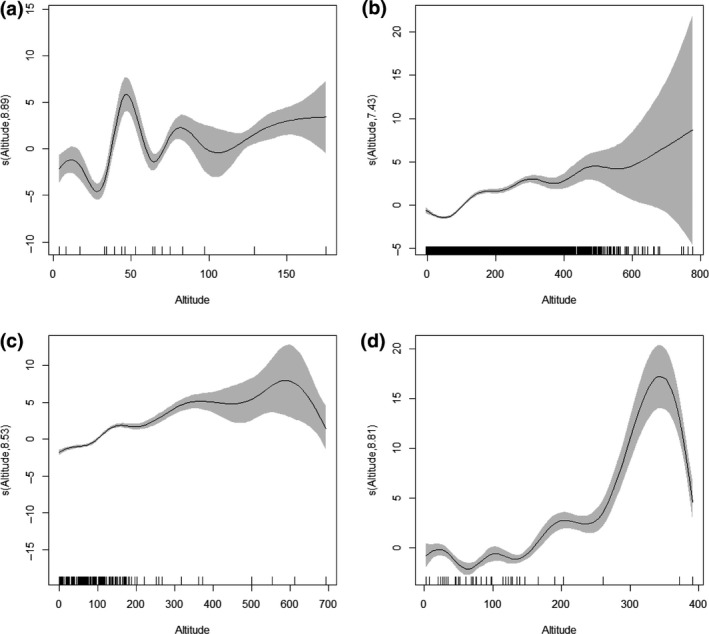
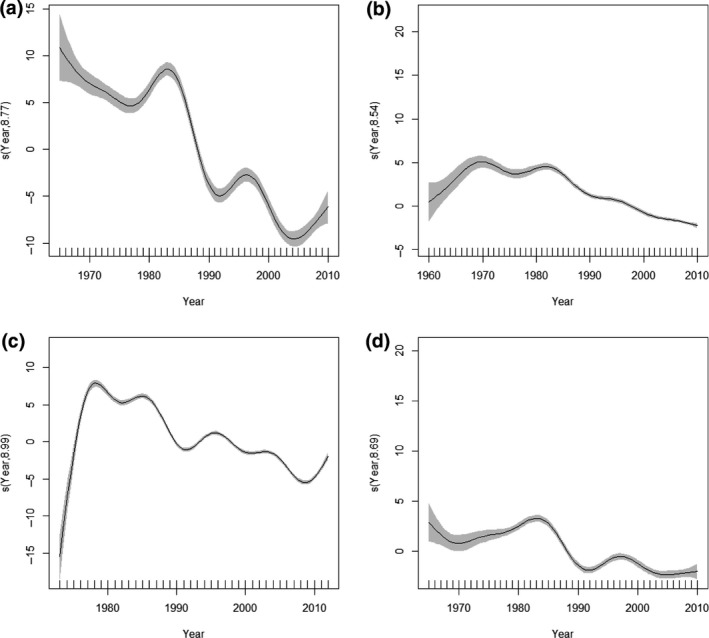
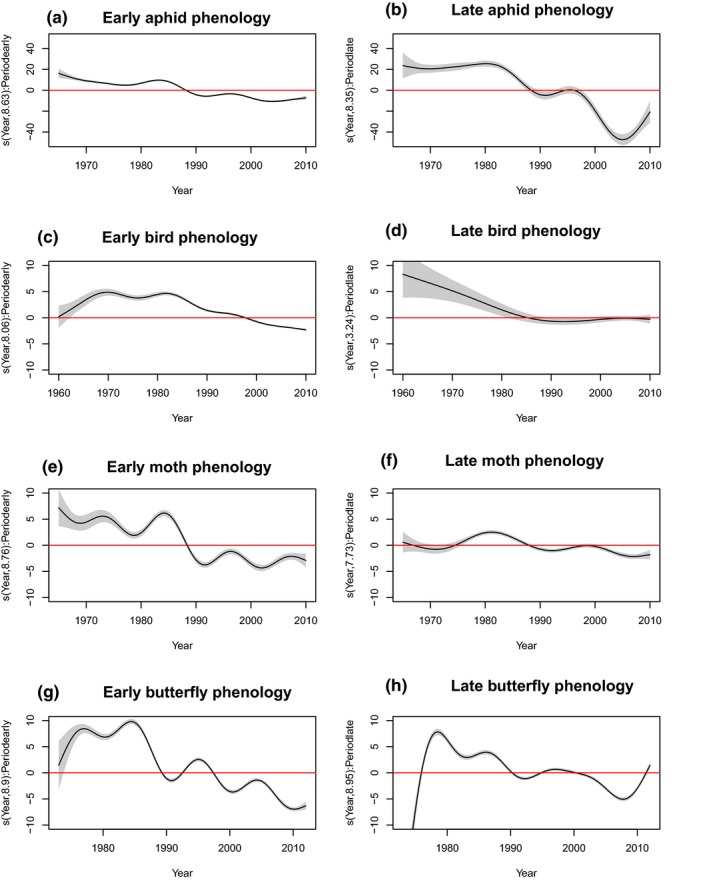
Global warming has advanced the timing of biological events, potentially leading to disruption across trophic levels. The potential importance of phenological change as a driver of population trends has been suggested. To fully understand the possible impacts, there is a need to quantify the scale of these changes spatially and according to habitat type. We studied the relationship between phenological trends, space and habitat type between 1965 and 2012 using an extensive UK dataset comprising 269 aphid, bird, butterfly and moth species. We modelled phenologies using generalized additive mixed models that included covariates for geographical (latitude, longitude, altitude), temporal (year, season) and habitat terms (woodland, scrub, grassland). Model selection showed that a baseline model with geographical and temporal components explained the variation in phenologies better than either a model in which space and time interacted or a habitat model without spatial terms. This baseline model showed strongly that phenologies shifted progressively earlier over time, that increasing altitude produced later phenologies and that a strong spatial component determined phenological timings, particularly latitude. The seasonal timing of a phenological event, in terms of whether it fell in the first or second half of the year, did not result in substantially different trends for butterflies. For moths, early season phenologies advanced more rapidly than those recorded later. Whilst temporal trends across all habitats resulted in earlier phenologies over time, agricultural habitats produced significantly later phenologies than most other habitats studied, probably because of nonclimatic drivers. A model with a significant habitat-time interaction was the best-fitting model for birds, moths and butterflies, emphasizing that the rates of phenological advance also differ among habitats for these groups. Our results suggest the presence of strong spatial gradients in mean seasonal timing and nonlinear trends towards earlier seasonal timing that varies in form and rate among habitat types.

Keywords: climate change; first egg day; first flight; generalized additive mixed models; global warming; temporal trends.


Figures

Figure 1
Figure 1
Baseline trend models for a) aphids (k = 5) b) birds (k = 22) c) butterflies (k = 20) and d) moths (k = 13), where k is the number of knots used to smooth spatial trends. The green isoclines on the maps are deviations from the intercept in days (aphids ±5 days, birds ±2 days, butterflies ±2 days and moths ±0.5 days). Interpolated darker reds indicate earlier phenologies in days; lighter yellows indicate later phenologies in days. The maximum difference between isoclines is large for aphids (30 days) and progressively smaller for butterflies (16 days), birds (12 days) and moths (5.5 days)
Figure 2
Figure 2
Altitude component for a) aphids b) birds c) butterflies and d) moths from the baseline trend model (Equation 1). The estimated smoothed terms are a transformed function of altitude which on the y‐axis is centred on zero and scaled by the effective degrees of freedom. The graphics show the estimated smoother effects with 95% confidence intervals in grey, where positive trends yield later phenologies with increasing altitude. The x‐axis has two components; the major tick marks indicate numerical values and above those are rug plots that show the distribution of altitudes in the original dataset, which are irregularly spaced. Note how the confidence interval widens as fewer phenological observations are recorded at higher altitudes
Figure 3
Figure 3
Year component for a) aphids b) birds c) butterflies and d) moths from the baseline trend model (Equation 1). The estimated smoothed terms are a transformed function of year which on the y‐axis is centred on zero and scaled by the effective degrees of freedom. The graphics show the estimated smoother effects with 95% confidence intervals in grey, where negative trends yield earlier phenologies with increasing time. The x‐axis has two components the major tick marks indicate numerical values and above those are rug plots that show the values for year which are regularly spaced
Figure 4
Figure 4
The seasonal component f2yrik-i for aphids (early = a; late = b), birds (early = c; late = d), moths (early = e; late = f) and butterflies (early =g; late =h) from Equation 5. For interpretation of the axes, see Figure 3

References

    1. Altermatt, F. (2010). Climate warming increases voltinism in European butterflies and moths. Proceedings of the Royal Society London B, 277, 1281–1287. 10.1098/rspb.2009.1910 - DOI - PMC - PubMed
    1. Bell, J. R. , Alderson, L. , Izera, D. , Kruger, T. , Parker, S. , Pickup, J. , … Harrington, R. (2015). Long‐term phenological trends, species accumulation rates and climate: Five decades of change in migrating aphids. Journal of Animal Ecology, 84, 21–34. 10.1111/1365-2656 - DOI - PMC - PubMed
    1. Blackman, R. L. (1971). Variation in the photoperiodic response within natural populations of Myzus persicae (Sulz.). Bulletin of Entomological Research, 60, 533–546. 10.1017/S0007485300042292 - DOI - PubMed
    1. Both, C. , Bouwhuis, S. , Lessells, C. M. , & Visser, M. E. (2006). Climate change and population declines in a long distance migratory bird. Nature, 441, 81–83. 10.1038/nature04539 - DOI - PubMed
    1. Brakefield, P. M. (1987). Geographical variability in, and temperature effects on, the phenology of Maniola jurtina (Lepidoptera, Satyridae) in England and Wales. Ecological Entomology, 12, 139–148.

Publication types