. 2019 May;8(5):296-307.
doi: 10.1002/psp4.12397. Epub 2019 Mar 13.

Physiologically-Based Pharmacokinetic Models for CYP1A2 Drug-Drug Interaction Prediction: A Modeling Network of Fluvoxamine, Theophylline, Caffeine, Rifampicin, and Midazolam

Affiliations

Physiologically-Based Pharmacokinetic Models for CYP1A2 Drug-Drug Interaction Prediction: A Modeling Network of Fluvoxamine, Theophylline, Caffeine, Rifampicin, and Midazolam

Hannah Britz et al. CPT Pharmacometrics Syst Pharmacol. 2019 May.

Abstract

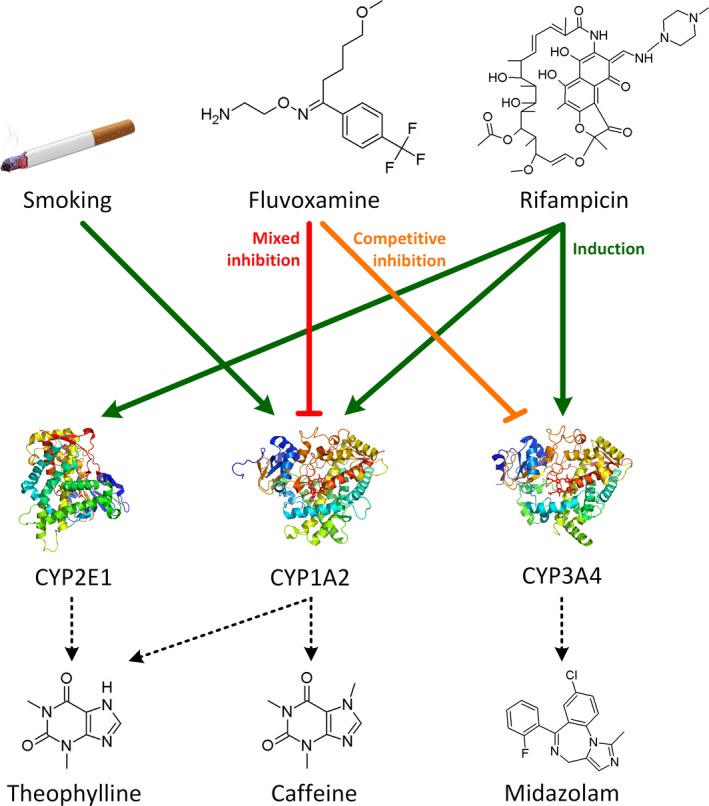
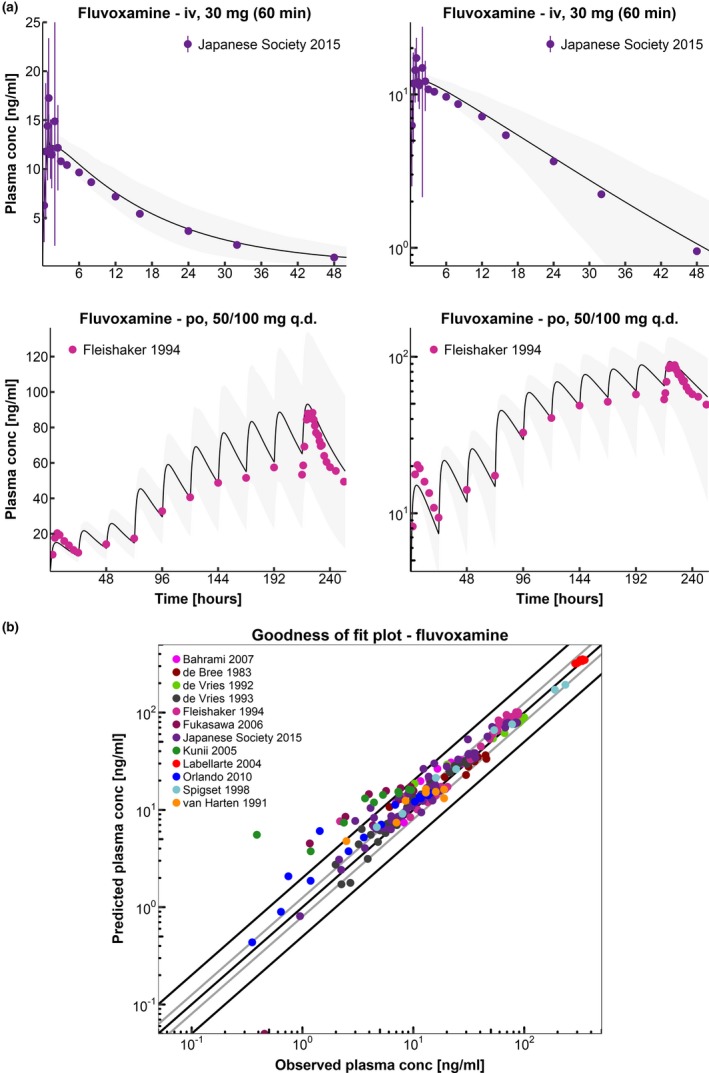
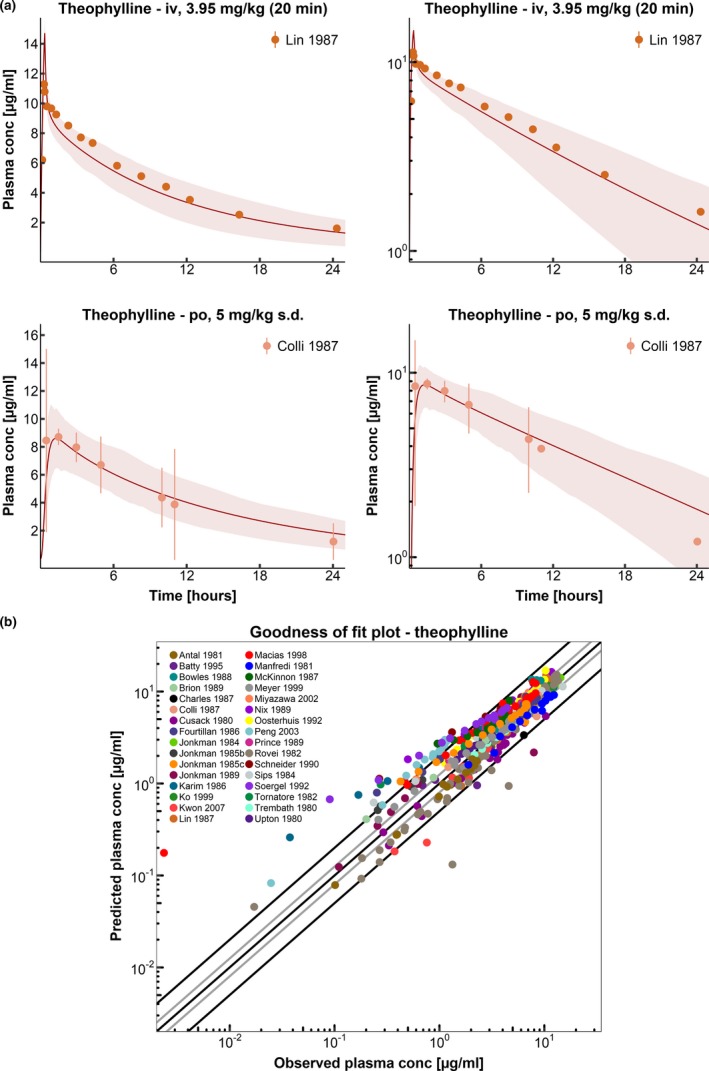
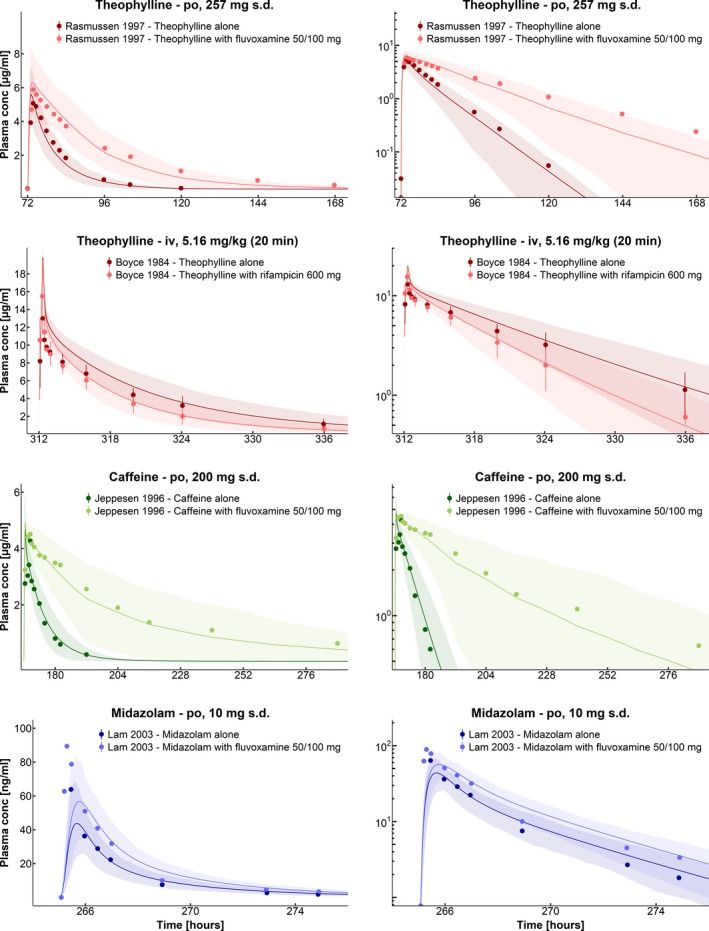
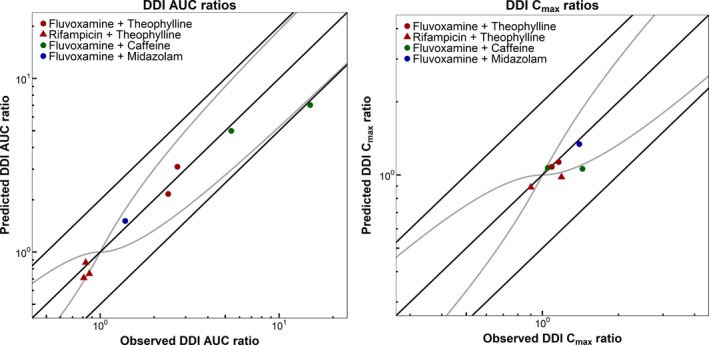
This study provides whole-body physiologically-based pharmacokinetic models of the strong index cytochrome P450 (CYP)1A2 inhibitor and moderate CYP3A4 inhibitor fluvoxamine and of the sensitive CYP1A2 substrate theophylline. Both models were built and thoroughly evaluated for their application in drug-drug interaction (DDI) prediction in a network of perpetrator and victim drugs, combining them with previously developed models of caffeine (sensitive index CYP1A2 substrate), rifampicin (moderate CYP1A2 inducer), and midazolam (sensitive index CYP3A4 substrate). Simulation of all reported clinical DDI studies for combinations of these five drugs shows that the presented models reliably predict the observed drug concentrations, resulting in seven of eight of the predicted DDI area under the plasma curve (AUC) ratios (AUC during DDI/AUC control) and seven of seven of the predicted DDI peak plasma concentration (Cmax ) ratios (Cmax during DDI/Cmax control) within twofold of the observed values. Therefore, the models are considered qualified for DDI prediction. All models are comprehensively documented and publicly available, as tools to support the drug development and clinical research community.


Conflict of interest statement

T.E., T.W., and S.F. are employees of Bayer AG. A.K.V. performed this work at the Saarland University. Since January 2018, she is an employee of the Federal Institute for Drugs and Medical Devices (BfArM) and declares no potential conflicts of interest with respect to the research, authorship, and/or publication of this article. No potential conflicts of interest were disclosed by the other authors.

Figures

Figure 1
Figure 1
Cytochrome P450 (CYP) 1A2 drug–drug interaction (DDI) network. Schematic illustration of the developed CYP1A2 DDI network with fluvoxamine and rifampicin as CYP1A2 perpetrator drugs and theophylline and caffeine as CYP1A2 victim drugs. Midazolam was used as CYP3A4 victim drug for fluvoxamine. Dark green lines indicate induction by rifampicin or smoking, and the red and orange lines indicate inhibition by fluvoxamine.
Figure 2
Figure 2
Fluvoxamine plasma concentrations. (a) Population predictions of selected fluvoxamine plasma concentration‐time profiles compared with observed data in linear (left panel) and semilogarithmic plots (right panel). The upper panel shows i.v. application, the lower panel p.o. administration of fluvoxamine. Observed data are shown as dots ± SD.34, 35 Population simulation arithmetic means are shown as lines; the shaded areas illustrate the 68% population prediction intervals. (b) Predicted compared with observed fluvoxamine plasma concentration values of all clinical studies. Line of identity and 0.5‐fold to 2.0‐fold acceptance limits are shown as black lines. The 0.8‐fold to 1.25‐fold limits are shown as grey lines. Details on dosing regimens and study populations are listed in Table S1a of Supplement S1 . Predicted and observed pharmacokinetic parameters are summarized in Table S1d of Supplement S1 .
Figure 3
Figure 3
Theophylline plasma concentrations. (a) Population predictions of selected theophylline plasma concentration‐time profiles compared with observed data in linear (left panel) and semilogarithmic plots (right panel). The upper panel shows i.v. application, the lower panel p.o. administration of theophylline. Observed data are shown as dots ± SD.36, 37 Population simulation arithmetic means are shown as lines, and the shaded areas illustrate the 68% population prediction intervals. (b) Predicted compared with observed theophylline plasma concentration values of all clinical studies. Line of identity and 0.5‐fold to 2.0‐fold acceptance limits are shown as black lines. The 0.8‐fold to 1.25‐fold limits are shown as grey lines. Details on dosing regimens and study populations are listed in Table S2a of Supplement S1 . Predicted and observed pharmacokinetic parameters are summarized in Table S2d of Supplement S1 .
Figure 4
Figure 4
Plasma concentration‐time profiles of the drug–drug interaction (DDI) network. Population predictions of selected plasma concentration‐time profiles compared with observed data for the fluvoxamine‐theophylline, rifampicin‐theophylline, fluvoxamine‐caffeine, and fluvoxamine‐midazolam DDIs in linear (left panel) and semilogarithmic plots (right panel). Observed data are shown as dots ± SD.38, 39, 40, 41 Population simulation arithmetic means are shown as lines, and the shaded areas illustrate the 68% population prediction intervals. Details on dosing regimens and study populations are listed in Tables S7a, S8a, S9a, and S10a of Supplement S1 . Predicted and observed pharmacokinetic parameters are summarized in Tables S7b, S8b, S9b, and S10b of Supplement S1 .
Figure 5
Figure 5
Correlation of predicted to observed drug–drug interaction (DDI) area under the curve (AUC) ratios, and DDI peak plasma concentration (Cmax) ratios. The left panel illustrates the predicted compared with observed DDI AUC ratios, the right panel illustrates the predicted compared with observed DDI Cmax ratios of the fluvoxamine‐theophylline, rifampicin‐theophylline, fluvoxamine‐caffeine, and fluvoxamine‐midazolam DDIs. Fluvoxamine interaction studies are shown as dots and rifampicin interaction studies are shown as triangles. The colors represent the different victim drugs. The line of identity and the 0.5‐fold to 2.0‐fold acceptance limits are shown as straight black lines. The curved grey lines are the prediction acceptance limits proposed by Guest et al.42Study references, dosing regimens, and values of predicted and observed DDI AUC ratios and DDI Cmax ratios are listed in Table 1.

Similar articles

Cited by

References

    1. Zhou, S.F. , Yang, L.P. , Zhou, Z.W. , Liu, Y.H. & Chan, E. Insights into the substrate specificity, inhibitors, regulation, and polymorphisms and the clinical impact of human cytochrome P450 1A2. AAPS J. 11, 481–494 (2009). - PMC - PubMed
    1. Shimada, T. , Yamazaki, H. , Mimura, M. , Inui, Y. & Guengerich, F.P. Interindividual variations in human liver cytochrome P‐450 enzymes involved in the oxidation of drugs, carcinogens and toxic chemicals: studies with liver microsomes of 30 Japanese and 30 caucasians. J. Pharmacol. Exp. Ther. 270, 414–423 (1994). - PubMed
    1. Chen, Y. , Liu, L. , Laille, E. , Kumar, G. & Surapaneni, S. In vitro assessment of cytochrome P450 inhibition and induction potential of azacitidine. Cancer Chemother. Pharmacol. 65, 995–1000 (2010). - PMC - PubMed
    1. Kalow, W. & Tang, B. The use of caffeine for enzyme assays: a critical appraisal. Clin. Pharmacol. Ther. 53, 503–514 (1993). - PubMed
    1. Karjalainen, M.J. , Neuvonen, P.J. & Backman, J.T. Rofecoxib is a potent, metabolism‐dependent inhibitor of CYP1A2: implications for in vitro prediction of drug interactions. Drug Metab. Dispos. 34, 2091–2096 (2006). - PubMed

Publication types

MeSH terms