. 2019 Feb 14:8:e41017.
doi: 10.7554/eLife.41017.

Negative reciprocity, not ordered assembly, underlies the interaction of Sox2 and Oct4 on DNA

Affiliations

Negative reciprocity, not ordered assembly, underlies the interaction of Sox2 and Oct4 on DNA

John W Biddle et al. Elife. .

Abstract

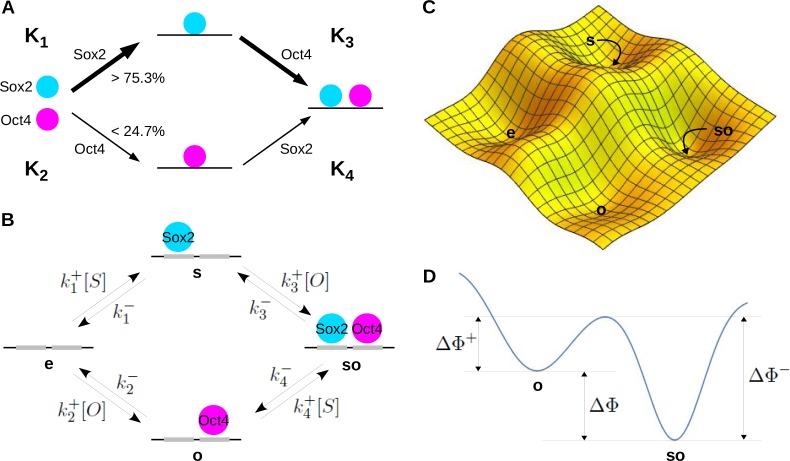
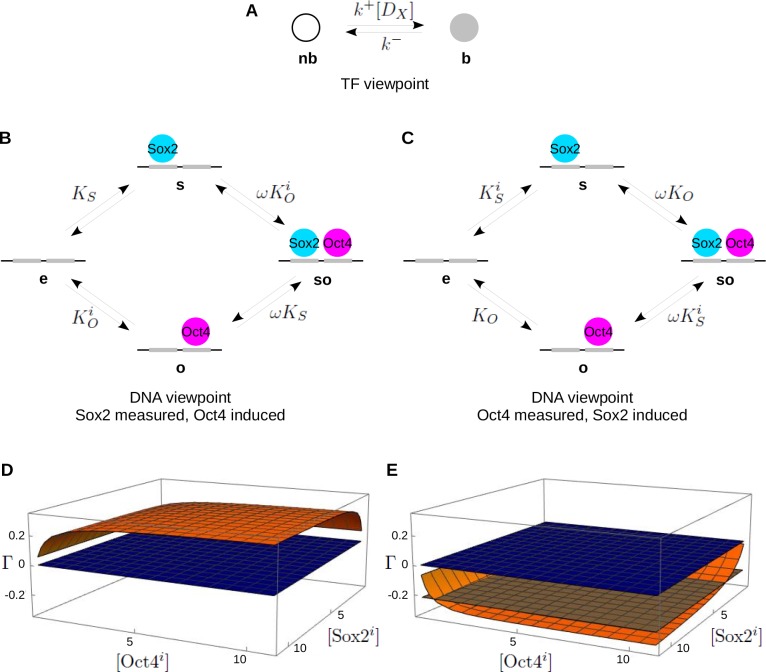
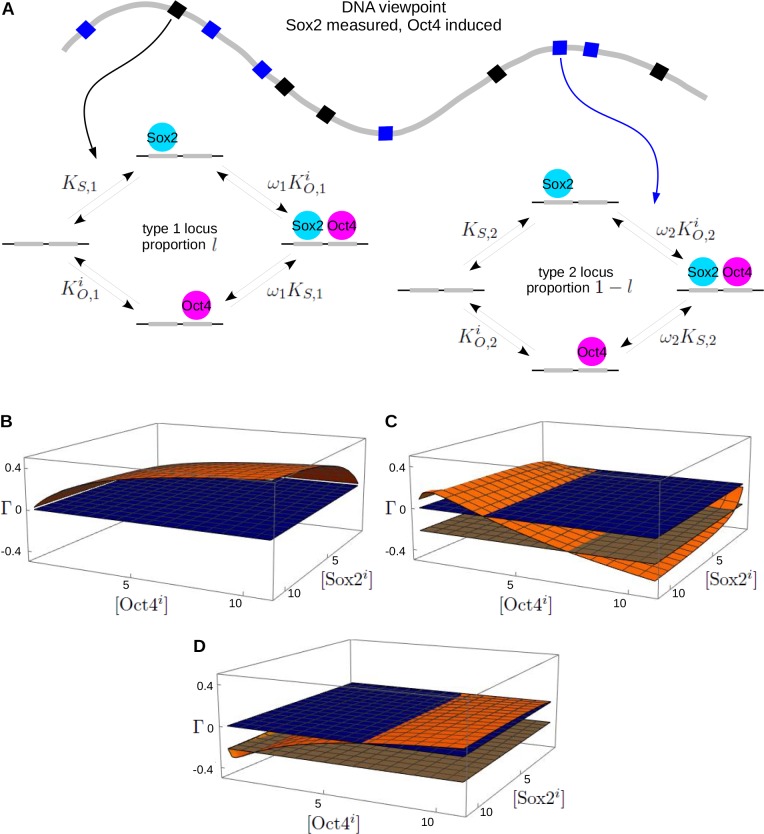
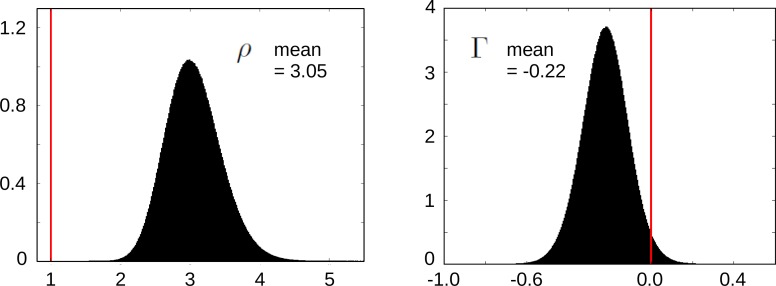
The mode of interaction of transcription factors (TFs) on eukaryotic genomes remains a matter of debate. Single-molecule data in living cells for the TFs Sox2 and Oct4 were previously interpreted as evidence of ordered assembly on DNA. However, the quantity that was calculated does not determine binding order but, rather, energy expenditure away from thermodynamic equilibrium. Here, we undertake a rigorous biophysical analysis which leads to the concept of reciprocity. The single-molecule data imply that Sox2 and Oct4 exhibit negative reciprocity, with expression of Sox2 increasing Oct4's genomic binding but expression of Oct4 decreasing Sox2's binding. Models show that negative reciprocity can arise either from energy expenditure or from a mixture of positive and negative cooperativity at distinct genomic loci. Both possibilities imply unexpected complexity in how TFs interact on DNA, for which single-molecule methods provide novel detection capabilities.

Keywords: Oct4 and Sox2; gene regulation; linear framework; non-equilibrium; none; physics of living systems; single-molecule data.


Conflict of interest statement

JB, MN, JG No competing interests declared

Figures

Figure 1.
Figure 1.. Ordered assembly, graphs and energy landscapes.
(A) Ordered assembly of Sox2 and Oct4 on DNA adapted from (Chen et al., 2014, Figure 6E) and annotated with the quantities Ki described in the Introduction. (B) Corresponding linear framework graph for Sox2 and Oct4 binding to DNA, showing the microstates (vertices), transitions (directed edges) and rates (edge labels). (C) Hypothetical 2D energy landscape for the system in A, showing the free-energy minima corresponding to the four microstates. (D) Hypothetical 1D cross-section through the energy landscape, along a reaction coordinate that traverses the lowest point on the ‘continental divide’ between microstates o and so, as explained in the text. The annotations show the free-energy differences which influence the kinetic labels for binding of Sox2 to o (ΔΦ+) and for unbinding of Sox2 from so (ΔΦ-). The thermodynamic ratio of the binding to unbinding label is determined by the difference in the free-energy minima (ΔΦ), as given by Equation 3.
Figure 2.
Figure 2.. The single-locus model and reciprocity.
(A) Linear framework graph for the TF X, showing the microstate, b, in which X is specifically bound to DNA and the microstate, nb, in which X is not specifically bound. (B) Graph adapted from Figure 1B for the cell line in which Sox2 is measured and Oct4 is induced and taken to be at thermodynamic equilibrium, with only the ratios of binding to unbinding labels being shown. The subscripts S and O denote Sox2 and Oct4, respectively, the superscript i denotes ‘induced’ and ω is the cooperativity. (C) As in B for the cell line in which Oct4 is measured and Sox2 is induced. Panels B and C define the single-locus model at thermodynamic equilibrium. (D) Plot of the reciprocity, Γ, (orange surface), as defined in Equation 20, against the concentrations, [Sox2i] and [Oct4i], of the induced TFs, for the single-locus model with parameter values at thermodynamic equilibrium. The flat blue plane indicates 0. (E) As in panel D but for parameter values away from thermodynamic equilibrium, calculated as described in the text and the Materials and methods. Only a single off-rate, corresponding to k4- from so to o in Figure 1B, was increased from the equilibrium value used in panel D, thereby breaking detailed balance. With this change, the reciprocity becomes negative throughout and can equal the reciprocity of Γ=-0.22 calculated from the data of Chen et al. (Materials and methods), indicated by the flat brown plane. Numerical parameter values are given in the Materials and methods.
Figure 3.
Figure 3.. The genomic-diversity model and reciprocity.
(A) Schematic illustration of diversity in Sox2 and Oct4 binding sites on genomic DNA (thick gray curve), showing two types of loci, type 1 (black squares) and type 2 (blue squares), which have distinct K’s and ω’s, as indicated by the subscripts, 1 and 2, respectively. The details are shown for the cell line in which Sox2 is measured and Oct4 is induced, as in Figure 2B and a similar model should be imagined for the other cell line, as in Figure 2C. (B) Plot of the reciprocity, Γ, as in Figure 2B, for the model in panel A at thermodynamic equilibrium with both types of loci having positive cooperativity. (C) As in panel B but with the off-rate corresponding to k4-, for the transition from so to o in Figure 1B, increased at type II loci from the equilibrium value used in panel B, thereby breaking detailed balance. The flat brown plane marks the reciprocity, Γ=-0.22, of the data of Chen et al. (Materials and methods). (D) As in panels B and C but at thermodynamic equilibrium with mixed cooperativities, positive at type 1 loci and negative at type 2 loci. Numerical parameter values are given in the Materials and methods.
Scheme 1.
Scheme 1.. Empirical distributions for ρ (left) and Γ (right).

Similar articles

Cited by

References

    1. Ahsendorf T, Wong F, Eils R, Gunawardena J. A framework for modelling gene regulation which accommodates non-equilibrium mechanisms. BMC Biology. 2014;12:102. doi: 10.1186/s12915-014-0102-4. - DOI - PMC - PubMed
    1. Avilion AA, Nicolis SK, Pevny LH, Perez L, Vivian N, Lovell-Badge R. Multipotent cell lineages in early mouse development depend on SOX2 function. Genes & Development. 2003;17:126–140. doi: 10.1101/gad.224503. - DOI - PMC - PubMed
    1. Battle C, Broedersz CP, Fakhri N, Geyer VF, Howard J, Schmidt CF, MacKintosh FC. Broken detailed balance at mesoscopic scales in active biological systems. Science. 2016;352:604–607. doi: 10.1126/science.aac8167. - DOI - PMC - PubMed
    1. Bintu L, Buchler NE, Garcia HG, Gerland U, Hwa T, Kondev J, Phillips R. Transcriptional regulation by the numbers: models. Current Opinion in Genetics & Development. 2005;15:116–124. doi: 10.1016/j.gde.2005.02.007. - DOI - PMC - PubMed
    1. Chang YK, Srivastava Y, Hu C, Joyce A, Yang X, Zuo Z, Havranek JJ, Stormo GD, Jauch R. Quantitative profiling of selective Sox/POU pairing on hundreds of sequences in parallel by Coop-seq. Nucleic Acids Research. 2017;45:832–845. doi: 10.1093/nar/gkw1198. - DOI - PMC - PubMed

Publication types