. 2019 May 1;129(5):1863-1877.
doi: 10.1172/JCI124108. Epub 2019 Feb 14.

Differential immune profiles distinguish the mutational subtypes of gastrointestinal stromal tumor

Differential immune profiles distinguish the mutational subtypes of gastrointestinal stromal tumor

Gerardo A Vitiello et al. J Clin Invest. .

Abstract

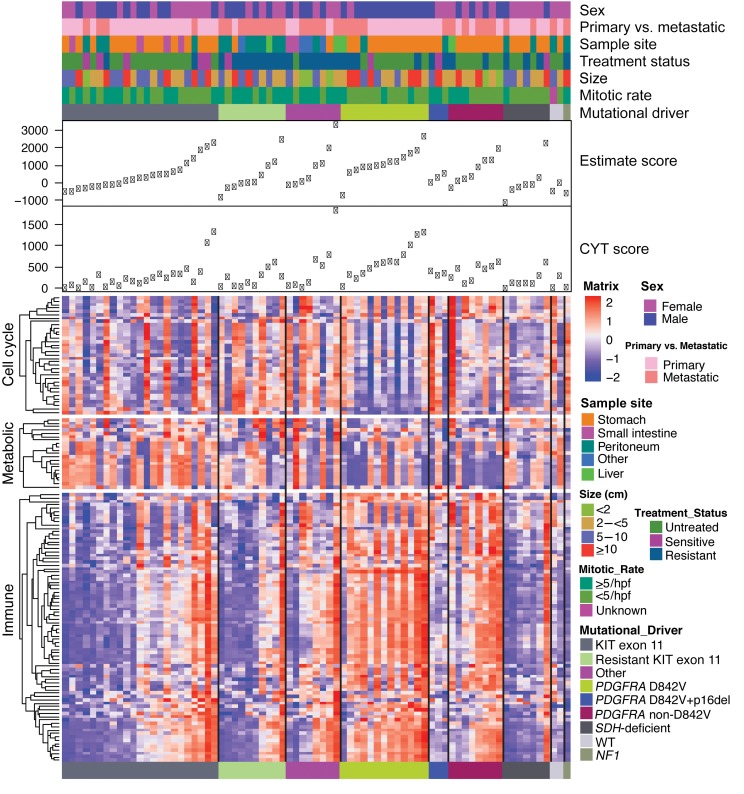
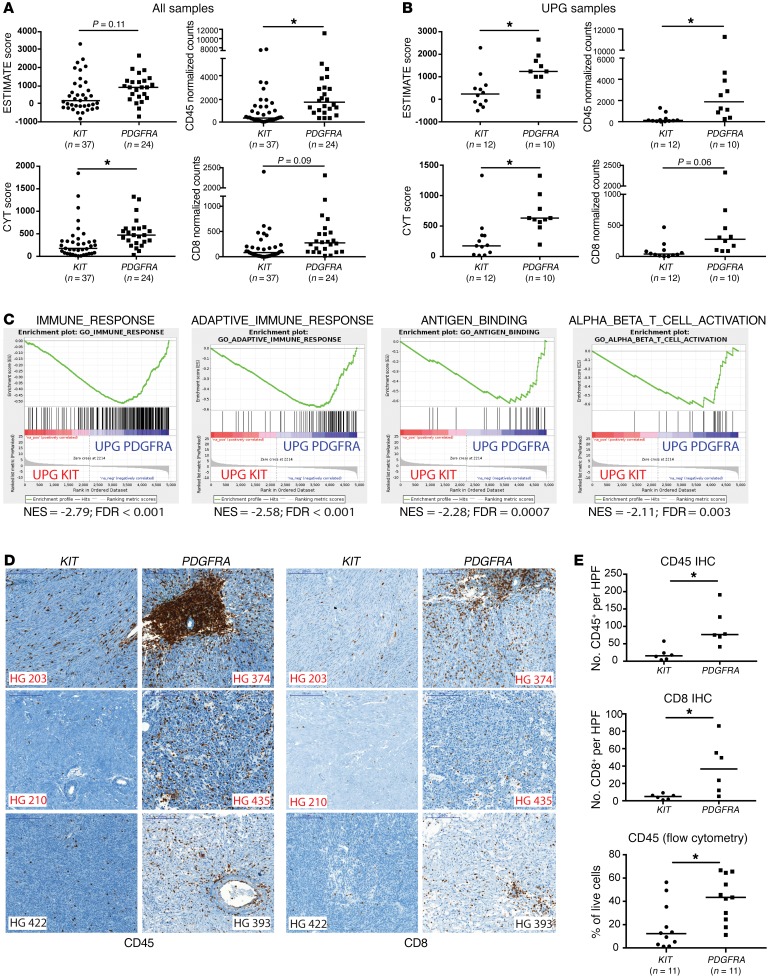
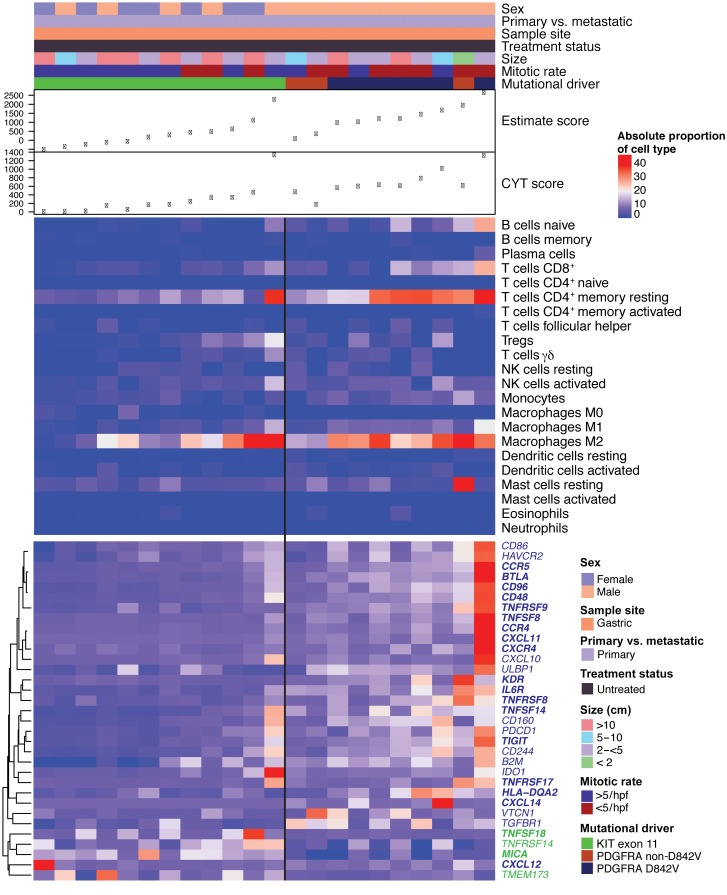
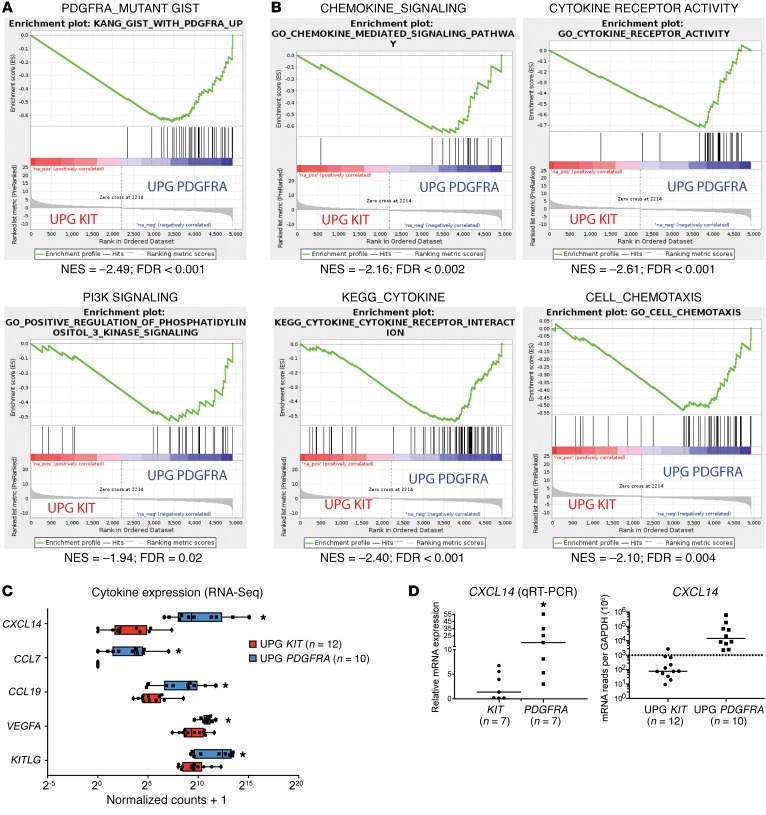
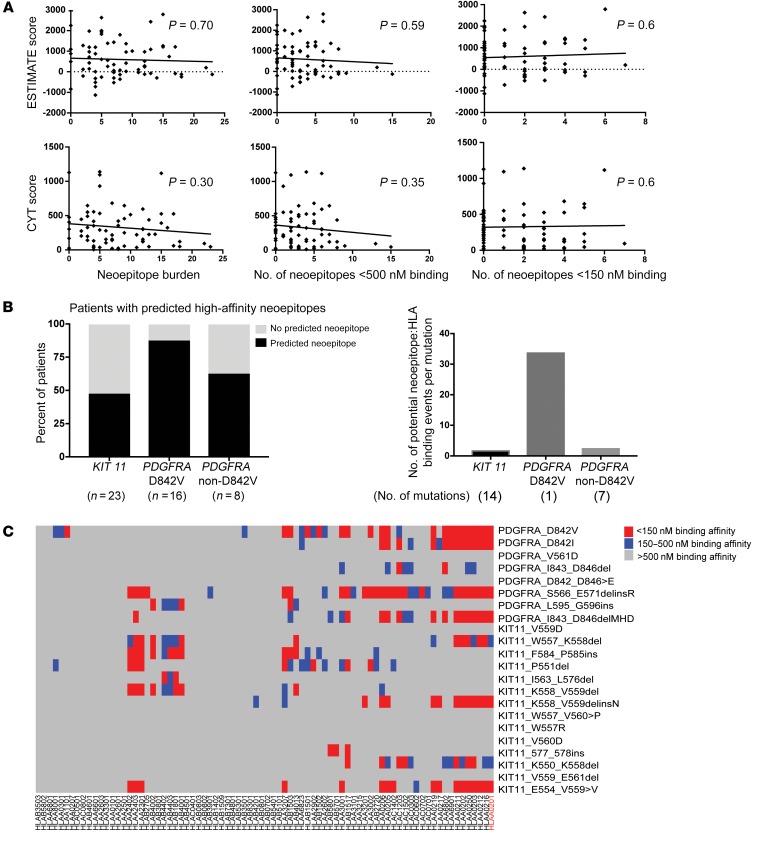
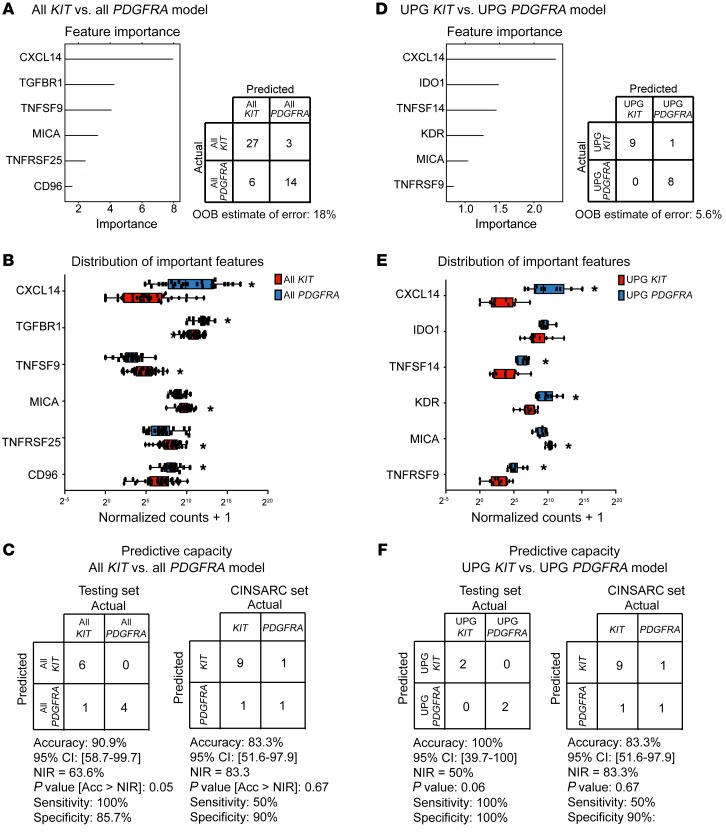
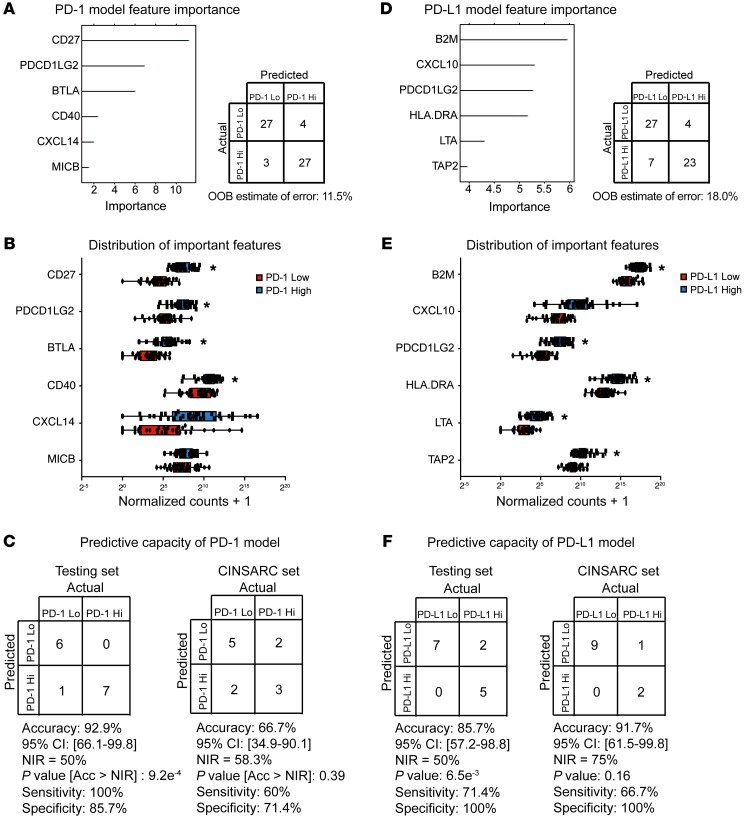
Gastrointestinal stromal tumor (GIST) is the most common human sarcoma, frequently characterized by an oncogenic mutation in the KIT or platelet-derived growth factor receptor alpha (PDGFRA) genes. We performed RNA sequencing of 75 human GIST tumors from 75 patients, comprising the largest cohort of GISTs sequenced to date, in order to discover differences in the immune infiltrates of KIT and PDGFRA-mutant GIST. Through bioinformatics, immunohistochemistry, and flow cytometry, we found that PDGFRA-mutant GISTs harbored more immune cells with increased cytolytic activity when compared to KIT-mutant GISTs. PDGFRA-mutant GISTs expressed many chemokines, such as CXCL14, at a significantly higher level when compared to KIT-mutant GISTs and exhibited more diverse driver-derived neoepitope:HLA binding, both of which may contribute to PDGFRA-mutant GIST immunogenicity. Through machine learning, we generated gene expression-based immune profiles capable of differentiating KIT and PDGFRA-mutant GISTs, and also identified additional immune features of high PD-1 and PD-L1 expressing tumors across all GIST mutational subtypes, which may provide insight into immunotherapeutic opportunities and limitations in GIST.

Keywords: Bioinformatics; Cancer immunotherapy; Immunology; Oncogenes; Oncology.


Conflict of interest statement

Conflict of interest: The authors have declared that no conflict of interest exists.

Figures

Figure 1
Figure 1. ssGSEA identifies immune cell pathway enrichment in PDGFRA-mutant GIST.
ssGSEA of 75 GIST specimens, organized by mutational driver and increasing ESTIMATE score. Unsupervised row clustering grouped gene sets into 3 major categories based on cell cycle pathways, metabolic pathways, and immune pathways. Clinicopathologic characteristics of the 75 GIST specimens are shown in the annotation and in Supplemental Table 1.
Figure 2
Figure 2. PDGFRA-mutant GIST is more immunologically active compared with KIT-mutant GIST.
(A) ESTIMATE and CYT scores (left) and CD45 and CD8 normalized counts (right) of all KIT- and PDGFRA-mutant GISTs (n = 61; Supplemental Table 3). (B). ESTIMATE and CYT scores (left) and CD45 and CD8 normalized counts (right) of UPG KIT- and PDGFRA-mutant GISTs (n = 22; Supplemental Table 4). (C) GSEA showing multiple immune pathways enriched in UPG PDGFRA-mutant compared with UPG KIT-mutant GISTs. NES, normalized enrichment score. (D) ×10 magnification CD45 and CD8 IHC staining in KIT- and PDGFRA-mutant GISTs. Red text indicates specimen was included in RNA-Seq cohort, while samples represented in black text were not included. Representative samples of n = 6 per group are shown. (E) CD45 (top) and CD8 (middle) quantification of IHC staining. n = 6 per group. The number of CD45+ and CD8+ cells per HPF was calculated by examining 5 HPFs per tumor and plotting the average per tumor. Bottom: CD45 expression by flow cytometry (for specimens in which flow cytometry data were available). *P < 0.05, t test. Bars indicate median.
Figure 3
Figure 3. CIBERSORT and DGE analysis identify unique immune signatures in GIST.
CIBERSORT (middle) and immune gene expression (bottom) of UPG KIT- and UPG PDGFRA-mutant GISTs, organized by mutational driver and increasing ESTIMATE score (n = 22). Unsupervised row-normalized clustering of genes shows grouping of genes into distinct groups, suggestive of oncogene-driven immune profiles. Genes shown in blue were significantly enriched in UPG PDGFRA- compared with UPG KIT-mutant, while genes in green were significantly enriched in UPG KIT- compared with UPG PDGFRA-mutant samples. Enrichment was considered as an adjusted P < 0.1 as calculated by DESeq2 for R, while boldface for gene names indicates a significant difference, with an adjusted P < 0.05. Clinicopathologic characteristics of the UPG GIST specimens are shown in the annotation and in Supplemental Table 4.
Figure 4
Figure 4. PDGFRA- and KIT-mutant GISTs have distinct signaling and cytokine signatures.
GSEA showing enrichment of (A) PDGFRA signaling, PI3K signaling, and (B) cytokine signaling pathways in UPG PDGFRA- compared with UPG KIT-mutant GISTs (n = 22). (C) Distribution of cytokines between UPG KIT- and UPG PDGFRA-mutant GISTs, by RNA-Seq. Adjusted P < 0.05 as calculated by DESeq2. All data points are shown; boxes define the interquartile range, with whiskers extending to lowest and highest data points. (D) Left: Relative CXCL14 mRNA expression by qRT-PCR in KIT- (n = 7) and PDGFRA-mutant (n = 7) GISTs from the RNA-Seq cohort, compared with the GIST-T1 cell line (expression set at 1; data not shown). Right: CXCL14 mRNA expression relative to GAPDH × 106 in UPG KIT- and PDGFRA-mutant GISTs. Horizontal dotted line represents CXCL14 mRNA expression needed to induce tumor regression (31). *P < 0.05, t test. Bars indicate the median.
Figure 5
Figure 5. PDGFRA mutation produces multiple HLA-diverse, strong binding neoepitopes.
(A) Pearson’s correlation of ESTIMATE (top) and CYT (bottom) scores with total neoepitope burden (left), number of high-affinity neoepitopes (middle), and number of very high-affinity neoepitopes (right) among all GIST samples (n = 75). (B) Left: Percentage of patients with the indicated mutation whose mutation produced a predicted high-affinity neoepitope. Right: Number of potential neoepitope:HLA binding events produced by mutation type, averaged over the number of mutations per group. (C) Heatmap of the binding affinities of KIT and PDGFRA mutation–specific neoepitopes to all validated NetMHCPan 3.0 HLA types. Clinicopathologic characteristics of the GIST specimens are shown in Supplemental Table 3. Additional details regarding mutations, neoepitopes, and HLA types used to create this heatmap are shown in Supplemental Tables 6 and 7.
Figure 6
Figure 6. Machine learning identifies an immune signature predictive of KIT- and PDGFRA-mutant GIST.
(A) Random forest modeling with 5-fold cross-validation of KIT- and PDGFRA-mutant GIST specimens (training set created by partitioning 80% of KIT and PDGFRA samples from Supplemental Table 3, n = 50). Confusion matrix (right) indicates assessment of model fit to training set. OOB, out-of-bag. (B) Distribution of top 6 features identified by random forest modeling. *Adjusted P < 0.05 from DSeq2. (C) Predictive capacity of model on remaining KIT- and PDGFRA-mutant GIST testing set (n = 11) and the CINSARC cohort (n = 12). Accuracy (Acc), sensitivity, specificity, and P value[Acc >no information rate (NIR)] of the model are shown, calculated by caret package for R. Bars indicate mean + SEM. (D) Random forest modeling with 5-fold cross-validation of UPG KIT- and UPG PDGFRA-mutant GIST specimens (training set created by partitioning 80% of UPG KIT and UPG PDGFRA samples from Supplemental Table 4, n = 18). Confusion matrix (right) indicates assessment of model fit to training set. (E) Distribution of top 6 features identified by random forest modeling. *Adjusted P < 0.05 from DSeq2. (F) Predictive capacity of model on remaining UPG KIT- and UPG PDGFRA-mutant GIST testing set (n = 4) and the CINSARC cohort (n = 12). Accuracy, sensitivity, specificity, and P value[Acc >NIR] of the model are shown, calculated by caret package for R. For B and E, all data points are shown, with boxes defining the interquartile range and whiskers extending to the lowest and highest data points.
Figure 7
Figure 7. Machine learning identifies an immune signature predictive of PD-1 and PD-L1 expression in GIST.
(A) Random forest modeling of PD-1 with 5-fold cross-validation of GIST specimens (training set created by partitioning 80% of all GIST samples from Supplemental Table 1, n = 61). Confusion matrix (right) indicates assessment of model fit to training set. (B) Distribution of top 6 features identified by random forest modeling. *Adjusted q < 0.1. (C) Predictive capacity of model on remaining 14 GISTs (testing set) and external CINSARC GIST cohort (n = 12). Accuracy, sensitivity, specificity, and P value[Acc > NIR] of model are shown, calculated by caret package for R. (D) Random forest modeling of PD-L1 with 5 k-folds cross-validation of GIST specimens (training set created by partitioning 80% of all GIST samples from Supplemental Table 1, n = 61). Confusion matrix (right) indicates assessment of modeling fit to training set. (E) Distribution of top 6 features identified by random forest modeling. *Adjusted q < 0.1. (F) Predictive capacity of model on remaining 14 GISTs (testing set) and external CINSARC GIST cohort (n = 12). Accuracy, sensitivity, specificity, and P value[Acc >NIR] of the model are shown, as calculated by caret package for R. For B and E, all data points are shown, with boxes defining the interquartile range and whiskers extending to the lowest and highest data points.

Similar articles

Cited by

References

    1. Ducimetière F, et al. Incidence of sarcoma histotypes and molecular subtypes in a prospective epidemiological study with central pathology review and molecular testing. PLoS ONE. 2011;6(8):e20294. doi: 10.1371/journal.pone.0020294. - DOI - PMC - PubMed
    1. Hirota S, et al. Gain-of-function mutations of c-kit in human gastrointestinal stromal tumors. Science. 1998;279(5350):577–580. doi: 10.1126/science.279.5350.577. - DOI - PubMed
    1. Joensuu H, DeMatteo RP. The management of gastrointestinal stromal tumors: a model for targeted and multidisciplinary therapy of malignancy. Annu Rev Med. 2012;63:247–258. doi: 10.1146/annurev-med-043010-091813. - DOI - PMC - PubMed
    1. Corless CL, et al. Pathologic and molecular features correlate with long-term outcome after adjuvant therapy of resected primary GI stromal tumor: the ACOSOG Z9001 trial. J Clin Oncol. 2014;32(15):1563–1570. doi: 10.1200/JCO.2013.51.2046. - DOI - PMC - PubMed
    1. Corless CL, et al. PDGFRA mutations in gastrointestinal stromal tumors: frequency, spectrum and in vitro sensitivity to imatinib. J Clin Oncol. 2005;23(23):5357–5364. doi: 10.1200/JCO.2005.14.068. - DOI - PubMed

Publication types