. 2019 Feb;98(7):e14410.
doi: 10.1097/MD.0000000000014410.

Comparison of treatments for lumbar disc herniation: Systematic review with network meta-analysis

Affiliations

Comparison of treatments for lumbar disc herniation: Systematic review with network meta-analysis

Mark P Arts et al. Medicine (Baltimore). 2019 Feb.

Abstract

Study design: Systematic review with network meta-analysis.

Objective: To compare patient outcomes of lumbar discectomy with bone-anchored annular closure (LD + AC), lumbar discectomy (LD), and continuing conservative care (CC) for treatment of lumbar disc herniation refractory to initial conservative management.

Summary of background data: Several treatment options are available to patients with refractory symptoms of lumbar disc herniation, but their comparative efficacy is unclear.

Methods: A systematic review was performed to compare efficacy of LD + AC, LD, and CC for treatment of lumbar disc herniation. Outcomes included leg pain, back pain, disability (each reported on a 0-100 scale), reherniation, and reoperation. Data were analyzed using random effects network meta-analysis.

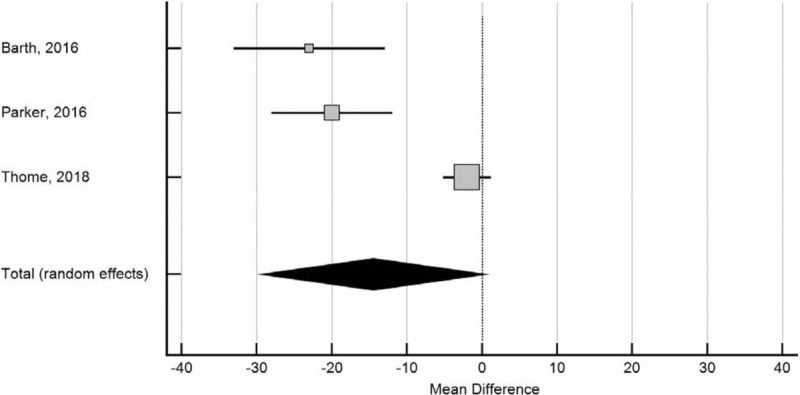
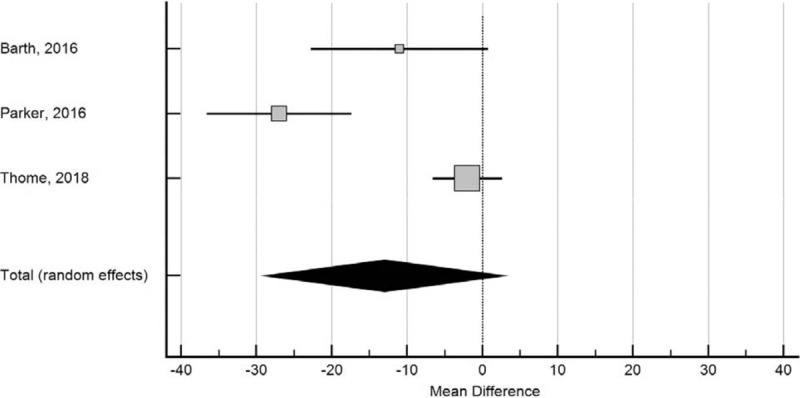
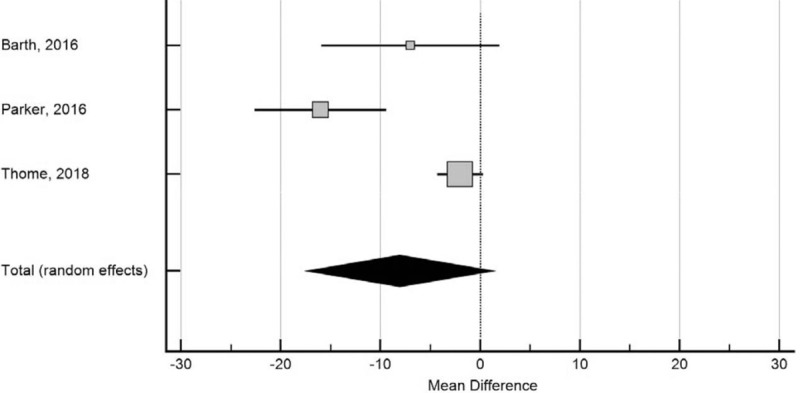
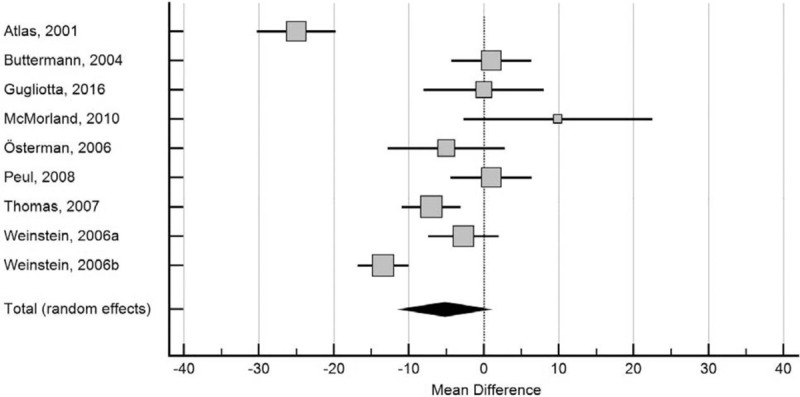
Results: This review included 14 comparative studies (8 randomized) involving 3947 patients-11 studies of LD versus CC (3232 patients), 3 studies of LD + AC versus LD (715 patients), and no studies of LD + AC versus CC. LD was more effective than CC in reducing leg pain (mean difference [MD] -10, P < .001) and back pain (MD -7, P < .001). LD + AC was more effective than LD in reducing risk of reherniation (odds ratio 0.38, P < .001) and reoperation (odds ratio 0.33, P < .001). There was indirect evidence that LD + AC was more effective than CC in reducing leg pain (MD -25, P = .003), back pain (MD -20, P = .02), and disability (MD -13, P = .02) although the treatment effect was smaller in randomized trials.

Conclusions: Results of a network meta-analysis show LD is more effective than CC in alleviating symptoms of lumbar disc herniation refractory to initial conservative management. Further, LD + AC lowers risk of reherniation and reoperation versus LD and may improve patient symptoms more than CC.


Conflict of interest statement

Conflicts of interest: Mart Arts reports consultancy with Intrinsic Therapeutics; other from Zimmer-Biomet, EIT, and Silony, outside the submitted work; and receipt of royalties from EIT. Adisa Kuršumović reports consultancy with Intrinsic Therapeutics. Larry Miller reports consultancy with Intrinsic Therapeutics. Jasper Wolfs reports nonfinancial support from Intrinsic Therapeutics; other from Zimmer Biomet, Safe Orthopaedics, Silony, and EIT, outside the submitted work. Jason Perrin has nothing to disclose. Erik Van de Kelft reports consultancy with Intrinsic Therapeutics. Volkmar Heidecke has nothing to disclose.

Figures

Figure 1
Figure 1
Forest plot of leg pain severity after lumbar discectomy with bone-anchored annular closure versus lumbar discectomy. The mean difference and 95% confidence interval is plotted for each study. The pooled mean difference (diamond apex) and 95% confidence interval (diamond width) is calculated using a random effects model. Positive pooled mean difference suggests greater leg pain with bone-anchored annular closure. Negative pooled mean difference suggests less leg pain with bone-anchored annular closure. Mean difference −14, P = .06. Heterogeneity: I2 = 90%; P < .001.
Figure 2
Figure 2
Forest plot of leg pain severity after lumbar discectomy or conservative care. The mean difference and 95% confidence interval is plotted for each study. The pooled mean difference (diamond apex) and 95% confidence interval (diamond width) is calculated using a random effects model. Positive pooled mean difference suggests greater leg pain with lumbar discectomy. Negative pooled mean difference suggests less leg pain with lumbar discectomy. Mean difference −10, P < .001. Heterogeneity: I2 = 90%; P < .001.
Figure 3
Figure 3
Forest plot of back pain severity after lumbar discectomy with bone-anchored annular closure versus lumbar discectomy. The mean difference and 95% confidence interval is plotted for each study. The pooled mean difference (diamond apex) and 95% confidence interval (diamond width) is calculated using a random effects model. Positive pooled mean difference suggests greater back pain with bone-anchored annular closure. Negative pooled mean difference suggests less back pain with bone-anchored annular closure. Mean difference −13, P = .11. Heterogeneity: I2 = 91%; P < .001.
Figure 4
Figure 4
Forest plot of back pain severity after lumbar discectomy or conservative care. The mean difference and 95% confidence interval is plotted for each study. The pooled mean difference (diamond apex) and 95% confidence interval (diamond width) is calculated using a random effects model. Positive pooled mean difference suggests greater back pain with lumbar discectomy. Negative pooled mean difference suggests less back pain with lumbar discectomy. Mean difference −7, P = .02. Heterogeneity: I2 = 74%; P < .001.
Figure 5
Figure 5
Forest plot of disability after lumbar discectomy with bone-anchored annular closure versus lumbar discectomy. The mean difference and 95% confidence interval is plotted for each study. The pooled mean difference (diamond apex) and 95% confidence interval (diamond width) is calculated using a random effects model. Positive pooled mean difference suggests greater disability with bone-anchored annular closure. Negative pooled mean difference suggests less disability with bone-anchored annular closure. Mean difference −8, P = .09. Heterogeneity: I2 = 87%; P < .001.
Figure 6
Figure 6
Forest plot of disability after lumbar discectomy or conservative care. The mean difference and 95% confidence interval is plotted for each study. The pooled mean difference (diamond apex) and 95% confidence interval (diamond width) is calculated using a random effects model. Positive pooled mean difference suggests greater disability with lumbar discectomy. Negative pooled mean difference suggests less disability with lumbar discectomy. Mean difference −5, P = .09. Heterogeneity: I2 = 91%; P < .001.

References

    1. Kreiner DS, Hwang SW, Easa JE, et al. An evidence-based clinical guideline for the diagnosis and treatment of lumbar disc herniation with radiculopathy. Spine J 2014;14:180–91. - PubMed
    1. Frymoyer JW. Back pain and sciatica. N Engl J Med 1988;318:291–300. - PubMed
    1. Vroomen PC, de Krom MC, Knottnerus JA. Predicting the outcome of sciatica at short-term follow-up. Br J Gen Pract 2002;52:119–23. - PMC - PubMed
    1. Vroomen PC, de Krom MC, Wilmink JT, et al. Lack of effectiveness of bed rest for sciatica. N Engl J Med 1999;340:418–23. - PubMed
    1. Ramaswami R, Ghogawala Z, Weinstein JN. Management of sciatica. N Engl J Med 2017;376:1175–7. - PubMed

Publication types