

Pharmaco-electroencephalographic responses in the rat differ between active and inactive locomotor states
- PMID: 30762918
- PMCID: PMC6806018
- DOI: 10.1111/ejn.14373
Pharmaco-electroencephalographic responses in the rat differ between active and inactive locomotor states
Abstract
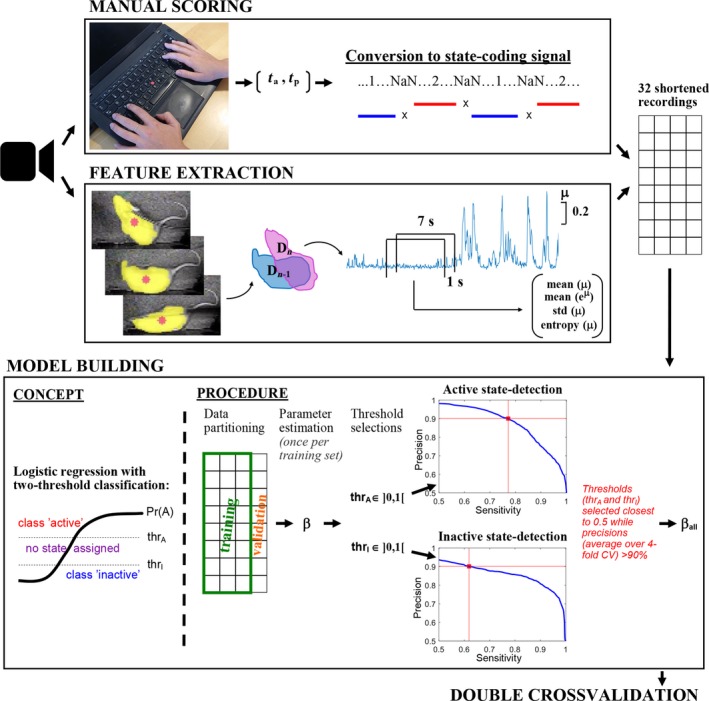
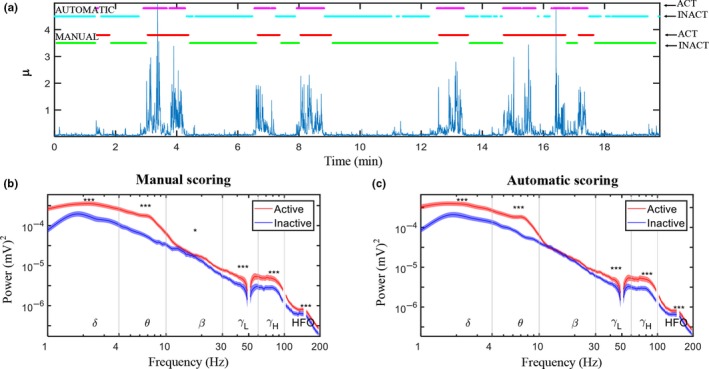
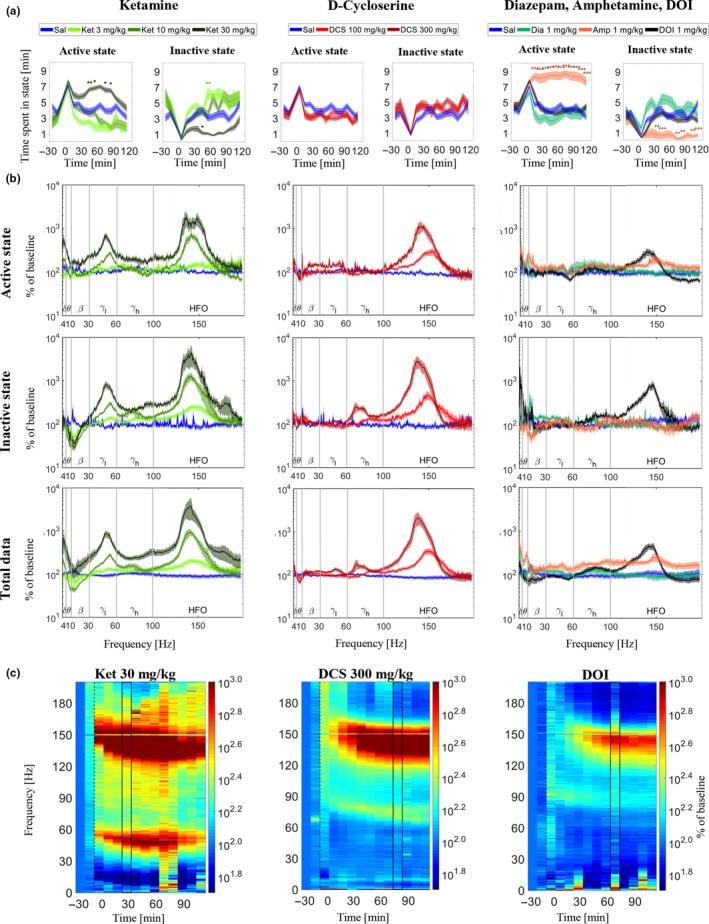
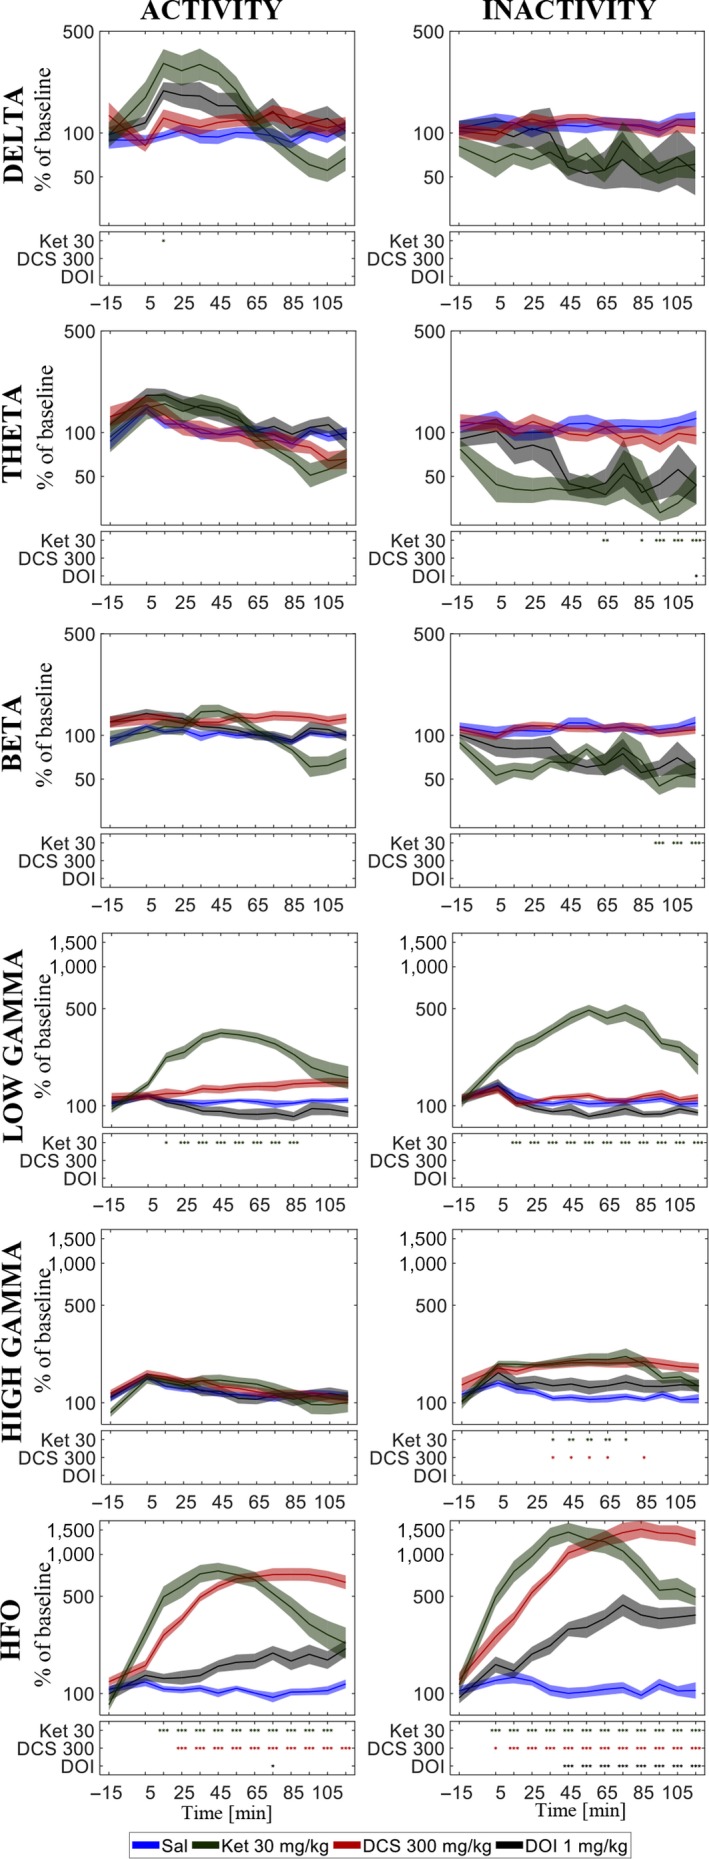
Quantitative electroencephalography from freely moving rats is commonly used as a translational tool for predicting drug-effects in humans. We hypothesized that drug-effects may be expressed differently depending on whether the rat is in active locomotion or sitting still during recording sessions, and proposed automatic state-detection as a viable tool for estimating drug-effects free of hypo-/hyperlocomotion-induced effects. We aimed at developing a fully automatic and validated method for detecting two behavioural states: active and inactive, in one-second intervals and to use the method for evaluating ketamine, DOI, d-cycloserine, d-amphetamine, and diazepam effects specifically within each state. The developed state-detector attained high precision with more than 90% of the detected time correctly classified, and multiple differences between the two detected states were discovered. Ketamine-induced delta activity was found specifically related to locomotion. Ketamine and DOI suppressed theta and beta oscillations exclusively during inactivity. Characteristic gamma and high-frequency oscillations (HFO) enhancements of the NMDAR and 5HT2A modulators, speculated associated with locomotion, were profound and often largest during the inactive state. State-specific analyses, theoretically eliminating biases from altered occurrence of locomotion, revealed only few effects of d-amphetamine and diazepam. Overall, drug-effects were most abundant in the inactive state. In conclusion, this new validated and automatic locomotion state-detection method enables fast and reliable state-specific analysis facilitating discovery of state-dependent drug-effects and control for altered occurrence of locomotion. This may ultimately lead to better cross-species translation of electrophysiological effects of pharmacological modulations.
Keywords: DOI; amphetamine; d-cycloserine; diazepam; ketamine.
© 2019 Federation of European Neuroscience Societies and John Wiley & Sons Ltd.
Conflict of interest statement
The authors state no conflict of interest.
Figures
Similar articles
-
Electroencephalographic spectral and coherence analysis of ketamine in rats: correlation with behavioral effects and pharmacokinetics.Neuropsychobiology. 2011;63(4):202-18. doi: 10.1159/000321803. Epub 2011 Mar 22. Neuropsychobiology. 2011. PMID: 21422767
-
Chronic administration of antipsychotics attenuates ongoing and ketamine-induced increases in cortical γ oscillations.Int J Neuropsychopharmacol. 2014 Nov;17(11):1895-904. doi: 10.1017/S1461145714000959. Epub 2014 Jun 25. Int J Neuropsychopharmacol. 2014. PMID: 24964190
-
Nasal respiration is necessary for ketamine-dependent high frequency network oscillations and behavioral hyperactivity in rats.Sci Rep. 2020 Nov 4;10(1):18981. doi: 10.1038/s41598-020-75641-1. Sci Rep. 2020. PMID: 33149202 Free PMC article.
-
Effects of D-amphetamine and phencyclidine on behavior and extracellular concentrations of neurotensin and dopamine in the ventral striatum and the medial prefrontal cortex of the rat.Behav Brain Res. 1995 Dec 14;72(1-2):103-14. doi: 10.1016/0166-4328(96)00138-6. Behav Brain Res. 1995. PMID: 8788863
-
The effect of dopamine receptor blockade in the rodent nucleus accumbens on local field potential oscillations and motor activity in response to ketamine.Brain Res. 2010 Dec 17;1366:226-32. doi: 10.1016/j.brainres.2010.09.088. Epub 2010 Oct 1. Brain Res. 2010. PMID: 20888326
Cited by
-
Systems-level analysis of local field potentials reveals differential effects of lysergic acid diethylamide and ketamine on neuronal activity and functional connectivity.Front Neurosci. 2023 May 23;17:1175575. doi: 10.3389/fnins.2023.1175575. eCollection 2023. Front Neurosci. 2023. PMID: 37287794 Free PMC article.
-
The effect of ketamine and D-cycloserine on the high frequency resting EEG spectrum in humans.Psychopharmacology (Berl). 2023 Jan;240(1):59-75. doi: 10.1007/s00213-022-06272-9. Epub 2022 Nov 19. Psychopharmacology (Berl). 2023. PMID: 36401646 Free PMC article.
-
Activity-State Dependent Reversal of Ketamine-Induced Resting State EEG Effects by Clozapine and Naltrexone in the Freely Moving Rat.Front Psychiatry. 2022 Jan 27;13:737295. doi: 10.3389/fpsyt.2022.737295. eCollection 2022. Front Psychiatry. 2022. PMID: 35153870 Free PMC article.
-
Discriminating rapid eye movement sleep from wakefulness by analyzing high frequencies from single-channel EEG recordings in mice.Sci Rep. 2023 Jun 13;13(1):9608. doi: 10.1038/s41598-023-36520-7. Sci Rep. 2023. PMID: 37311847 Free PMC article.
-
D2 receptor activation modulates NMDA receptor antagonist-enhanced high-frequency oscillations in the olfactory bulb of freely moving rats.Psychopharmacology (Berl). 2025 May 27. doi: 10.1007/s00213-025-06808-9. Online ahead of print. Psychopharmacology (Berl). 2025. PMID: 40423785
References
MeSH terms
Substances
LinkOut - more resources
Full Text Sources
Other Literature Sources
