

Open-Boundary Molecular Mechanics/Coarse-Grained Framework for Simulations of Low-Resolution G-Protein-Coupled Receptor-Ligand Complexes
- PMID: 30763087
- PMCID: PMC6433333
- DOI: 10.1021/acs.jctc.9b00040
Open-Boundary Molecular Mechanics/Coarse-Grained Framework for Simulations of Low-Resolution G-Protein-Coupled Receptor-Ligand Complexes
Abstract
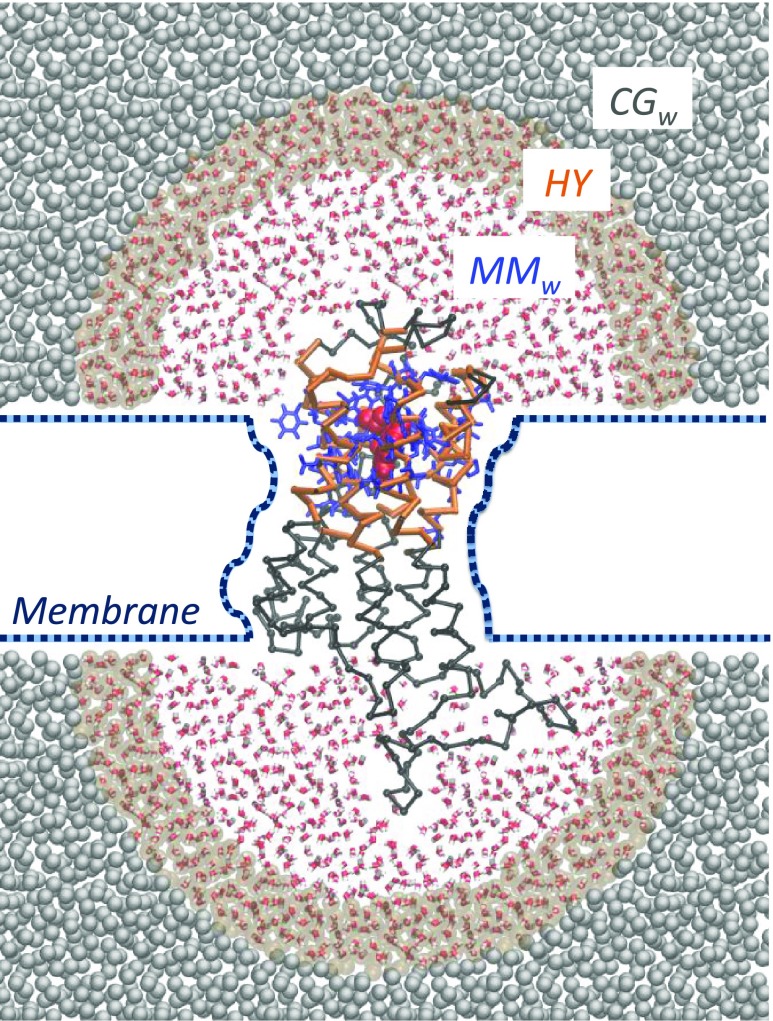
G-protein-coupled receptors (GPCRs) constitute as much as 30% of the overall proteins targeted by FDA-approved drugs. However, paucity of structural experimental information and low sequence identity between members of the family impair the reliability of traditional docking approaches and atomistic molecular dynamics simulations for in silico pharmacological applications. We present here a dual-resolution approach tailored for such low-resolution models. It couples a hybrid molecular mechanics/coarse-grained (MM/CG) scheme, previously developed by us for GPCR-ligand complexes, with a Hamiltonian-based adaptive resolution scheme (H-AdResS) for the solvent. This dual-resolution approach removes potentially inaccurate atomistic details from the model while building a rigorous statistical ensemble-the grand canonical one-in the high-resolution region. We validate the method on a well-studied GPCR-ligand complex, for which the 3D structure is known, against atomistic simulations. This implementation paves the way for future accurate in silico studies of low-resolution ligand/GPCRs models.
Conflict of interest statement
The authors declare no competing financial interest.
Figures
Similar articles
-
Ligand Affinities within the Open-Boundary Molecular Mechanics/Coarse-Grained Framework (I): Alchemical Transformations within the Hamiltonian Adaptive Resolution Scheme.J Phys Chem B. 2021 Jan 28;125(3):789-797. doi: 10.1021/acs.jpcb.0c09805. Epub 2021 Jan 14. J Phys Chem B. 2021. PMID: 33443434
-
Hybrid molecular mechanics/coarse-grained simulations for structural prediction of G-protein coupled receptor/ligand complexes.PLoS One. 2012;7(10):e47332. doi: 10.1371/journal.pone.0047332. Epub 2012 Oct 19. PLoS One. 2012. PMID: 23094046 Free PMC article.
-
Open Boundary Simulations of Proteins and Their Hydration Shells by Hamiltonian Adaptive Resolution Scheme.J Chem Theory Comput. 2017 Nov 14;13(11):5647-5657. doi: 10.1021/acs.jctc.7b00508. Epub 2017 Oct 27. J Chem Theory Comput. 2017. PMID: 28992702
-
Predicting ligand binding poses for low-resolution membrane protein models: Perspectives from multiscale simulations.Biochem Biophys Res Commun. 2018 Mar 29;498(2):366-374. doi: 10.1016/j.bbrc.2018.01.160. Epub 2018 Feb 2. Biochem Biophys Res Commun. 2018. PMID: 29409902 Review.
-
Understanding Ligand Binding to G-Protein Coupled Receptors Using Multiscale Simulations.Front Mol Biosci. 2019 May 3;6:29. doi: 10.3389/fmolb.2019.00029. eCollection 2019. Front Mol Biosci. 2019. PMID: 31131282 Free PMC article. Review.
Cited by
-
Recent Advances in Coarse-Grained Models for Biomolecules and Their Applications.Int J Mol Sci. 2019 Aug 1;20(15):3774. doi: 10.3390/ijms20153774. Int J Mol Sci. 2019. PMID: 31375023 Free PMC article. Review.
-
Ligand-protein interactions in lysozyme investigated through a dual-resolution model.Proteins. 2020 Oct;88(10):1351-1360. doi: 10.1002/prot.25954. Epub 2020 Jun 15. Proteins. 2020. PMID: 32525263 Free PMC article.
-
Hybrid MM/CG Webserver: Automatic Set Up of Molecular Mechanics/Coarse-Grained Simulations for Human G Protein-Coupled Receptor/Ligand Complexes.Front Mol Biosci. 2020 Sep 4;7:576689. doi: 10.3389/fmolb.2020.576689. eCollection 2020. Front Mol Biosci. 2020. PMID: 33102525 Free PMC article.
-
Understanding and Controlling Food Protein Structure and Function in Foods: Perspectives from Experiments and Computer Simulations.Annu Rev Food Sci Technol. 2020 Mar 25;11:365-387. doi: 10.1146/annurev-food-032519-051640. Epub 2020 Jan 17. Annu Rev Food Sci Technol. 2020. PMID: 31951485 Free PMC article. Review.
-
Non-Equilibrium Modeling of Concentration-Driven processes with Constant Chemical Potential Molecular Dynamics Simulations.Acc Chem Res. 2023 May 16;56(10):1156-1167. doi: 10.1021/acs.accounts.2c00811. Epub 2023 Apr 25. Acc Chem Res. 2023. PMID: 37120847 Free PMC article.
References
MeSH terms
Substances
LinkOut - more resources
Full Text Sources